1
國
立
交
通
大
學
資訊科學與工程研究所
碩
士
論
文
自動檢索節奏架構相符的舞蹈和音樂
Automatic retrieval of consistent dance motion and music
through rhythmic structure
研 究 生:謝偉鴻
指導教授:林奕成 教授
I
Automatic retrieval of consistent dance motion and
music through rhythmic structure
Student: Wai-Hong Che
Advisor: Dr. I-Chen Lin
Institute of Computer Science and Engineering
National Chiao Tung University
Abstract
Dance is an art form that often accompanies corresponding music with rhythm. To compose a dance with the accompanied music, the choreographers usually focus on rhythmic articulation, theme and variation, etc. The rhythms are essential for producing dancing motion and its accompanied music. In this thesis, we propose a method that searches best-matching music in database according to the input dance motion without any domain knowledge between music design and dance design. Based on the popular music (rock, pop, hip-hop, etc.) in our database, we employ constrained clustering algorithm to preprocess their cluster paths. We then rank a score through their corresponding rhythm between dance motion and music. This score focuses on their repeated rhythmic parts and consistency points. Our goal is to help the users retrieve best-fit pairs between dance motion and music with their rhythmic structure.
II
Acknowledgement
感謝我的指導老師林奕成老師對我的照顧、體諒,也要感謝老師的教導。老 師不單是教導我們專業知識的良師,而且還教導我們很多報告和處事要注意的地 方。老師還包容了我們懶惰的性格,和改善了我們很多缺點。在此我真的很感謝 老師一直的指導和對我們的付出。 在研究生涯內,也遇到很多朋友和同學的支持。感謝在實驗室的學長姐,同 學們和學弟妹。實驗室親切熱情的氣氛讓我的研究室生活增添了很多色彩,而且 還讓我感受到在台灣大家庭的生活氣氛。當然我在研究上的很多困難也很高興大 家的幫忙和照顧。這都是我在實驗室很多寶貴的回憶,感謝大家對我的照顧和包 容。 在這也要感謝家人對我的支持和鼓勵,使得我可以踏進我的研究生生活。讓 我可以得到老師專業的指導,讓我遇到學長姐,同學們和學弟妹親切熱情的照顧, 也讓我更充實我人生的眼光。 最後,當然是很高興完成自己的第一篇論文,但結果並沒達到想像的要求。 但對我將來踏進社會有很大的幫助和影響。我會繼續研究生活學到的很多東西, 對日後將來發揮更大的作用。III
Content
Abstract ... I
Table of Content ... I
I
1
Introduction ... 1
2
Related Work ... 6
2.1
Motion Segmentation and Clustering
... 62.2
Music Segmentation and Clustering
... 82.3
String Comparison
... 93
Motion and Music analysis ... 10
3.1
Motion Feature Analysis
... 103.2
Music Feature Analysis
... 113.3
Segmentation and Clustering
... 134
Ranking algorithm ... 1
64.1
Find repeated substring in clustering strings
... 164.2
Ranking score
... 185
Experiment and Discussion ... 22
6
Conclusion and Future Works ... 26
1
1. Introduction
1.1 Motivation
Retrieving or composing appropriate music for a performer’s motion sequence is essential in game and animation production. At present, it is accessible for common users to compose dance motion with body motion through specific motion sensing input devices such as Kinect for Xbox 360, and insert background music in dance motion by searching on the Internet. However, it may require considerable time and labors to find best combination for the composition from a large quantity of motion and music data sources. Our goal is to help composers finding appropriate music for a given dance motion input.
Dance is one kind of performing arts that generally refers to movement of the body, and usually rhythmic, patterned and accompanied by music. A choreographer designed a composition that usually focuses on rhythmic articulation, theme and variation, etc. And most of dance usually has an accompanied music and the poses are designed by rhythm of the accompanied music.
On the other hand, music is another kind of performing arts and has more genres such as rock, pop, hip-hop, etc. Most of the popular music is sectional and the most common sections are verse, chorus or refrain, and bridge. Other common forms include thirty-two-bar form, verse-chorus form, and the twelve bar blues. Popular music songs are rarely composed liked through-composed (through-composed music is relatively continuous, non-sectional, and/or non-repetitive.).
2 In this thesis, we make use of the sectionalization properties in both dance motion and music, and propose a method of finding the consistency between dance motion and music for rhythmic structure matching.
1.2 Frameworks
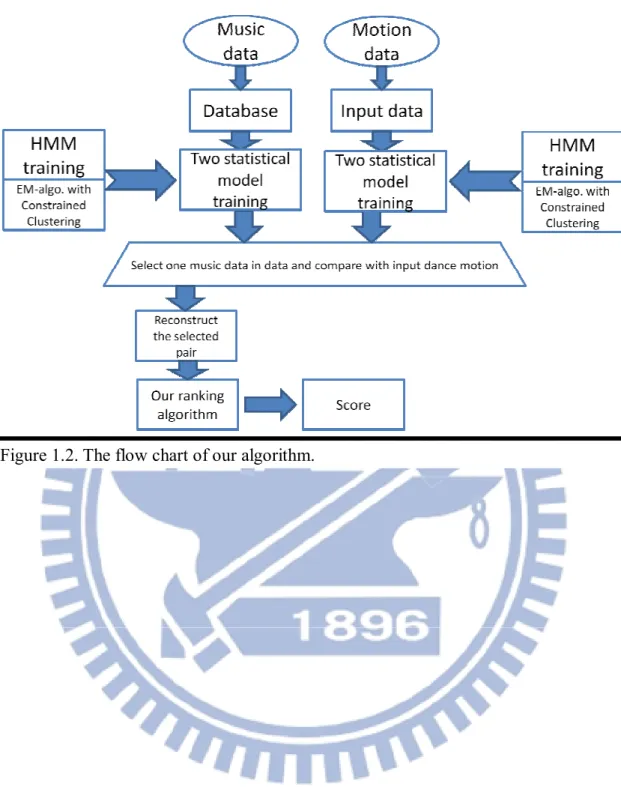
In this thesis, we propose an automatic method to find the consistent between dance motion and music. We preprocess all music in database and use a dance motion as an input to query the best-fit music in database. We employ their mutual properties such as rhythm to associate the dance motion and music. To retrieve the rhythmic property, we use two statistical models, proposed by M. Levy and M. Sandler [2008], to segment and cluster music in database and the input dance motion.
Before training the statistical models, we need to consider the appropriate observation features (Section 3.1 & 3.2). The Constant-Q spectral transform (CQT) [Brown 1991] is one of the popular transform in musical signal. This transform has advantages for analysis of musical sounds compared with the conventional discrete Fourier transform because CQT can assign the range of human hearing frequencies such as ten octaves from 20Hz to around 20kHz. In this thesis, we choose the CQT as our musical observation features data because CQT well suits the musical data. We certainly allow to change another transform to our musical observation features data such as Chroma or Mel-frequency cepstral coefficients (MFCCs) are the same popular as CQT. On the other hand, the spatial space in dance motion is commonly used as motion observation features data that consist of a hierarchical skeletal structure and trajectories of degrees of freedom (DOFs) of joints. For analyzing of dance motion,
3 we calculate each joint position in the three-dimensional coordinate space. It is simple to distinguish two different poses of dance motion in the three-dimensional coordinate.
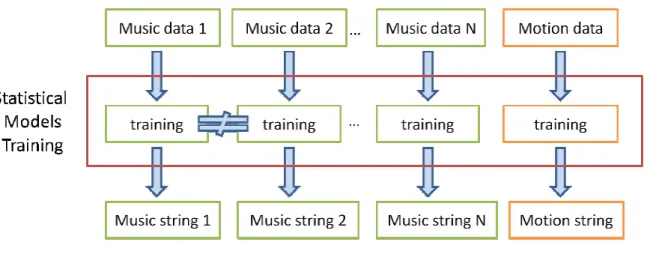
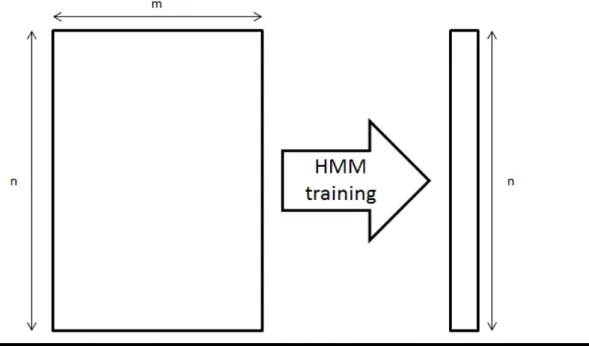
After the observation features, the features are represented by an m x n matrix (Figure 1.1) which m is the size of features and n is the total length size of the training input data. In order to reduce the high-dimension matrix from the observation feature data to one level label number, we apply a hidden Markov model (HMM) to train the observation features using an 80-state HMM (Section 3.3) and assign a number to represent each feature data (Figure 1.1). Our purpose is to find a label sequence number substituted the complicated observation features.
After finishing the reduced dimension labeling and generated label sequence number, we then employ Expectation-Maximization algorithm [LS08] to cluster the new sequence label with constrained clustering algorithm (Section 3.4). This algorithm is to enforce temporal continuity on cluster assignments. Each cluster is labeled by an alphabet letter thus all music and the input dance motion can be represented by a sequence of alphabet letters. Our ranking algorithm is based on comparing the consistency between cluster string of dance motion and cluster string of music. All music in database is pre-computed before our ranking algorithm.
Given a sequence data by the HMM training and EM-algorithm with constrained clustering algorithm, we define an objective function (our ranking algorithm) to find the best-fit pair between the input dance motion and music where the objective function is employed by their rhythmic structure (Section 4). The sequence has rhythmic structure because the constrained clustering algorithm enforces temporal
4 continuity between adjacently neighboring labels. The constrained clustering results can decide their rhythmical properties and the input dance motion is through rhythmic structure to decide the best-fit music in database. Figure 1.2 is shown the flow chart of our algorithm.
Figure 1.1. The left matrix is the pure data before the HMM training, where m is the size of feature data n and n is the number of the training data length. The right vector is an answer of one level label number after using Viterbi algorithm to decode the label of state with HMM training data.
5 Figure 1.2. The flow chart of our algorithm.
6
2. Related Work
2.1 Motion Segmentation and Clustering
In realistic human motion, automatic segmentation in distinctive motions is always used in similar motion matching [KGP02, BVP*08, KTW*10], motion synthesis [KGP02, LWS02, CH07] and motion compression [LM06, LPL*11]. However, all the methods are to segment motions into distinct behaviors based on pose similarity or statistical properties.
Kovar et al. [KGP02] proposed a method constructing a graph that can find the similar motion sequences using graph search techniques. According to Kovar et al. [KGP02], we can use the distance plots to extract the transition points and construct a directed graph called a motion graph. The motion graph can generate a new arbitrary motion by connecting path from initial node to end node, as shown in Figure 2.1. P. Beaudoin et al. [BVP*08] proposed a method that not only build a motion-motif graph liked motion graph, as shown in Figure 2.2, but also cluster the similarity motion clip together. They performed vector quantization to extract the motion motifs
7 parts. Each individual cluster is assigned as labels, and each label is shown as an alphabet letter. All the motion sequences are represented as strings. They constructed a directed graph call a motion-motif graph that nodes are connected by the adjacent letter of motion sequence strings.
In this thesis, we take an alphabet letter as our cluster labels the same as motion-motif graph. After that, we use this identifying letters to calculate similar relationship between input data and all data in database. We suppose that candidates of our features can be used by the distance function in Kovar et al. [KGP02] and/or the vector quantization in P. Beaudoin et al. [BVP*08], and train our system based on those features.
Yan Li et al. [LWS02] proposed a two-level statistical model to represent character motion. In their statistical model, the basic element is called a motion texton and a motion texton is used to describe one piece of motion clip. They assumed that there are Nt motion textons and each texton represent a time T = { T1, T2, …, TNt },
they then employed an HMM to train all motion texton data and generated corresponding labels Θ = {θ1, θ2, …, θNt} to represent distribution of motion texton.
They then use the motion translation and joint rotation as a state of HMM and a new labels as an observation. After training the HMM, the corresponding labels can be represented by the motion texton. By using motion graph [KGP02] and Linear Dynamic System (LDS), and applying the Markov Chain matrix, they further used expectation-maximization (EM) algorithm to find the optimum segmentation group.
Unlike the motion texton, we apply a similarity approach to train our motion data and generate labels to represent our motion data for reducing the high-dimensional
8 data. The sequences of repetition motion are used by [LS08], where they used a Constrained Clustering Algorithm to build a second level statistical model and find the optimum segmentation group.
2.2 Music Segmentation and Clustering
For analyzing a variety of musical sounds, music is always represented by audio signal which is convenient to extract specific perceptual features in musical sound. Mark Levy and Mark Sandler [LS08] proposed a method to segment the musical sounds based on features of audio signal. They employed the Hidden Markov Model (HMM) to reconstruct a new low-level label which is similar to project features to new space. After training the HMM, they decoded the audio signal data using the trained HMM to retrieve the most likely sequence of low-level label. However, the low-level label was not a final cluster result. They required the constrained clustering algorithm to the temporal continuity on cluster assignments.
In this thesis, we directly apply the Constrained Clustering Algorithm [LS08]. The Constrained Clustering Algorithm ensure that the neighboring labels be grouped in the same cluster, where they use expectation-maximization to find an accurate cluster. The Constrained Clustering Algorithm is based on the property of common form of the popular music. The insight is that the popular music is usually verse-chorus form. The verse parts usually have the same tempo, and meter on their parts and the chorus parts too, but their rhythms are usually different. Therefore, the Constrained Clustering Algorithm can separated them whether the neighboring rhythm are different.
9
2.3 String Comparison
There are many approximate string matching algorithm such as Levenshtein distance, Hamming distance, Longest common subsequence distance, etc. In the above string matching algorithms, two comparing strings x and y can be of different lengths. Those algorithms can measure a distance as the weight to decide their similarity between two strings.
However, the character in two comparing strings x and y need to represent a same symbol, which means that the character is the same symbol between strings. For example, there are two strings “survey” and “surgery” and they have the same character ‘s’. Unfortunately, we need to compare two strings without the same character that characters of string represent the rhythmic structure on music and dance motion. The traditional string matching algorithm cannot solve our rhythmic strings. We therefore define a new algorithm to compare the rhythmic structure, where the characters in the strings do not have to be in the identical symbol set.
10
3. Motion and Music analysis
In this chapter, we describe several features of motion and music and explain how to segment and cluster dance motion and music through training two statistical models. We discuss features of motion in section 3.1 and features of music in section 3.2. Section 3.3 introduces the training algorithm by using Mark Levy and Mark Sandler [LS08].
3.1 Motion Feature Analysis
Considering features of dance motion data, each frame xi (i=1, 2, ..., n) is
represented by 3Nj-dimensional vector xi = [N1, N2, …, Nj], where j is the number of
total joints and each N is represented by three dimensional (Nx, Ny, Nz). The
3Nj-dimensional vector can be regarded as strong features and can let us easily
distinguish the different sequent motion clip. Figure 3.1 is shown our total joints and their positions. Therefore, we choose 3Nj-dimensional vector as our motion features.
Certainly, any other strong features can replace the 3Nj-dimensional vector if the
feature can easily be distinguished.
Since plenty of the dimensionality of the features can lead a slow statistical model step, we use principal component analysis (PCA) to reduce the entire sequence of features as well as reduction of motion feature dimension. We assign each frame as vector xi, and define an M x N matrix (shown in Figure 1.1) to denote the dance
motion where M = 3Nj-dimensional vector and N is the total frame size. We then
calculate the covariance matrix C of dimension M x N matrix. To employ the covariance matrix C, we calculate the eigenvectors V and eigenvalues.
D =
11 When the eigenvectors has calculated, we can choose components from the inverse matrix with highest eigenvalues.
Y = ( − )
where μ is the mean value of column in the matrix M and V-1 is the inverse eigenvectors.
3.2 Music Feature Analysis
Music is usually represented by audio signal. Variety of properties of audio signal can present their specific perceptual features. Some properties are obvious such as amplitude and fundamental frequency.
The common popular music is often composed by verse-chorus form. The verses and choruses are also considered as the primary elements. A verse usually has the same melody, which sometime may have some slight modifications, and the lyrics most change in this section. A chorus usually has a melodic phrase and a key lyrical line which is repeated. The verse and chorus are usually repeated throughout a song though the bridge, intro, and outro (also called a "coda") are usually only used once. It Figure 3.1. Our dance motion data model. There are 20 joints and each joint has three dimensional coordinate point (x, y, z).
12 is possible to approach automatic structural segmentation by analyzing this kind of strong characteristics. Hence, we use CQT to represent as our musical features and apply a hidden Markov model (HMM) to train each of music in our database with a fairly large number of states to represent low-level state label. In section 3.3, we discuss how to cluster the sequence state label by Constrained Clustering algorithm proposed by Mark Levy and Mark Sandler [LS08].
Why do we choose CQT as our musical features? Music and speech are two major audio data. Different from speech, music consists of a sequence of notes whose frequencies are already defined. The Constant-Q spectral transform (CQT) [Brown 1991] can be used to analyze musical signals and can be effectively employed as a front end for measurements of fundamental frequency. This transform has advantages for the analysis of musical signals compared with the conventional discrete Fourier transform. The DFT computes frequency components on a linear scale with a particular fixed resolution or bandwidth (frequency spacing between components). Therefore, it frequently results in insufficient resolution for low musical frequencies and better resolution than needed at high frequencies. However, we can use Chroma or Mel-frequency cepstral coefficients (MFCCs) to substitute CQT because Chroma and Mel-frequency are also able to represent the musical property but they may make the conflict with vocal music.
To alleviate the expensive statistical model step, we apply PCA to reduce the dimensionality of features as well as reduction of motion feature dimension in section 3.1.
13
3.3 Segmentation and Clustering
The goal of this section is to group the similar behavior across the entire data where the entire data is all the music in database and the input dance motion. The entire data are trained in the two statistical models independently. Using same statistical models to segment and cluster all the music and motion feature data, but each entire data has their own initial variable in the statistical models as shown in Figure 3.2.
We apply a hidden Markov model (HMM) with a fairly large number of states on the entire sequence of feature vectors which the training data is dance motion data or music data. Suppose two sets X = {x1, x2, ..., xm} and Y = {y1, y2, ..., yn}, where X is
the feature vectors set, Y is the low-level labels set, m is size of feature vectors and n is the number of HMM states. Each vector xi in set X has temporal relationship
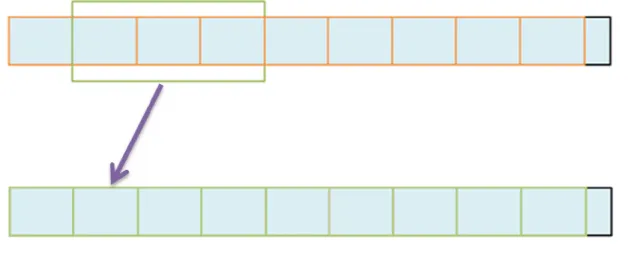
between their neighbor, we thus employ a window size to connect the adjacent labels and shift a hop size for the next vector xi+1, as shown in Figure 3.3.
Figure 3.2. The simple statistical models flow chart and shown each data is independently trained by the models
14 Figure 3.3. The small rectangle (orange) is hop size and three rectangles (green) is window size.
According to the HMM learning algorithm, we can denote HMM states as low-level labels and observations as features vectors. The probability of transition Φ
= (φ1, φ2, …, φn) correspond to the component weight for Gaussian mixtures modeling
the features x for each segment-type.
P(x| ) = φ P(x| )
According to Gaussian mixtures modeling, we can rewrite equation (1):
P(x) = φ ( |μ , Σ )
where μc is the mean of the c-th HMM state and Σ is the covariance.
After training the HMM, the feature data xi has become to low-level labels. We
then decode the features using the trained HMM to retrieve the most likely sequence of low-level label states.
15 Finally, we decode labels to calculate the cluster in each feature vectors set. Suppose that the labels Y are generated using the model parameters Θ:
P( | = , Θ) = 1 −1
ρ ( , ) where k is the maximum cluster number,
ρ is the length scale of the clusters,
Z is a partition function (normalization term),
Θ is a hidden set of generative model parameters consists of cluster prototypes,
and Θ = (m1, m2, …, mk) and k is the possible segment-type.
The function d(x, m) is a Jensen-Shannon divergence which is to capture similarity between x and m.
Since the observations are of mutual relationship, a set of observable “must-link” constrains C = (c12, c13, …, cn-1n) where cij = 1 if xi and xj belong to the same cluster,
vice versa. Therefore, the probability distribution function is changed:
P( | = , Θ) = 1 − 1
ρ ( , ) − λ (1 − δ ,
!
)
where λ is fixed to 0.02, and the constrained function and the Jensen-Shannon divergence are independent.
We use expectation-maximization to calculate the distribution function. E-Step: calculate the probability distribution function e.q.(4)
( ) = 1 − 1
ρ ( , ) − λ (1 − δ ,
!
)
M-Step: update to the parameters using the pi(yi) in the E-Step.
= ∑ ( )
∑ ( )
We run the EM-algorithm iteratively and p converges rapidly to become a local maximum.
16
4. Ranking algorithm
In chapter 3, we have calculated clusters of input dance motion and all music data in database and each cluster is assigned by an alphabet letter sequence. Therefore, input dance motion and all music data can be represented by these alphabet letter sequences. In this section, we describe our ranking algorithm and how to find the appropriate score of two clustering strings.
4.1 Find repeated substrings in clustering strings
There are some string’s per-processing before describing the ranking algorithm because it is hard to find the relationship using the raw of clustering string data. Our ranking algorithm requires finding the self-repeated substrings, we thus calculate the self-repeated substrings using a linear shift comparison algorithm. Before that, we suppose the same alphabet has the same behavior by the statistical models training. Therefore, we first shorten all clustering strings. A sequence of identical clustering string is represented by few letters only. For example:
The clustering string Sc: AAAAAAAAAABBBBBBAAAAAAAAABBBBBCCCCC
The shortened string Ss: ABABC
After the shortened step, we use the shortened string to calculate the self-repeated substrings. We use the same example shortened string “ABABC” to explain the algorithm and the procedures are as follows:
1. Shift the string from left to right by one character
2. Compare with the original string and find the repeated string Srep
3. Repeat step 1 whether the string is shifted at the last character.
The total times of comparison are length of string N-1. An example is shown in Figure 4.1.
17 A B A B C A B A B C A B A B C A B A B C A B A B C
Figure 4.1: A simple shortened string example. The toppest row is the original target string. The red character is shown the self-repeated substring. The total comparison time is N-1 times, where N is the length of a target string.
After the comparison algorithm, we find one self-repeated subset “AB” in the second shift times as shown in Figure 4.1. We employ the linear shift comparison algorithm to find all self-repeated substring. However, we show a complex shortened string to explain one unavoidable problem on our linear shift comparison algorithm. The unavoidable problem is that the above mentioned algorithm can just only find the longest self-repeated string in each shifting comparison. For example, we design a new shortened string “ABCADBCDBCDCADBC” as shown Figure 4.2. The linear shift comparison algorithm finds the longest repeated string in each shifted string comparison. For instance, in figure 4.2, the repeated string “DBC” appeared three times. It is the subset of repeated string but it is not a longest repeated string. Therefore, we need to search all subset of longest repeated string exclusively to avoid the missing repeated string and mark it as subset of repeated string if the subset appeared twice or more.
For example, the repeated string “DBCD” can be divided by each subset such as { “D”, “B”, “C”, “DB”, “BC”, “CD”, “DBC”, BCD” }. All these subset have repeated twice or more as well.
18 Finally, we mark all offsets in all subsets of repeated string. For example, the subset “DBC” appear three times and their offsets are “4”, “7” and “13”, which can be represented as “DBC”={4, 7, 13}. All offsets are convenient to calculate the ranking score. The detail of the ranking score is described in Section 4.2
4.2 Ranking score
In this section, we propose how to find the appropriate pairs between dance motion and music data with their self-repeated substrings. We observe that choreographers and movie designers usually like to separate different motions by music segmentation point, where the separated points usually appear on intersection between verse and chorus. The composers like to design a similar motion in the same section, while as the music authors like to write the same lyrics in the chorus section. Therefore, the consistency points and corresponding repeated clusters can be regarded as a significant metric to rank the score of the appropriate pairs.
4.2.1 Corresponding repeated clusters
As described in section 4.1, all the self-repeated substring has been calculated.
0 1 2 3 4 5 6 7 8 9 10 11 12 13 14 15 16 17 18
A B C A D B C D B C D C A D B C A B C A D B C D B C D C A D B C A B C A D B C D B C D C A D B C Figure 4.2. The toppest row is the offset of the original string. The second row is the original target string. The third row shifts the target string to right by three and we then find the repeated string “DBCD”. The lowest row shifts the target string to right by nine and we then find the repeated string “CADBC”. The frame box is a subset of repeated string which our algorithm cannot find. However, those are the subset of repeated string as well.
19 Before we calculate the corresponding repeated clusters between dance motion and music, we need to reconstruct the shorten string to satisfy the corresponding repeated cluster algorithm. Therefore, we employ their consistency point to reconstruct the same length of shorten string. For example, we have two clustering strings of motion
Smo and music Smu, we then draw abreast of us as shown in Figure 4.3.
According to Figure 4.3, we have new shorten strings that Smo =
AABBAABBCC and Smu = αββααββγγα. The length of two shorten strings is 10.
These new shorten strings can also satisfy to calculate the self-repeated substrings using our linear shift comparison algorithm in section 4.1 and the consistency points in section 4.2.2.
After the data reconstruction, we employ their offset set in each self-repeated substring to calculate the corresponding rhythmic structure. The rank of the corresponding rhythmic structure formula needs to satisfy that the compared substrings are the same length. The rank of corresponding rhythmic structure is as follows:
1. Choose a substring Msub in the motion substring set.
2. Compare all the substrings Nsub in the music substring set that has the same
length with substring Msub.
3. Calculate the E.q. (5) as follow:
( ) = ∑ ( ∩ ) ∗ Weight( len(M ) ) ∑ all Weight
20
Sc: A A A A A B B B B B A A A A B B B B B C C C C C C
p: 0 0 0 0 0 1 0 0 0 0 1 0 0 0 1 0 0 0 0 1 0 0 0 0 0 Figure 4.4: The first row is the clustering string Sc and bottom array is the separate point p.
4.2.2 Consistency points
We use an intuitive but practical formula to determine the consistency points between appropriate pairs. The clustering string is composed of different cluster and each cluster represents different section in verse-chorus form. We suppose values of
p(i) representing the separate point as shown in Figure 4.4. In section 4.2.1, the first
and second steps in corresponding repeated clusters algorithm choose two substring
Msub, Nsub. We compare separate point of two substrings.
(i) = δ M (i), N (i + k) , = [−10,10]
where Rpoint is one rank of consistency point, Msub, Nsub are compared with their string
form, not a shortened form. δ(a, b) is the Kronecker Delta function if both a and b are 1 then return true, and k is the deviation of the consistency point. The rank of Msub
consistency point is:
(M ) = ∑ ( )
ℎ + 1
where length of substring+1 is a normalizing term. Ψ is rank of total consistency points.
Smo: A A A A A B B B B B A A A A B B B B B C C C C C C
Smu: α α α β β β β β α α α α β β β β γ γ γ γ γ γ α α α
Figure 4.3. Abreast of the clustering strings between Smo and Smu. According to these two
21
4.2.3 Calculate the ranking score:
The ranking score is related by their consistency points and corresponding repeated clusters. Therefore, we multiply two terms and sum the product of substring of dance motion.
Score = ( ) ∗ ( )
where Ψrhythm is score of corresponding repeated cluster and Rpoint is score of
22
5. Experiment and Discussion
5.1 Experiment
Our motion data refer to CMU Mocap data format. The dance motion data came from a free 3D dancing design software called MikuMikuDance (MMD). It is so easy to compose a dance motion and create 3D animation movies. We use their transformation software tools to convert the MMD data to CMU Mocap data. We then remove the extra joints such as finger and toe. Our training features only consider about 20 joints and transfer hierarchical joint angles to position space. The sampling rate of mocap data is 30Hz and music data is 44kHz. The hopsize and window size are 0.4 seconds and 1.2 seconds.
Results of dance motion and music segmentation and clustering We show the
results of the music feature segmentation and clustering by the two statistical models. 1
2 3
The first is “Bad romance” recording from artist Lady Gaga. The second is “Just dance” recording from Lady Gaga either. The third is “ルカルカ★ナイトフィーバ ー”, voice from Vocaloid 2 third series.
Three of the testing music show the segmentation and clustering results of music. We use different color to replace the alphabet label and the same color represents the same clustering. It is so easy to find the corresponding repeated clustering through our eyes.
23 1
2 3
All dance motion are downloaded from Nicovideo uploader.
The first is from the site: http://www.nicovideo.jp/watch/sm7821565 The second is from the site: http://www.nicovideo.jp/watch/sm9194284 The third is from the site: http://www.nicovideo.jp/watch/sm10469234
Three of the testing music also show the segmentation and clustering results of dance motion. And it is so easy to find the corresponding repeated clustering through our eyes either.
Results of Ranking Algorithm There are several consistent results shown as
follows:
(p.s.) Motion(Smo) and Music(Smu) have the same color such as yellow, but two
clusters don’t represent the same cluster.
Example 1: Motion(Smo) and Music(Smu) came from the website
http://donburiroom.blog8.fc2.com (Author: DONKEY). The motion and music are positively corresponded because they are artificially designed.
Data1 is an existing pair from The repeated parts show on orange window’s frames. And their ranking mark is 0.17682 through our ranking algorithm.
It is easy to find the orange window’s frames are the repeated parts and their Smu:
24 consistency points are partly matched. The ranking mark is the highest score in our database music because this pair is the artificial composition.
Example 2: Motion(Smo) is the same as example 1 and Music(Smu) came from our
ranking algorithm. The song is one best mark through our ranking algorithm.
Data2 is one best-fit result from our ranking algorithm. The repeated parts show on orange window’s frames. Their ranking mark is 0.06487.
Different between example 1 and example 2 is the size of the orange window’s frames and both of them have the repeated parts and their consistency points are partly
matched.
In these two examples, the repeated parts show their rhythmic structure and these parts similar as verse-chorus form. Obviously, we can see that ranking mark of
example 1 is higher than example 2 and the length of orange window’s frames in example 1 is longer than example 2 too. In our test data, example 1 is an elaborate composition by Author, their rhythmic structures are mostly matched. On the other hand, our result is not through man-made, but we can also see their rhythmic structures are matched in example 2.
5.2 Discussion
We discuss about the motion clustering, the weakness of our objective function and some thresholds.
Motion clustering Our similarity motion retrieval algorithm is proposed by M. Smu:
25 Levy and M. Sandler [LS08]. However, their algorithm is not aimed at similarity motion or heterogeneous retrieval. We thus need to find strong training features to satisfy the algorithm. We first try the raw motion capture data which contains the global transition positions and Euler angles of joints. The raw data is represented by row data of training matrix. After constructed the training matrix, we start to train a large fairly number with first statistical model (HMM) and second statistical model (EM-algorithm). Unfortunately, the raw data isn’t a strong feature on the HMM training because the Euler angles of joints are unclear to distinguish two posees.
Therefore, we transfer hierarchical joint angles to position space. It is easy to distinct between two different pose on position space. After training two statistical models, the clustering result is clearly separated the different motions. Finally, we choose the position space as our features.
Objective function Our approach mainly focuses on repeated structure. In our corresponding repeated cluster algorithm, we consider whether the two rhythmical structures are both matched and the users need not have any more domain knowledge. We don’t consider that if the motion verse part corresponds with the music chorus part. Therefore, we may still find an unexpected pairs with a high ranking score.
Thresholds We mention that it is important to choose the strong feature for two
statistical models. Even the strong feature are chosen, the training data must also be a verse-chorus form. If song or dance motion is monotonous, the two statistical models might not success to get a right training result. The main reason is that the statistical models are aimed at the repeated parts as the training seeds.
26
6. Conclusion and Future Work
We have shown a novel approach to find a corresponding pair between dance motion and music. Through unsupervised learning, we discover the segmentation and clustering in dance motion and music that presented by two statistical models. In the training step, we can observe that the clustering sequence has a rhythmical structure. We employ these rhythmical structures to rank a score deciding the corresponding relationships. In ranking algorithm, the semantic relationships, such as their emotion relations, are not a strong ranking point between dance motion and music. We skip the semantic relationships and focus on repeated clusters and consistency points to design our objective function.
In this thesis, we can also enhance the objective function so that the strong relationships can be found. The objective function can insert some new terms such as the tempo beat consistency and emotion relations. Besides that, the more strong motion features can also improve to distinguish the similar pose.
27
Reference:
[BVP* 2008] P. Beaudoin, M. van de Panne, P Poulin, S. Coros.: “Motion-Motif Graphs,” ACM/EG Symposium on Computer Animation(SCA ‘08), 10 pages, 2008
[KGP 2002] L. Kovar, M. Gleicher and F. Pighin: “Motion Graph,” ACM Trans. Graphics, vol. 21, no. 3, pp. 473-482, 2002.
[KG 2004] Kovar L., Gleicher M.: “Automated extraction and parameterization of motions in large data sets,” ACM Trans. Graphics 23, 3 (2004), 559–568.
[KTW* 2010] B. Krüger, J. Tautges, A. Weber and A. Zinke.: “Fast Local and Global Similarity Searches in Large Motion Capture Databases,” ACM SIGGRAPH/Eurographics Symposium on Computer Animation(SCA), 10 pages, 2010
[LPL* 2011] I-Chen Lin, Jen-Yu Peng, Chao-Chih Lin and Ming-Han Tsai.: “Adaptive Motion Data Representation with Repeated Motion Analysis,” IEEE Trans on Visualization and Computer Graphic, vol. 17, no. 4, pp. 527-538, 2011
[LM 2006] G. Liu and L. McMillan.: “Segment-Based Human Motion Compression,” Proc. ACM SIGGRAPH/ EG Symposium on Computer Animation (SCA ’06), pp. 127-135, 2006
[LWS 2002] Yan Li, Tianshu Wang and Heung-Yeung Shum.: “Motion texture: a two-level statistical model for character motion synthesis,” ACM Trans. Graphics, vol. 21, no.3, July 2002 [LS 2008] M. Levy, M. Sandler: “Structural Segmentation of Musical
Audio by Constrained Clustering,” IEEE Trans. on Audio, Speech, and Language processing, Vol.16, No.2, 2008
![Figure 2.1: motion graph [KGP02] Figure 2.2: motion-motif graph [BVP*08]](https://thumb-ap.123doks.com/thumbv2/9libinfo/8698840.199035/10.892.74.838.356.846/figure-motion-graph-kgp-figure-motion-motif-graph.webp)