國
立
交
通
大
學
理學院應用科技學程
碩
士
論
文
互補式金氧半導體光二極體晶片
葡萄糖與組織胺濃度檢測光學感測系統
An optical bio-sensing system for the determination
of glucose and histamine based on CMOS photodiode chip
研 究 生:游秉鈞
指導教授:楊裕雄 教授
互補式金氧半導體光二極體晶片
葡萄糖與組織胺濃度檢測光學感測系統
An optical bio-sensing system for the determination of glucose and
histamine based on CMOS photodiode chip
研 究 生:游秉鈞 Student:Ping-chun Yu
指導教授:楊裕雄 Advisor:Yuh-Shyong Yang
國 立 交 通 大 學
理學院應用科技學程
碩 士 論 文
A ThesisSubmitted to Degree Program of Applied Science and Technology College of Science
National Chiao Tung University in partial Fulfillment of the Requirements
for the Degree of Master
in
Degree Program of Applied Science and Technology Hsinchu, Taiwan, Republic of China
中文摘要
在此研究中,我們經由整合互補式金氧半導體製程所生產的光二極體感應晶 片、耦合酵素催化反應,發展出一套生醫感測系統。由於生醫診斷上的重要性, 我們選擇了葡萄糖與組織胺做為本系統的測量標的。我們發展的組裝系統所量測 得到的葡萄糖與組織胺的Km值分別為4.9 and 125 μM,其值與UV/Vis光譜儀所分 別測量而得到的值(7.2 and 160 μM)相當接近。我們的系統對於葡萄糖與組織胺的 最低量測濃度分別為1 μM 與 10 μM。 再者,我們的系統能測量到葡萄糖與組 織胺的濃度線性量測範圍,分別為1 uM 至 5 mM 以及 10 至 80 μM。兩者的 濃度線性量測範圍都小於人體血液中葡萄糖與組織胺正常含量的2 到 10 倍。經 由樣本的稀釋,我們的系統將能夠測量人體血液中的葡萄糖與組織胺的濃度。未 來,我們的目標將特別針對多功能家用醫療診斷儀器進行進一步的研究。ABSTRACT
We developed a biomedical diagnosis system by integrating CMOS photodiode chip and coupled enzyme reactions. Glucose and histamine are the chosen targets because of their importance in the medical diagnosis. The Km value of glucose and
histamine obtained from our assembled system is 4.9 and 125 μM, respectively, which are similar to those obtained from UV/Vis spectrophotometer (7.2 and 160 μM). The detection limits of glucose and histamine concentrations in our system are 1 μM and 10 μM, respectively. The linear ranges are from 1 μM to 5 mM and 10 to 80 μM for glucose and histamine, respectively, which both are 2 to 10 folds lower than those in the human blood. In the future, our research will particularly aim at multi-functional household medical diagnosis instrument.
Acknowledgement
交通大學碩士班的學習在此進入尾聲。回顧兩年多來的歷程,楊教授耐心 引導與觀念溝通讓秉鈞受益良多,感謝楊老師的指導。酵素與蛋白質工程實驗室 的夥伴們都是秉鈞學習生涯中的良師益友,奇翰、政哲、郁吟、程允、淵仁、陸 宜、志衡與漢平,謝謝你們!研究過程中有你們的協同腦力激盪,讓秉鈞學業與 心靈上都獲得成長。因為有你們,秉鈞面對研究困境時能夠保持沉著與樂觀。秉 鈞還要感謝交通大學電子研究所黃遠東教授與合作夥伴博士研究生張育維。跨領 域的研究,需要密切配合與觀念溝通,黃教授與育維對於晶片系統的實驗結果與 現象的嚴謹解析,使得研究的成果更加豐碩。甚而,初步研究成果的發表獲得 IEEE 2007 年 EDSSC 國際研討會獲選會議論文的肯定。楊教授與黃教授兩位老 師的指導,秉鈞與育維十分感恩。台北縣立溪崑國中同事們,佩怡與憲調,兩年 來謝謝你們的協助!秉鈞經常在熬夜實驗後仍要面對整天的數學教學,端賴你們 每天在上課前叫醒因為體力透支而趴在辦公桌上沉睡的我。還有好友建德與美桂 老師,謝謝你們每天的關懷與鼓勵! 好朋友柏如,你的心靈支持與鼓勵,讓我勇往直前面對最後衝刺階段。因為 有你,我的生命更臻完美,謝謝你! 最後,秉鈞要將論文獻給我的父母。謝謝你們陪伴我一路走來,始終支持我 生命中的每個選擇。由於你們堅定的支持,讓秉鈞在面對挑戰時能夠勇敢積極並 堅持到底。二位大菩薩,感恩!
CONTENTS PAGE
Abstract (Chinese) ………i
Abstract (English) ……….ii
Acknowledgement ………iii
Contents ……….iv
Contents of TABLES and FIGURES ………..vi
Abbreviation ……….viii
Chapter 1. Introduction 1.1 Development progress of optical biosensor ………...1
1.2 The design of CMOS photodiode chip ………...3
1.3 Glucose and histamine determination in medical diagnosis ……..4
1.4 Biochemical reactions ………5
Chapter 2. Materials and methods 2.1 Materials ……….8
2.2 Equipments ……….8
2.3 Methods ……….…..9
Chapter 3. Results 3.1 CMOS photodiode chip performance ……….19
3.2 Optimization of enzyme assay ……….20
3.3 The determination of hydrogen dioxide ……….24
3.4 Coupled enzyme assay to determine β-D(+)-glucose and histamine 24 Chapter 4. Discussion ………26
Chapter 5. Conclusion ………...28
Reference ………29
CONTENTS OF TABLES AND FIGURES PAGE
TABLES
TABLE I The growing problems of diabetes ………..33
TABLE II Optimal conditions of enzyme reactions ………34
TABLE III Enzyme kinetic parameters ………...35
TABLE IV The feathers of spectrophotometer and the assembled biosensing
system ………..36
FIGURES
Fig. 1. The flowchart of research ……….37
Fig. 2. The flowchart of CMOS optical biosensing system ………38
Fig. 3. Top view and cross section of P+/N well finger photodiode …...39
Fig. 4. The configuration of subsequent circuits ………...40
Fig. 5(a). The curve of LED (650nm) input voltage versus light intensity 41
Fig. 6. CMOS photodiode light absorptive wavelength scan curve ……43
Fig. 7. The absorption light wavelength scan of ABTS / H2O2
colorimetry reaction ………44
Fig. 8. The absorption light wavelength scan of the coupled
enzyme reactions catalyzing histamine ………..45
Concentration ………..……….46
Fig. 10. The curve of initial rate versus the concentration of ABTS ….47
Fig. 11. The curve of initial rate versus the different GOx concentration 48
Fig. 12 The curve of initial rate versus the different DAO concentration 49
Fig. 13 The pH profile of β-D-(+)-glucose coupled enzyme reactions ..50
Fig. 14 The pH profile of histmaine coupled enzyme reactions ……….51
Fig. 15 The temperature effect of β-D-(+)-glucose coupled enzyme
reactions ………52
Fig. 16 The temperature effect of hitamine coupled enzyme reactions 53
Fig. 17. The CMOS chip output voltage at different hydrogen dioxide
concentrations in the 650 nm and 430 nm system. ………54
Fig. 18. Hydrogen dioxide detection limit in the 650 nm system. ……...55
Fig. 19. Hydrogen dioxide detection limit in the 430 nm system. ………..56
Fig. 20. Hydrogen dioxide linear detection range in the 650 nm system. ..57
Fig. 21. Hydrogen dioxide linear detection range in the 430 nm system. ..58
Fig. 22 (a). Enzyme kinetic analysis of glucose oxidase on our assembled
biosensor system ………59
Fig. 23(a). Enzyme kinetic analysis of diamine oxidase on our assembled
Abbreviation
ABTS 2,2'-azino-bis(3-ethylbenzthiazoline-6-sulphonic acid)
CMOS Complementary Metal Oxide Semiconductor
DAO Diamine oxidase
GOx Glucose Oxidase
GPIB General Purpose Interface Bus
HRP Horseradish Peroxidase
LED Light emitting diode TIA Transimpendence Amplifier
CHAPETR 1. INTRODUCTION
Following the progress of the biochip technology in biochemistry and medical diagnosis, the development of an accurate, cost-effective, portable and easy-to-use biosensor system has become the most important issue in the healthcare industry [1- 3]. The early biochips were developed to be used for the measurement of products in
enzyme catalyzed reactions e.g. the metabolic species glucose or lactate [4-5]. Now the key principle of biochips is the detection and quantification of affinity binding of molecular complexes, where the transducers mainly use the evaluation of colorimetric or fluorescence signals [6] or electrochemical methods [7-12].
1.1 Development progress of optical biosensor
Optical sensors represent a trend recently in biosensor development because of those advantages described above [13]. In early years, optical biosensors are
developed based on optical fiber technology, which is used as a waveguide medium to transmit light signal from the immobilized enzyme to the photomultiplier tube [13-
18]. Owing to an expensive set-up, including a photomultiplier tube and associated equipment, the application of the fiber-optic biosensors was limited. To fabricate a miniature optical biosensor, replacing the photomultiplier tube with a photodiode was reported in 1994 [19]. However, its detecting range of hydrogen peroxide was small
fabricated by the mature procedure of complementary metal oxide semiconductor (CMOS) technology was integrated in optical biosensor system. With the benefit of low cost, many reports have demonstrated that the CMOS photo sensor is a powerful light detecting device [20 - 22]. Although many CMOS photodiodes had demonstrated for detecting weak light such as luminescence or fluorescence, short lifetime and low light density of light sources are the main barriers in the development of household medical diagnosis instrument.
In our study, we took another approach to achieve the optical biosensor system. Instead of the short lifetime and low light density of bioluminescence and fluorescence, we provided stable light resource by light emitting diode (LED). With the slight variation of light transition power density, the CMOS photodiode detected the colorimetric enzyme catalysis. Following this scheme, we demonstrated a prototype of optical biosensor system with light transition method. In the future, we attempt to develop the miniature system for household medical diagnosis.
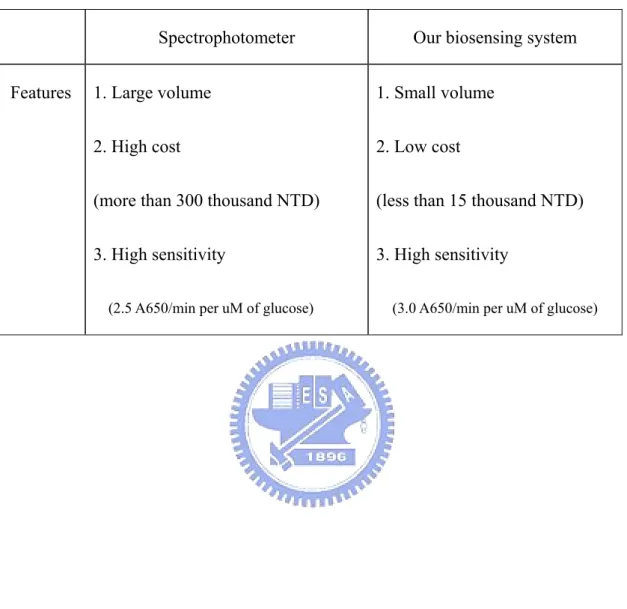
The superiorities of our system compared with the PMT system (UV/Vis spectrophotometer) are showed in TABLE IV. Our system has several advantages such as low cost, small size and the possibility of array-form development.
1.2 The design of CMOS photodiode chip
We applied the optical sensing theorem by light transition. A novel design of photodiode with finger structure (p+-n well) shortens the distance of electron drift, and increases the area of depletion layer closed to the surface. Therefore, the photodiode receipts carriers more efficiently, and then it could produce higher photosensitive current. When the interval of each bar is twice the width of depletion layer, the photodiode has the best sensitivity. The photocurrent is amplified by a current amplifier, and then the current is translated into an output voltage within 0.49~2.02 V by Transimpendence Amplifier (TIA). Three variable resistances are designed for low light intensity (R1/10 MΩ), normal light intensity (R2/1 MΩ), and high light intensity (R3/0.1 MΩ), separately. Photodiode with finger structure (p+-n well), current amplifier, TIA circuit with variable resistance are designed by Yu-Wei Chang who is a Ph.D. student of the department of electronic engineering at NCTU.
Our study
In our study, we set up a CMOS chip prototype biosensor system to quantify the glucose and histamine in the reagent. And we demonstrate that the detection range of the system matched with the amount of glucose and histamine in human body. Integrating with the development of the micro array system and user interface, the
realized in the future.
1.3 Glucose and histamine determination in medical diagnosis
Glucose
It is estimated that there are over 170 million diabetics worldwide (WHO, 2004).
This is projected to increase to 366 million by 2030 (WHO, 2006). It still gets worse that incidence of the disease has risen by an alarming 11% over the last 5 years, and a further doubling of new cases is predicted in the next 25 years. TABLE 1 illustrates the statistics of the growing global diabetes problem.
Despite the many technological advances in research and development of biosensor
and the introduction of many different products, glucose biosensors still account for approximately 85% of the current world market for biosensors, which has recently been estimated to be around $5 billion [23]. The greatest reason why the glucose
biosensor market is growing in developed nations is the prevalence of diabetes [24]. Therefore, investigating the amount of histamine in human blood is a trend issue in the medical diagnosis.
histamine
as arousal and the circadian rhythm of food intake and hormone release [25]. A role for the neuronal histamine system as a danger response system is proposed. Considerable evidence suggests that histamine is involved in the response to dangerous situations [26]. On the other hand, histamine is an important chemical
involved in many allergic reactions. And it causes several allergic symptoms: (1) inflammatory responses (2) constriction of smooth muscle (asthma). Therefore, investigating the amount of histamine in human blood or foods would be a trend issue in the medical diagnosis and biomedical research.
1.4 Biochemical reactions
In our study, we choose the ELISA method, ABTS/H2O2 colorimetric system [33- 34] as platform to couple with glucose oxidase and diamine oxidase to determine the amount of free β- D(+)-glucose and histamine. Below are the couple enzyme reactions:
Glucose determination reactions
β-D(+)-glucose+O2+2H2O gluconic acid+2H2O2 GOD
HRP
H2O2+2ABTS (reduced) 2ABTS
.
+(oxidized) + 2OH-
Histamine determination reactions
histamine+O2+2H2O Imidazole acetic acid+NHDAO 3+H2O2
H2O2+2ABTS (reduced) 2ABTS
.
+(oxidized) + 2OH-
,
HRP
where ABTS represents 2,2’-azino-bis[3-ethylbenzthiazoline-6-sulphonic acid], and HRP stands for horseradish peroxidase. Since the ABTS solution is visually light green and the ABTS+ solution is dark blue, this chemical reaction can be easily observed for qualitative analysis. Comparatively, detecting the optical absorbance of the biochemical material is more accurate for quantitative analysis. The absorbance (A) of the materials is described by the Beer-Lambert law as
material,
ε
λ is the wavelength-dependent molar absorptivity in units of l·mol-1·cm-1, l is the path length in units of cm, and c is the concentration of analyte in units of mol·l-1 [32]. With a monochromatic light source, the absorbance is proportional to the concentration. Thereby detecting the optical signals modulated by the biochemical reactions is an efficient way to quantities the amount of H2O2.The ELISA method, the system based on ABTS/H2O2 colorimetric analysis, could be coupled with various enzymes to assay various kinds of substrates. Before analyzing the kinetics of glucose oxidase and diamine oxidase, condition-optimized studies were performed for each of the components of glucose and histamine assay on UV/Vis spectrophotometer (UV-3310, Hitachi). Comparing the kinetics of glucose oxidase and diamine oxidase obtained from UV-3310 and our CMOS device, we could confirm the usability of our assembled biomedical sensor system.
CHAPTER 2. MATERIALS AND METHODS
2.1 Materials
β-D(+)-glucose, horseradish peroxidase (HRP), histamine, diamine oxidase (from porcine kidney)(DAO), 2,2'-azino-bis(3-ethylbenzthiazoline-6-sulphonic acid) (ABTS), and H2O2 (30%, W/W) are purchased from Sigma. Glucose oxidase (from Aspergillus niger) (GOx) is purchased from Fluka. Sodium phosphate powders (monobasic and dibasic) are obtained from J.T.Baker.
2.2 Equipments
Photodiode with finger structure (p+-n well), current amplifier, TIA circuit with variable resistance are designed by Yu-Wei Chang who is a Ph.D. student of the department of electronic engineering at NCTU. And the device was manufactured by CMOS fabrication in TSMC co. Breadboard of red and violet light emitting diodes (LED) are needed to assemble biomedical sensing system which is also composed of quartz cuvette and band-pass color filters. Band-pass color filters have two forms which are 650 nm and 430 nm.
E3646A power supply (Agilent), 4401A multi-meter (Agilent), General Purpose Interface Bus (GPIB) card, and a analysis computer software (Labview 6.0) are used to collect the data output from photodiode chip. UV/vis spectrophotometer (UV-3310,
Hitachi) is used to confirm the validity of the data of our assembled biomedical sensing system.
2.3 Methods
Research scheme
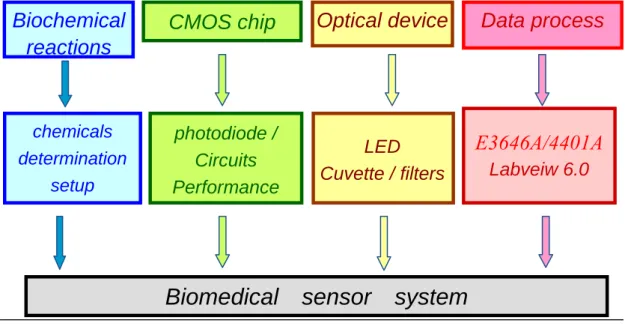
In order to build up a biomedical sensor system, we assembled four main components: optimal conditions of bio-reactions, CMOS chip consist of photodiode and circuit, optical devices, and data process software, is considered reasonably as usual. Fig. 1is the flowchart of our research.
Reagents preparation
Sodium phosphate buffer (0.1 M stock)
0.1 M dibasic phosphate solution was prepared by add ddH2O to 7.1 g Na2HPO4 until final volume 500 ml was obtained. 0.1 M monobasic phosphate solution was prepared by add ddH2O to 6.9g NaH2PO4‧H2O until final volume 500 ml was obtained. Then added NaH2PO4 solution to Na2HPO4 solution until the desired pH 7.0 was obtained. Phosphate buffer was stored at room temperature.
ABTS (2,2'-azino-bis(3-ethylbenzthiazoline-6-sulphonic acid) / 36 mM stock)
mg/tab) until final volume 4.556 ml was obtained. And then add NaOH to ABTS solution until the desired pH 7.0 was obtained. ABTS solution had to be prepared fresh and keep it from light lest it would go off.
H2O2 (1M stock)
Added ddH2O to 1ml H2O2 (30%, W/W) until final volume 9 ml was obtained. And then, we diluted this stock with ddH2O to obtained 0.1M and 0.01 M solution.
Glucose solution (1 M stock)
Glucose solution was prepared by adding ddH2O to dissolve 9 mg glucose powder until final volume 50ml was obtained. And then, we diluted this stock with ddH2O to obtained 0.1 M and 0.01 M solution.
Histamine solution (0.2 M stock)
Histamine solution was prepared by adding phosphate buffer t o dissolve 222 mg histamine powder until final volume 10ml was obtained. And then, we diluted this stock with dd H2O to obtained 20mM and 2mM solution.
Enzyme preparation
Horseradish peroxidase (HRP, EC 1.11.1.7)
The powder of HRP (4mg or 1000 units) was dissolved in 10ml sodium phosphate buffer (0.1 M at pH 7.0), and the stock (100 unit/ml) was stored at -80 . ℃ One unit of HRP will form 1.0 mg of purpurogallin from pyrogallol in 20 seconds at pH 6.0 at 20℃. This purpurogallin (20 seconds) unit is equivalent to approximately 18 μM units per minute at 25℃.
Glucose oxidase (GOx, EC 1.1.3.4)
The powder of GOx (6mg or 1200 units) was dissolved in 10ml sodium phosphate buffer (0.1 M at pH7.0), and the stock (120 unit/ml) was stored at -80 . One unit ℃ corresponds to the amount of enzyme which oxidizes 1 μmol glucose per minute at pH 7.0 and 25 °C.
Diamine oxidase (DAO, EC 1.4.3.6)
The powder of DAO (200mg or 10 units) was dissolved in 1ml sodium phosphate buffer (0.1 M at pH7.0), and the stock (10 unit/ml) was stored at -80 . One unit will ℃ oxidize 1.0 μmole of putrescine per hour at pH 7.2 and 37 °C.
Optimal condition for enzyme assay
Absorption wavelength of product
The “wavelength scan” function of UV-3310 was used to measure the range of absorption wavelength of reaction product. The scan parameters of UV-3310 are as follows: start wavelength is 700 nm, end wavelength is 300 nm, delay time is 120 sec, scan speed is 300 nm/min and silt is 2 nm. Reaction condition is: 25 , pH 7.0, 100 ℃ mM phosphate buffer, 30 mM ABTS, 0.2 mM H2O2 and 0.2 unit/ml HRP.
Optimal concentration of reagents
Optimization of substrate amount (H2O2, glucose, and histamine) played an important role in enzyme assay before the determination in the solution. The “time scan” function of UV-3310 was used to find out the optimal concentration of reagents. The scan parameters of UV-3310 were: wavelength is 430nm (H2O2
/
histamine) and 650nm (H2O2/
glucose), sampling interval is 1 sec; total times are 60 sec for H2O2, 120sec for glucose, and 1200sec for histamine, and delay time is zero. Several reaction conditions were kept under 25℃(H2O2 and glucose) and 37℃(histamine), pH 7.0, 100 mM phosphate buffer.The optimization studies began with ABTS/H2O2 colorimetric system to find out the linear range of HRP, and then appropriate amount of HRP, excess ABTS, were
added to Fig. out the optimal concentration of reagents. After finding out the suiTABLE amount of other reagents, we coupled ABTS/H2O2 colorimetric system with glucose oxidation reaction to find out the linear range of glucose oxidase (650 nm). Repeating previous process, we also found out the linear range of diamine oxidase (430 nm).
Optimal pH value of buffer
The “time scan” function of UV-3310 was used to find out the optimal pH value of phosphate buffer. In the experiment of glucose, value of pH ranged from 3.0 to 9.0 with an internal of 1.0 and three kinds of buffer system, citrate buffer (pH 3.0~5.0), phosphate buffer (pH 5.0~6.0), Tris buffer (pH 7.0~9.0) were used. The scan parameters of UV-3310 are: wavelength is 650 nm, sampling interval is 1 sec, total time is 120 sec, and delay time is zero. Constant reaction conditions were: 25 , 30 ℃ mM ABTS, 20 mM glucose, 0.48unit/ml GOD and 0.2 unit/ml HRP. For determine histamine, value of pH range is from 6.5 to 7.5 with an internal of 0.5 and phosphate buffer (pH 6.5~7.5), was used. The scan parameters of UV-3310 are: wavelength is 430 nm, sampling interval is 1 sec, total time is 1200 sec, and delay time is zero. Constant reaction condition is: 37 , 30 mM ABTS, 2 mM histamine, 0.8 unit/ml ℃ DAO and 0.2 unit/ml HRP.
Optimal temperature
The “time scan” function of UV-3310 was used to find out the optimal temperature for the coupled enzyme assay. Temperature ranges from 20 to 40 . All reagents ℃ ℃ except enzymes were mixed, and then enzymes were added into mixed reagents immediately before we began to measure the process of time scan. The scan parameters of UV-3310 were: wavelength is 650 nm (glucose), 430 nm (histamine), sampling interval is 1 sec, total times are 120 sec (glucose), 1200 sec (histamine) and delay time is zero. Constant reaction condition is: pH 7.0, 30 mM ABTS, 20 mM Glucose/ 2 mM Histamine, 0.48 unit/ml GOD / 0.8 unit/ml DAO, and 0.2 unit/ml HRP.
Coupled enzyme assay to determine concentration of substrate
Glucose determination
ABTS/H2O2 colorimetric system coupled to GOD catalyzed reaction could determine the concentration of glucose. The reaction conditions for this coupled enzymes system contained 0.48 unit/ml GOD, 0.2 unit/ml HRP, 30 mM ABTS and phosphate buffer (100 mM, pH 7.0) in a final volume of 1 ml at 25 .℃
Histamine determination
ABTS/H2O2 colorimetric system coupled to DAO catalyzed reaction can determine the concentration of histamine. The reaction conditions for this coupled enzymes system contained 0.8 unit/ml DAO, 0.2 unit/ml HRP, 30Mm ABTS and phosphate buffer (100 mM, pH 7.0) in a final volume of 1 ml at 37 .℃
Mixing procedure
Aliquot amount of enzyme is added into the cuvette following by the injection of all
other necessary reagents and sample. These processes are to make sure that the whole compounds are well mixed in cuvette without extra shaking and the data can be collected in a short period of time [20].
Data processing
Each data point was calculated from the mean value of triplicate assay. The curve and Km value were obtained with Michaelis-Menten equation in enzyme kinetics
analysis of Sigma Plot 2001.
CMOS chip design and biomedical sensor system setup
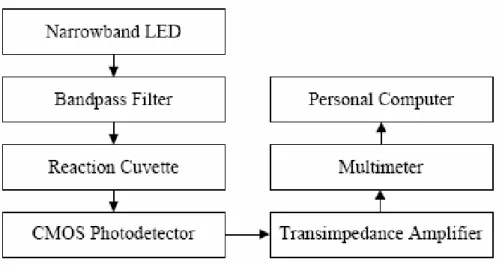
2. A narrowband LED was used as the light source, and a bandpass filter allowed the light of a specific wavelength to travel through the cuvette, in which the light was modulated by the biochemical materials. The light, after passing through the cuvette, was detected by the CMOS biochip. The CMOS photo detector converted the modulated optical signals into current signals, and then the transimpedance amplifier (TIA) converted them into voltage signals. Finally, the signals were recorded by a multimeter and processed by personal computer.
CMOS photodiode
We applied the optical sensing theorem of light transition. And a novel design of photodiode with finger structure (p
-
n well) shortened the distance of electron drift, and increased the area of depletion layer closed to the surface. Therefore, the photodiode receipted carriers more efficiently, and then it could produce higher photosensitive current. When the interval of each bar is the twice width of depletion layer, the photodiode has the best sensitivity.+
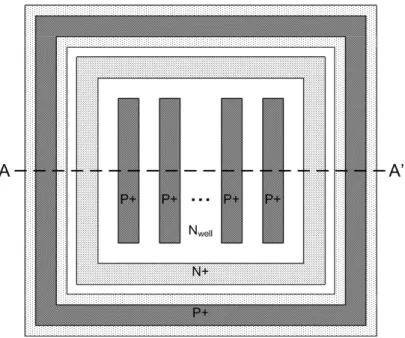
The CMOS biochip is mainly composed of a photo detector and a TIA. Fig. 3 illustrates the top view and cross section of the proposed P+/Nwell finger photodiode. The quantum efficiency of the photodiode is enhanced by adopting interdigitated shallow P+/Nwell junctions to extend the depletion regions
[27]. Each P+ stripe is 1μm wide with 4 μm spacing, and the total area of this finger photodiode is 100 μm ×100 μm. The photodiode is surrounded by double guard rings to keep the substrate noise off; the P+ guard ring is connected to ground, and the N+ guard ring is connected to a high potential [28]. Photodiode with finger structure (p+-n well), current amplifier, TIA circuit with variable resistance are designed by Yu-Wei Chang who is a Ph.D. student of the department of electronic engineering at NCTU.
Circuit design
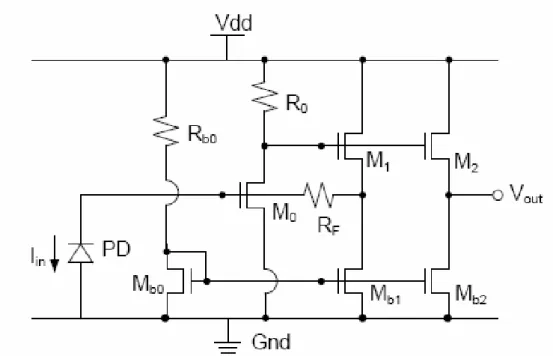
As shown in Fig. 4, the subsequent circuits include a current source, current mirrors, a TIA, and output buffers. The TIA consists of a common-source stage (M0), two source followers (M1 and M2), and an external feedback resistance (RF). M1 serves in the feedback loop to isolate R0 from the loading effect, and M2 drives the load capacitance to alleviate the stability issue [29].
Light source module
We choose two high lightness red LED and a color filter with 650nm to form a light source module, and select R2/1 MΩ (normal light intensity) on TIA. With preceding setup, we determinated glucose amount in the reagent. On the other hand,
we choose three high lightness violet LED and a color filter with 430 nm to form a light source module, and select R1/10 MΩ (low light intensity) on TIA.
Data analysis
Data analysis consists of hardware and software; therefore, we have to connect them with our biomedical sensor system. E3646A power supply provides CMOS chip 3.0 V bias voltage, and 4401A multimeter collects the output voltage data and transfers it to a personal computer (PC) through GPIB connection. And we use Labview 6.0 to record the output voltage data transferred to PC.
CHAPETR 3. RESULTS
3.1 CMOS photodiode chip performance
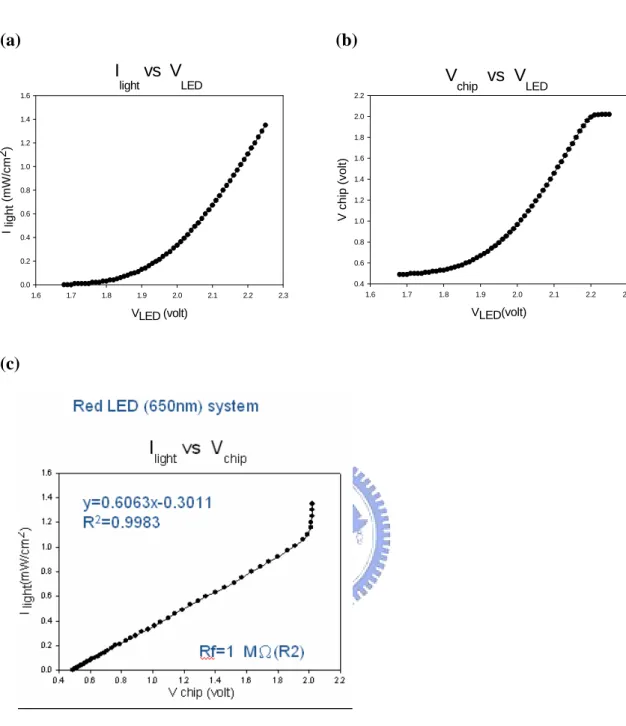
The biochip is implemented in a standard 0.35-μm CMOS technology. The finger photodiode is reverse-biased moderately to ensure that the photocurrent is proportional to the absorbed photons. The photocurrent is then converted into voltage signals by the subsequent TIA. With a 3.0 V power supply, the lower bound and upper bound of the output voltage are 0.49 V and 2.02 V, respectively. (See Fig. 5 (a) -(c)) Therefore, we obtained a linear range of output voltage to compare with the input light intensity which was proportioned to the concentration of -D(+)-glucose
or histamine.
Circuit design
When photodiode absorbs photons, it will generate a flow of current in an external circuit, proportional to the incident light. The photocurrent was amplified by current amplifier, and then the current was translated into voltage output within 0.49~2.02 V by Transimpendence Amplifier (TIA). The circuit design is showed in Fig. 4. Three variable resistances were designed for low light intensity (R1/10 MΩ), normal light intensity (R2/1 MΩ), and high light intensity (R3/0.1 MΩ).
voltage value, the liner relation between light intensity and output voltage of CMOS chip must be confirmed. To affirm this, the first step, the module of LED was gave various input voltages, and a color filter was used to sift the specific-wavelength light out. In the meanwhile, the corresponding values of light intensity were measured by power meter. Then we could build up a curve of LED input voltage versus light intensity such as Fig. 5(a). The second step, we gave various LED input voltages as serious light intensity, and measure the corresponding output voltages of CMOS chip. Then we could also build up another curve of LED input voltages versus CMOS chip output voltage such as Fig. 5(b). The third step, with merging two curves previously, we get a new curve of light intensity versus CMOS chip output voltage. It is showed as Fig. 5(c). According to the linear relation showed as Fig. 5(c), we can translate the CMOS chip output voltage collected by 4401A multimeter into transiting light intensity.
3.2 Optimization of enzyme assay
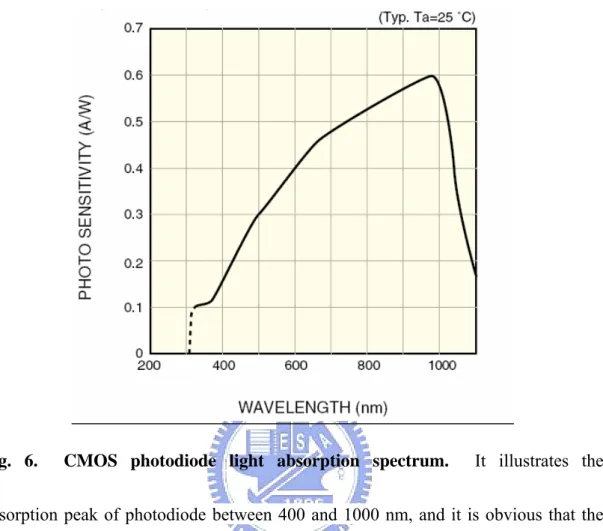
Absorption wavelength of product in glucose and histamine oxidation reaction It illustrates the absorption peak of photodiode between 400 and 1000 nm, and it is obvious that the maximum absorption peak of photodiode within the visible light ranges between 600 and 700nm. Furthermore, it shows that the absorption sepctrum
of the product of reaction, ABTS
.
+, and it has three absorption peaks at 415 nm, 640 nm and 720 nm, separately (Fig. 7). Light 1 in Fig. 6 reveals the weaker absorption peak of photodiode and Light 2 shows the stronger one. After all we will confirm that our photodiode could have the corresponding performance and it could also determine the glucose amount in the reagent. Therefore, we choose 650 nm as the optimal absorptive wavelength in the glucose oxidation reaction.On the other hand, we want to confirm that the performance of our photodiode could fit the optimal light absorbance peak of ABTS/H2O2 colorimetry system with the range from 390 nm to 440 nm. As a matter of fact, the product of coupled enzyme reactions catalyzing histamine had only one light absorbance peak at 430 nm (Fig. 8). Therefore, we choose 430 nm as the optimal absorption wavelength of histamine oxidation reaction.
Optimal concentration of reagents
ABTS/H2O2 colorimetry system
There is a linear range of HRP between 0.05 to 0.2 U/ml (Fig. 9); therefore, we choose 0.2 U/ml of HRP to catalyze in the ABTS/H2O2 colorimetry system. We added excess H2O2 in ABTS/H2O2 colorimetry system with various concentrations of ABTS to investigate the optimal concentration of ABTS. In the consideration of the
solubility of ABTS and the catalytic rate in Fig. 10, we choose 30 mM to be the optimal concentration of ABTS to make sure of its continuous working.
Determination of optimal amount of glucose oxidase and diamine oxidase After we found out the optimal concentration of other reagents, we coupled ABTS/H2O2 colorimetry system with glucose oxidation reaction to find out the linear range of glucose oxidase ranged from 0.01 to 0.8 U/ml as shown in Fig. 11. Therefore, we choose appropriate amount, 0.48 U/ml, of glucose oxidase to catalyze glucose oxidation reaction. Additionally, we coupled ABTS/H2O2 colorimetry system with histamine oxidation reaction to find out the linear range of diamine oxidase ranged from 0.4 to 2 U/ml as shown in Fig. 12. Therefore, we choose appropriate amount, 0.8 U/ml, of diamine oxidase to catalyze histamine oxidation reaction.
Optimal pH value of phosphate buffer
Fig. 13 demonstrates that the effect of pH value (3.0, 4.0, 5.0, 6.0, 7.0, 8.0, and 9.0) on the assay. In order to fit the application in biomedical diagnosis, we choose appropriate pH 7.0 to be the optimal pH condition in glucose oxidation reaction. In the side of histamine oxidation reaction, owing to the enzyme activity limitation, we choose the range between 6.5~7.5 to find out optimal pH value according to the
suggestion of sigma enzyme product data sheet. Fig. 14 tells us that the effect of pH value (6.6, 6.8, 7.0, 7.2, and 7.4) on assay. Base on the result of this experiment, the initial rate in pH value of 7.4 is optimal. Considering these two optimal pH value as described above, we choose a pH 7.0 phosphate buffer for coupled enzyme assay.
Optimal temperature
The relationship between different temperatures (20 ~40 ) and initial rates of ℃ ℃ glucose assay shows as Fig.15, it tells us the variation of temperature affect unobviously the catalysis rate of glucose oxidase. On the other hand, there is no temperature controlled setup on our assembled biosensor system. While proceeding any experiment on UV/Vis spectrometer U-3310, 25 is choose to be the optimal ℃ temperature.
Different from glucose oxidation reaction, the variation of temperature does affect the catalysis rate of diamine oxidase obviously. The relationship between different temperatures (20 ~40 ) and initial rates of diamine oxidase assay shows as ℃ ℃ Fig. 16, and it tells us initial rates of diamine oxidase has higher value between 36 and 40 ℃ ℃ than on room temperature. Considering the temperature of human body, we choose 37℃ as the optimal temperature of histamine oxidation reaction.
3.3 The determination of hydrogen dioxide
The CMOS chip output voltage at different hydrogen dioxide concentrations in the 650 nm and 430 nm systems were showed in Fig. 17(a) and Fig. 17(b). The hydrogen dioxide detection limit of assembled system in the 650 nm and 430 nm were 1 μM and almost were the same as that from UV/Vis spectrophotometer (shown in Fig. 18(a)-(b) and Fig. 19(a)-(b)). The liner detection ranges of our assembled biosensing system and UV/Vis spectrophotometer ranges from 1 ~ 20 μM and 10 ~ 80 μM, respectively(shown in Fig. 20 (a)-(b) and Fig. 21 (a)-(b) ).
3.4 Coupled enzyme assay to determine β-D(+)-glucose and histamine
Coupling glucose oxidase and diamine oxiadse catalyzed reaction with ABTS/H2O2 colorimetry system, we get the enzyme kinetic analysis of
β-D(+)-glucose and histamine standard curves. All the curve and Km value are
obtained with Michaelis-Menten equation in enzyme kinetics analysis of Sigma Plot 2001.
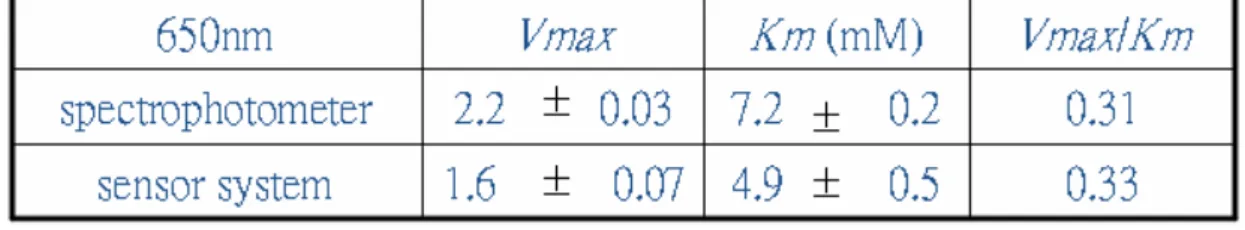
Enzyme kinetic analysis of glucose oxidase and diamine oxidase observed in our assembled biosensor system is shown in Fig. 22(a) and Fig. 23(a). By this process the Km value of β-D(+)-glucose and histamine were 4.9 ± 0.5 μM and 125 ± 3.21 μM,
(7.2 ± 0.2 μM and 160 ± 19.7 μM ). (See TABLE 3(a), TABLE3(b), Fig. 22(b) and 23(b)) The optimal reaction conditions of these two enzyme was showed in TABLE 2, and the CMOS chip output voltage at different glucose and histamine concentrations were showed in Fig. 22(c) and Fig. 23(c). β-D(+)-glucose detection limit of assembled system is 1 μM and almost the same as that from UV/Vis spectrophotometer. On the other hand, the histamine detection limit of assembled system is 10 μM while the hitamine detection limit of UV-vis spectrophotometer is 20 μM. The liner detection ranges of our assembled biosensing system ranges from 1 μM to 5 mM and 10 ~ 80 μM, respectively.
CHAPTER 4. DISCUSSION
Optimal absorptive wavelength
There are two factors to determine the optimal absorptive wavelength
β-D(+)-glucose and histamine oxidation reactions: The absorption wavelength of the
products of β-D(+)-glucose and histamine oxidation reactions; and the absorption peak of CMOS photodiode chip. Owing to the maximum absorption peak of CMOS photodiode chip located between 600 and 700 nm and the absorption peaks of
β-D(+)-glucose oxidation reaction were at 415 nm, 650 nm and 720 nm, the 650 nm
was chosen to be the optimal wavelength to prove the feasibility of our CMOS photodiode chip. On the other hand, the absorption peak of histamine oxidation reaction was only at 430 nm. Therefore, we follow the normal biochemical rule: Chose the maximum absorption peak of reaction. As matter of fact, the only absorption peak of histamine oxidation reaction was at 430 nm based on the results of our experiment. Although 430nm might not the suitable range of the absorption peak of CMOS photodiode chip, we still wondered whether our CMOS photodiode chip could determinate histamine at 430 nm. Finally, we choose 650 nm and 430 nm to be the optimal absorptive wavelength of glucose and histamine oxidation reactions, respectively.
The performance of assembled biomedical system
Enzyme kinetic analysis results of glucose oxidase and diamine oxidase observed in our assembled biosensor system approached to that obtained from UV/Vis spectrophotometer. Our system was more superior than the traditional optical spectrophotometer whether volume or cost. In the meanwhile, the detection linear ranges of β-D(+)-glucose and histamine obtained from our assembled system approached to the amount in human bady. When we determine the β-D(+)-glucose and histamine. The liner detection ranges of our assembled biosensing system ranged from 1 μM to 5 mM and 10 ~ 80 μM, respectively, while the glucose concentration of human blood is 4 ~ 8 mM [30] and 1~8 mg/dl (90~720 μM) [31]. By the 2 to 10 folds sample dilution at most, the detection linear range of our assembled system can determine β-D(+)-glucose and histamine concentration in the human blood.
CHAPETR 5. CONCLUSION
We have set up an optical bio-sensing system for determination of glucose and histamine. A photodiode chip based on CMOS manufacture procedure was developed with the P+/Nwell finger structure and the subsequent current amplifier circuits, especially, include current mirrors and TIA. The photodiode with the P+/Nwell finger structure is surrounded by double guard rings to keep the substrate noise off. The optical transition theorem is used to be the detection method in our system. We designed colorimetrical reactions to be a biochemistry detection platform. Using the platform technology, we can determinate β-D(+)-glucose and histamine in the reagents. The performance of our system can compare with traditional large-size optical instrument, spectrophotometer. And our system has several advantages such as low cost, small size and the possibility of array-form development. In the future, we will aim to developing a new generation system based on this prototype system. Minimization, array, user interface and micro-fluid channel would be integrated with the technology of the prototype system. Our hope is to set up a multi-functional household medical diagnosis instrument. And then, the research integrated with biochemistry and electronic engineering could benefit more people who need house medical care.
REFERENCES
1. Baeumner, A. J., Cohen, R. N., Miksic V., Min, J., 2003. Biosens. Bioelectron. 18: 405–413
2. Choi, S. H., Gu, M. B., 2002. Biosens. Bioelectron.17: 433–440
3. DeBusschere, B. D., Kovacs, G. T., 2001. Biosens. Bioelectron.16: 543–556 4. Wollenberger U., Hintsche, Scheller R. F.., 1995. Biosensors for analytical
microsystems. In: (ed. Reichl H) Microsystem technologies: 687–693
5. Hintsche R., Dransfeld I., Scheller F., Pham M. T., Hoffmann W., Huller J., Moritz W.,1990. Biosens. Bioelectron. 5: 327–334
6. Vo-Dinh T., Cullum B., 2000. Fresenius’ J. Anal. Chem. 366: 540–551 7. Palecek E., Fojta M., Jelen F., 2002. Bioelectrochemistry 56: 85–90 8. Wang J., 1999. Anal. Chem. 71: 328–332
9. Kelley S. O., Boon E. M., Barton J. K., Jackson N. M., Hill M. G., 1999. Nucleic
Acids Res. 27: 4830–4837
10. Berggren C, Stalhandske P, Brundell J, Johansson G, 1999. Electroanalysis 11: 156–160
11. Alfonta L, Singh A. K. , Willner I. , 2001. Anal. Chem. 73: 91–102 12. Willner I, Willner B, Katz E, 2002. Rev. Mol. Biotechnol. 82: 301–463
Yuan C. J.,2007. Biosens. and Bioelectron. 22: 3008–3013.
14. Blum L. J., Gautier S. M., 1991. (eds. Blum L. J., Coulet P. R., Marcel Dekker),New York: 213–247
15. Golden J. P., Anderson G. P., Rabbany S.Y., Ligler F. S., 1994. IEEE Trans.
Biomed. Eng. 41: 585–591
16. Chen Z., Kaplan D. L., Gao H., Kumar, J., Marx K. A., Tripathy S.K., 1996. Mater. Sci. Eng. C 4: 155–159
17. Marquette C.A., Blum L.J., 1999. Anal. Chim. Acta. 381: 1–6
18. Tsafack V.C., Marquette C.A., Pizzolato F., Blum L., 2000. Biosens.Bioelectron. 15: 125–133
19. Preuschoff F., Spohn U., Janasek D., Weber E., 1994. Biosens. Bioelectron. 9: 281–295
20. Lu U., Hu B. C., Shih Y. C.,Wu C. Y., Yang Y. S., 2004. Biosens.
Bioelectron.19: 1185–1191
21. Lu U., Hu B. C.P., Shih Y. C., Yang Y.S.,Wu C. Y., Yuan C. J., Ker M. D.,Wu T. K., Li Y. K., Hsieh Y. Z., Hsu W., Lin C. T., 2003. IEEE Sens. J. 3: 310–316 22. Huang S. H., Shih Y. C., Wu C. Y., Yuan C. J., Yang Y. S., Li Y. K., Wu T.
K.,2004. Biosens. Bioelectron. 19: 1627–1633
Clearer View. Cranfield University, UK: 216
24. Newman J. D., Anthony P.,Turner F., 2005. Biosen. Bioelectro. 20: 2435–2453
25. Wada H., Inagaki N., Yamatodani A., Watanabe T., 1991. Trends Neurosci. 14: 415–418
26. Ritchie E. Brown, David R. Stevens, Helmut L. Haas, 2001. Progress in
Neurobiology 63: 637–672
27. Ghazi A., Zimmermann H., Seegebrecht P., 2002. IEEE Trans. Electron Devices 49: 1124-1128
28. Ker M. D., Lo W. Y., 2003. IEEE Trans. Semicond. Manuf. 16:. 319.334 29. Razavi B., Design of Integrated Circuits for Optical Communications,
McGrw-Hill, 2003.
30. Mackay E. M., J. Biol. Chem., May 27, 1932: 685-689 31. Lubschez R., J. Biol. Chem., September 24, 1949: 731-738
32. Eisenthal R. and Danson M. J., 2002, Enzyme Assays, 2nd Ed., Oxford University Press.
33. Kunst A., Draeger B., Ziegenhorn J..,1984, Methods of Enzymatic Analysis (ed. HU Bergmeyer, Verlag chemie, Weihenheim): 163-172
TABLES AND FIGURES
TABLEI The growing global problem of diabetes
Stati 19 20 (e 202 (est stics 95 00 stimate) 5 imate) People with diabetes (million) 135 154 300 % in developed countries 25.2 23.8 17.1
Female/male ratio 1.18 1.16 1.12
Soure: World Health Organisation.
It still gets worse that incidence of the disease has risen by an alarming 11% over the recent years, and a further doubling of new cases is predicted in the next 25 years.
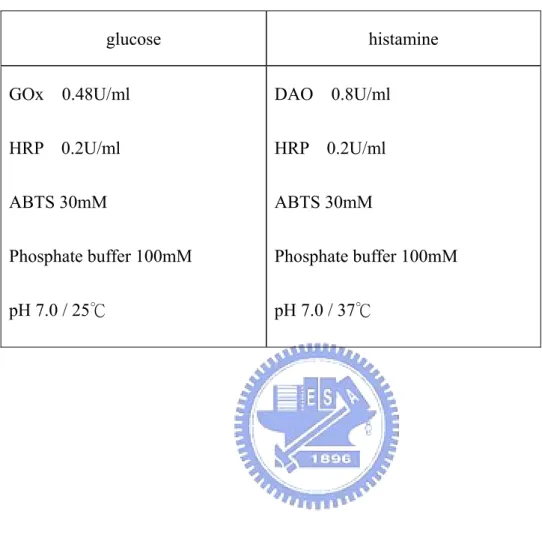
TABLE II Optimal conditions of enzyme reactions
glucose stamine hi GOx HRP ABT Phos pH 7 DAO HRP ABT Phos pH 7 0.48U/ml 0.2U/ml S 30mM phate buffer 100mM .0 / 25℃ 0.8U/ml 0.2U/ml S 30mM phate buffer 100mM .0 / 37℃
TABLE III
Enzyme kinetic parameters
(a) glucose oxidase (GOx) catalysis reaction
(b) diamine oxidase (DAO) catalysis reaction
Enzyme kinetic analysis results of glucose oxidase and diamine oxidase observed in our assembled biosensor system approached to that obtained from UV/Vis
TABLE IV
The feathers of spectrophotometer and the assembled biosensing system
Spectrophotometer Our biosensing system Feat 1. La 2. H (mor 3. H (2. 1. Sm 2. Lo
(less than 15 thousand NTD) 3. High sensitivity
(3. ucose)
ures rge volume all volume
igh cost w cost
e than 300 thousand NTD) igh sensitivity
Figures
Biochemical
reactions
Optical device
Data process
CMOS chip
Fig. 1. The flowchart of research. A biomedical sensor system assembled four main components: optimal conditions of bio-reactions, CMOS chip consist of photodiode and circuit, optical devices, and data process software.
photodiode / Circuits Performance chemicals determination setup
E
Labveiw 6.03646A/4401A
LED Cuvette / filtersFig. 2. The flowchart of CMOS optical biosensing system. A narrowband LED
430 nm system
was used as the light source, and a bandpass filter allowed the light of a specific wavelength to travel through the cuvette, in which the light was modulated by the biochemical materials. The light, after passing through the cuvette, was detected by the CMOS biochip. The CMOS photo detector converted the modulated optical signals into current signals, and then the transimpedance amplifier (TIA) converted them into voltage signals. Finally, the signals were recorded by a multimeter and processed by personal computer.
Fig. 3. Top view and cross section of P+/N well finger photodiode. Each P+ stripe is 1μm wide with 4 μm spacing, and the total area of this finger photodiode is 100 μm ×100 μm. The photodiode is surrounded by double guard rings to keep the substrate noise off; the P+ guard ring is connected to ground, and the N+ guard ring is connected to a high potential. Photodiode with finger structure (p+-n well) is designed by Yu-Wei Chang who is a Ph.D. student of the department of electronic engineering at NCTU.
Fig. 4. The configuration of subsequent circuits. The subsequent circuits include a current source, current mirrors, a TIA, and output buffers. The TIA consists of a common-source stage (M0), two source followers (M1 and M2), and an external feedback resistance (RF). M1 serves in the feedback loop to isolate R0 from the loading effect, and M2 drives the load capacitance to alleviate the stability issue. Current amplifier, TIA circuit with variable resistance are designed by Yu-Wei Chang who is a Ph.D. student of the department of electronic engineering at NCTU.
(a) (b) I vs V VLED (volt) V chip vs VLED VLED(volt) 1.6 1.7 1.8 1.9 2.0 2.1 2.2 2.3 light LED (c)
Fig. 5. (a)The curve of LED (650nm) input voltage versus light intensity (b)The curve of LED (650nm) input voltages versus CMOS chip output voltage (c). The curve of light intensity versus CMOS chip output voltage. With a 3.0 V power supply, the lower bound and upper bound of the output voltage are 0.49 V and 2.02 V, respectively. 1.6 1.7 1.8 1.9 2.0 2.1 2.2 2.3 I light (mW /cm 2) 0.0 0.2 0.4 0.6 0.8 1.0 1.2 1.4 1.6 V c h ip (vo lt ) 0.4 0.6 0.8 1.0 1.2 1.4 1.6 1.8 2.0 2.2
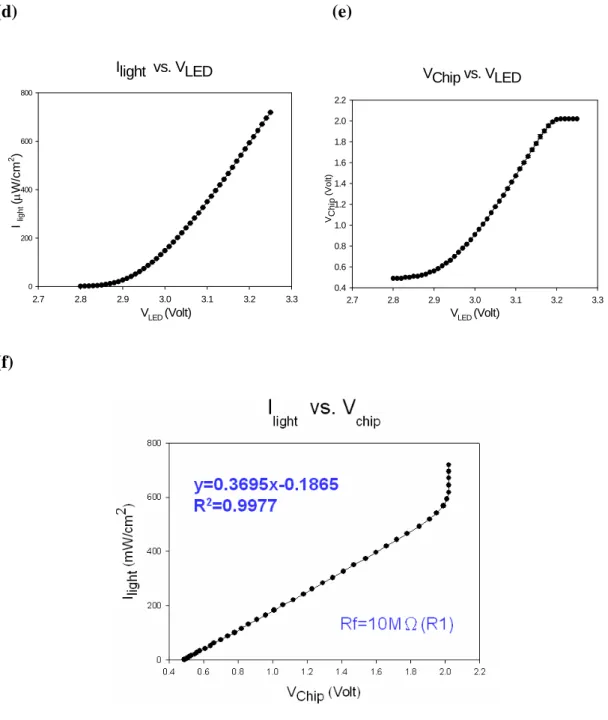
(d) (e) Ilight vs. VLED VLED (Volt) 2.7 2.8 2.9 3.0 3.1 3.2 3.3 VChip vs. VLED VLED (Volt) 2.7 2.8 2.9 3.0 3.1 3.2 3.3 VCh ip (Vo lt) 0.4 0.6 0.8 1.0 1.2 1.4 1.6 1.8 2.0 2.2 I light (μ W/cm 2 ) 0 200 400 600 800 (f)
Fig. 5. (d)The curve of LED (430nm) input voltage versus light intensity. (e)The curve of LED (430nm) input voltages versus CMOS chip output voltage (f). The curve of light intensity versus CMOS chip output voltage at 430nm.With a 3.0 V power supply, the lower bound and upper bound of the output voltage are 0.49 V and 2.02 V, separately.
Fig. 6. CMOS photodiode light absorption spectrum. It illustrates the absorption peak of photodiode between 400 and 1000 nm, and it is obvious that the maximum absorption peak of photodiode within the visible light ranges between 600 and 700nm.
ABTS (36mM)
H2O2/ABTS/HRP→ABTS+
730 640
415
Fig. 7. The absorption spectrum (300~1000nm) of ABTS / H2O2 colorimetry reaction. The scan parameters of UV-3310 are as follows: start wavelength is 1000 nm, end wavelength is 300 nm, delay time is 120 sec, scan speed is 300 nm/min and silt is 2 nm. Reaction condition is: 25 , pH 7.0, 100 mM ℃ Phosphate buffer, 30 mM ABTS, 0.2 mM H O2 2 and 0.2 unit/ml HRP. The absorption wavelength of the product of reaction, ABTS
.
+ has three absorption peaks at 415 nm, 640 nm and 730 nm, separately.ABTS (36mM)
histamine/ DAO/ABTS/HRP→ ABTS
.+pH7.0 37℃
430nm
buffer
Fig. 8. The absorption spectrum (300~1000nm) of the coupled enzyme reactions
catalyzing histamine. The scan parameters of UV-3310 are as follows: start wavelength is 1000 nm, end wavelength is 300 nm, delay time is 120 sec, scan speed is 300 nm/min and silt is 2 nm. Reaction conditions: 37 , pH 7.0, 100 mM ℃ Phosphate buffer, 30 mM ABTS, 0.4 mM histamine, 0.48 unit/ml DAO and 0.2 unit/ml HRP. The product of coupled enzyme reactions catalyzing histamine had only one light absorbance peak at 430 nm.
R
2=0.9981
HRP concentration determination
HRP concentration (U/ml)
0.0 0.5 1.0 1.5 2.0 2.5 3.0
Initial rate (dA
650/min) 0 2 4 6 8 10 12 0.00 0.05 0.10 0.15 0.20 0.25 0 1 2 3 4 5
Fig. 9. The curve of initial rate versus the different HRP concentration Reaction conditions: ABTS 30 mM, H2O2 400 μM, Phosphate buffer 100mM, pH 7.0 and 25 .℃ There is a linear range of HRP between 0.05 to 0.2 U/ml; therefore, we choose 0.2 U/ml of HRP to catalyze in the ABTS/H2O2 colorimetry system.
Michaelis-Menten
ABTS (mM)
Fig. 10. The curve of initial rate versus the concentration of ABTS. Reaction conditions : HRP 0.2U/ml, H2O2 400 μM, Phosphate buffer 100mM, pH 7.0 and 25 .℃
0 10 20 30 40 50 Initial r a te ( d A650/min) 0.0 0.5 1.0 1.5 2.0 2.5
Km=13.08 1.44 mM
±
GOx concentration determination
GOD concentration (U/ml)
0.0 0.5 1.0 1.5 2.0 2.5 3.0 3.5 Initial rate (dA65 0/m in) 0.0 0.2 0.4 0.6 0.8 1.0 1.2 1.4 1.6 0.0 0.2 0.4 0.6 0.8 1.0 0.0 0.2 0.4 0.6 0.8 1.0
R
2=0.9998
Fig. 11. The curve of initial rate versus the different GOx concentration Reaction conditions: glucose 100mM, HRP 0.2U/ml, ABTS 30mM, phosphate buffer 100mM, pH 7.0 and 25 .℃ The linear range of glucose oxidase ranged from 0.01 to 0.8 U/ml.
DAO concentration determination DAO (U/ml) 0.000 0.005 0.010 0.015 0.020 0.025
Fig. 12. The curve of initial rate versus the different DAO concentration Reaction conditions: histamine 2mM, HRP 0.2U/ml, ABTS 30mM, phosphate buffer 100mM, pH 7.0 and 37 . The linear range of diamine oxidase ranged from ℃ 0.4 to 2 U/ml
In
it
ial rate (dA
430/
min)
R
2=0.9991
glucose couple enzyme reactions pH profile pH 2 3 4 5 6 7 8 9 10 Init ial rat e (dA650/min) 0 1 2 3 4 Citrate buffer 100mM Phosphate buffer 100mM Tris buffer 100mM
Fig. 13. The pH profile of D-(+)-glucose coupled enzyme reactions. Reaction conditions: glucose 100mM, HRP 0.2U/ml, GOx 0.48U/ml, ABTS 30mM, and 25 .℃
diamine oxidase pH profile
pH
6.4 6.6 6.8 7.0 7.2 7.4 7.6
Initial rate (dA430/min)
0.000 0.002 0.004 0.006 0.008
Fig. 14. The pH profile of histmaine coupled enzyme reactions. Reaction conditions: histamine 400μM, HRP 0.2U/ml, DAO 0.8U/ml, ABTS 30mM and 37 .℃
Temperature effect of glucose couple enzyme reactions
Temperature (0C)
15 20 25 30 35 40 45
Initial rate (d650nm/min)
0.00 0.01 0.02 0.03 0.04 0.05 0.06
Fig. 15. The temperature effect of D-(+)-glucose coupled enzyme reactions. Reaction conditions: glucose 100mM, HRP 0.2U/ml, GOx 0.48U/ml, ABTS 30mM, phosphate buffer 100mM and pH 7.0.
histamine-DAO temperature effect
Temperature ( 0C) 20 25 30 35 40 45 50 Initi a l rate (dA430/mi n ) 0.000 0.005 0.010 0.015 0.020 0.025 0.030 0.035 0.040Fig. 16. The temperature effect of hitamine coupled enzyme reactions. Reaction conditions: histamine 2mM, HRP 0.2U/ml, DAO 0.8U/ml, ABTS 30mM, phosphate buffer 100mM and pH 7.0.
(a). 650 nm system
(b). 430 nm system
Fig. 17. The CMOS chip output voltage at different hydrogen dioxide
concentrations in the 650 nm and 430 nm system. Reaction conditions: (a)
HRP 0.2U/ml, ABTS 30mM, Phosphate 100mM, pH 7.0 and 37℃. (b) HRP 0.2U/ml, ABTS 30mM , Phosphate 100mM, pH 7.0 and 25℃.
(a). 650 nm bio-sensing system H2O2 concentration curve H2O2 (μM) 0.0 0.1 0.2 0.3 0.4 0.5 0.6 (b). 650 nm UV/Vis spectrophotometer
Fig. 18. Hydrogen dioxide detection limit in the 650 nm system. Reaction
conditions (both on (a) and (b)): HRP 0.2U/ml, ABTS 30mM, Phosphate 100mM, pH 7.0 and 25℃. (a) The detection limit is 1 μM. (b) The detection limit is 1 μM.
Init ial rat e (dA650/ m in) 0 2 4 6 8 10 12 H2O2 concentration curve H2O2 (μM) 0 2 4 6 8 10 12 In it ial r (d m in a te A650/ ) 0.0 0.1 0.2 0.3 0.4 0.5 0.6 0.7 0.8
(a). 430 nm bio-sensing system H2O2 concentration curve H2O2 (μM) (b). 430 nm UV/Vis spectrophotometer
Fig. 19. Hydrogen dioxide detection limit in the 430 nm system. Reaction conditions (both on (a) and (b)): HRP 0.2U/ml, ABTS 30mM, Phosphate 100mM, pH 7.0 and 37℃. (a) The detection limit is 1 μM. (b) The detection limit is 1 μM.
0 2 4 6 8 10 12 Ini tia l rat e ( d A4 30/ m in) 0.0 0.1 0.2 0.3 0.4 0.5 0.6 H2O2 concentration curve H2O2 (μM) 0.2 0.4 0.6 0.8 1.0 1.2 1.4 1.6 Ini tial rate ( d A43 0 /mi n ) 0.0 0 2 4 6 8 10 12
(a). 650 nm bio-sensing system
Hydrogen dioxide concentration curve (biosensor / 650 nm) H2O2 (μM) 0 5 10 15 20 25 Initia l r a te (d A 6 5 0 /min ) 0.0 0.2 0.4 0.6 0.8 1.0 1.2 (b). 650 nm UV/Vis spectrophotometer
Fig. 20. Hydrogen dioxide linear detection range in the 650 nm system. Reaction conditions (both on (a) and (b)): HRP 0.2U/ml , ABTS 30mM, Phosphate 100mM, pH 7.0 and 25℃. (a) Linear detection range:1 ~ 20μM. (b) Linear detection range:1 ~ 80 μM.
(a). 430 nm bio-sensing system
Hydrogen dioxide concentration curve ( biosensor system 430 nm)
H2O2 (μM)
0 5 10 15 20 25
Initial rate (dA430/min)
0.0 0.2 0.4 0.6 0.8 1.0 1.2 (b). 430 nm UV/Vis spectrophotometer
Fig. 21. Hydrogen dioxide linear detection range in the 430 nm system. Reaction conditions (both on (a) and (b)):HRP 0.2U/ml, ABTS 30mM, Phosphate 100mM, pH 7.0 and 37℃. (a) Linear detection range:1 ~ 20μM. (b) Linear detection range:1 ~ 80 μM.
(a)
biomedical sensor system (650nm)
glucose (mM)
0 20 40 60 80 100 120 140 160 180
In
itail rate (dA650/m
in)
0.0 0.2 0.4 0.6 0.8 1.0 1.2 1.4 1.6 0.00 0.02 0.04 0.06 0.08 0.10 0.12 0.14 0.16 0.18 0.00 0.01 0.02 0.03 0.04 (b)U-3310 spectrophotometer (650nm)
0 50 100 150 200Initail rate (dA650/min)
0.0 0.5 1.0 1.5 2.0 0.00 0.02 0.04 0.06 0.08 0.10 0.12 0.14 0.16 0.18 0.00 0.01 0.02 0.03 0.04 0.05
(c)
Fig. 22. Enzyme kinetic analysis curve of glucose oxidase. (a) on our assembled biosensor system. (b) on UV/Vis spectrophotometer (UV-3310). (c) CMOS chip output voltage at different glucose concentration. Reaction conditions (on (a), (b) and (c)): HRP 0.2U/ml, GOx 0.48U/ml, ABTS 30mM, Phosphate buffer 100mM, pH 7.0 and 25 . Input voltage of CMOS chip is 3.0 V, and input voltage of LED is 2.2℃ 5V. The detection limit are 1 μM on both (a) and (b). The liner detection ranges of our assembled biosensing system ranged from 1 μM to 5 mM on both (a) and (b).
(a)
biomedical sensor sysytem (430nm)
histamine (uM)
(b)
0 200 400 600
initial rate (dA430/min)
0.000 0.001 0.002 0.003 0.004 0.0000 0.0005 0.0010 0.0015 0.0020 0.0025 0 20 40 60 80 100
U-3310 spectrophotometer (430nm)
histamine (uM)
0 200 400 600 800 1000 1200 1400Initial r
a
te (dA430/min)
0.000 0.002 0.004 0.006 0.008 0.010 0.012 0.014 0.016 0 20 40 60 80 100 120 140 0.000 0.002 0.004 0.006 0.008(c)
Fig. 23. Enzyme kinetic analysis curve of diamine oxidase. (a) on our assembled biosensor system. (b) on UV/Vis spectrophotometer (UV-3310). (c) CMOS chip output voltage at different histamine concentration. Reaction conditions (on (a), (b) and (c)): HRP 0.2U/ml, DAO 0.8U/ml, ABTS 30mM, Phosphate buffer 100mM, pH 7.0 and 37 . Input voltage of CMOS chip is 3.0 V℃ and input voltage of LED is 3.5V. The detection limit is 10 μM on (a) and it is 20 μM on (b). The liner detection ranges of our assembled biosensing system range from 10 μM to 80 μM on (a) and 20 μM to 120 μM on (b).