Research Article
Rule-Based Knowledge Acquisition Method for Promoter
Prediction in Human and
Drosophila Species
Wen-Lin Huang,
1Chun-Wei Tung,
2Chyn Liaw,
3Hui-Ling Huang,
3,4and Shinn-Ying Ho
3,41Department of Management Information System, Asia Pacific Institute of Creativity, Miaoli 351, Taiwan
2School of Pharmacy, College of Pharmacy, Kaohsiung Medical University, Kaohsiung 807, Taiwan
3Institute of Bioinformatics and Systems Biology, National Chiao Tung University, Hsinchu 300, Taiwan
4Department of Biological Science and Technology, National Chiao Tung University, Hsinchu 300, Taiwan
Correspondence should be addressed to Shinn-Ying Ho; syho@mail.nctu.edu.tw Received 31 August 2013; Accepted 10 October 2013; Published 29 January 2014 Academic Editors: L. Bao and J. Wang
Copyright © 2014 Wen-Lin Huang et al. This is an open access article distributed under the Creative Commons Attribution License, which permits unrestricted use, distribution, and reproduction in any medium, provided the original work is properly cited. The rapid and reliable identification of promoter regions is important when the number of genomes to be sequenced is increasing very speedily. Various methods have been developed but few methods investigate the effectiveness of sequence-based features in promoter prediction. This study proposes a knowledge acquisition method (named PromHD) based on if-then rules for promoter prediction in human and Drosophila species. PromHD utilizes an effective feature-mining algorithm and a reference feature set of 167 DNA sequence descriptors (DNASDs), comprising three descriptors of physicochemical properties (absorption maxima, molecular weight, and molar absorption coefficient), 128 top-ranked descriptors of 4-mer motifs, and 36 global sequence descriptors. PromHD identifies two feature subsets with 99 and 74 DNASDs and yields test accuracies of 96.4% and 97.5% in human and Drosophila species, respectively. Based on the 99- and 74-dimensional feature vectors, PromHD generates several if-then rules by using the decision tree mechanism for promoter prediction. The top-ranked informative rules with high certainty grades reveal that the global sequence descriptor, the length of nucleotide A at the first position of the sequence, and two physicochemical properties, absorption maxima and molecular weight, are effective in distinguishing promoters from non-promoters in human and Drosophila species, respectively.
1. Introduction
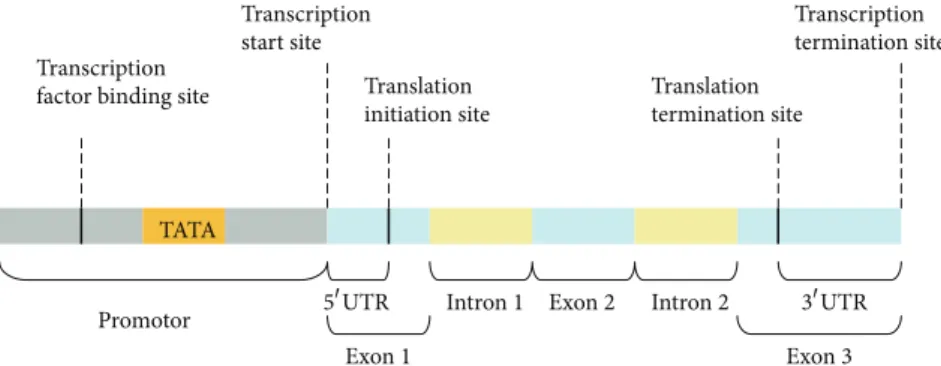
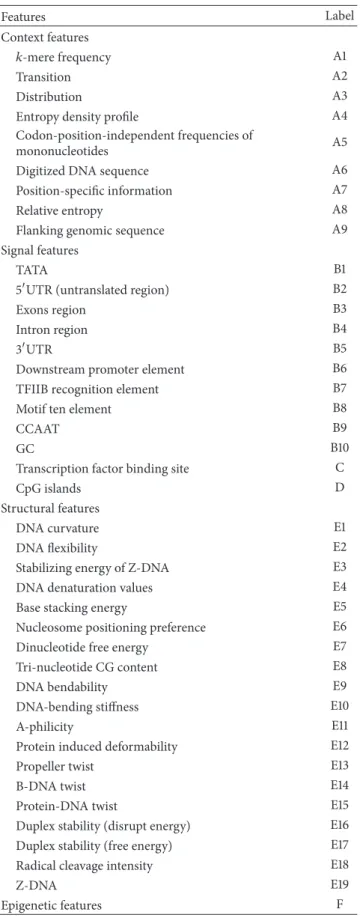
Gene expression is often regulated by the transcription rate, which is largely controlled by the binding of RNA polymerase II (Pol II) to the regulatory regions of DNA sequences in eukaryotic cells [1]. The regulatory regions (called promoters) that contain a transcription factor binding site and a TATA box are immediately upstream of transcription start sites at which transcription factors and Pol II are accumulated to initiate the transcription (Figure1) [2,3]. Promoters are extremely diverse and difficult to identify experimentally using specific sequence patterns or motifs [3,4]. Therefore, the identification of promoters is very challenging, especially in the sequencing of eukaryotic genomes. Some methods for predicting promoters have been developed, and these methods may be categorized into the following four classes according their types of sequence features (see Table1).
(1) Context-Feature Class. Context features are con-tents of the documents that are represented by basic unit DNA words called k-mer motifs (k-base-long nucleotide sequences) [5]. Besides k-mer fre-quency, some features based on k-mer motifs are also used in promoter prediction including tran-sition [6], distribution [6], entropy density profile (EPD) [6], codon-position-independent frequencies of mononucleotides [6,7], digitized DNA sequence [8], position-specific propensity [9, 10], relative entropy [10], and flanking genomic sequence [4]. (2) Signal-Feature Class. Powerful biological signals
con-tain core-promoter elements [11], some short mod-ular transcription factor binding sites [12], and CpG islands [13,14]. The core-promoter elements that play important roles in the assembly of transcriptional
Volume 2014, Article ID 327306, 14 pages http://dx.doi.org/10.1155/2014/327306
Promotor Translation initiation site Transcription start site Translation termination site Transcription termination site Exon 1
Intron 1 Exon 2 Intron 2
Exon 3 Transcription
factor binding site
TATA
3UTR
5UTR
Figure 1: The promoter of a DNA sequence containing a transcription factor binding site and a TATA box is immediately upstream to a transcription start site.
machinery contain the TATA box, the exons region [15,16], the intron region (initiator sequences), [15, 17–19], downstream promoter elements [20], a TFIIB recognition element [11], motif ten element [21], and CCAAT box [19, 22, 23]. The TATA box, initiator sequences, and consensus sequences for transcription factor binding sites are often used in various promoter recognition methods [24]. However, these features have been confirmed to exist only in a small propor-tion of all human promoters [25,26].
(3) Structure-Feature Class. Many physical and structural properties of DNA sequences are estimated. They include DNA curvature [27], flexibility [22, 23], denaturation values [28, 29], base stacking energy [16, 28], stabilizing energy of Z-DNA [30], Z-DNA [31], and radical cleavage intensity [28, 32]. In par-ticular, McPromoter [29] is a probabilistic promoter predictor that uses a neural network to combine the sequence features and structural profiles, such as those of DNA bend ability or GC structure, in promoter prediction.
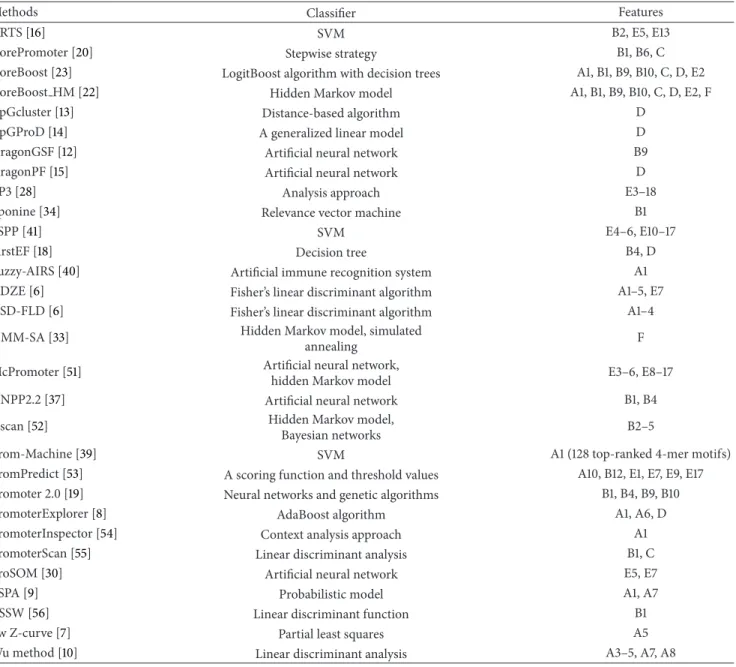
(4) Epigenetic-Feature Class. Few promoter prediction methods utilize epigenetic information [22,33]. For example, HMM-SA is a supervised learning method for predicting promoters and enhancers from their unique chromatin modification signatures [33]. Simi-larly, CoreBoost HM systematically analyzes different chromatin features for promoter prediction [22]. Table 2 lists some representative methods that use the above four types of features in combination with effective classifiers to predict promoters. These classifiers involve Fisher’s linear discriminant algorithm [6], the hidden Markov model [22, 23], the AdaBoost algorithm [8], decision trees [18], relevance vector machines [34], the expectation max-imization algorithm [35,36], artificial neural networks [12, 15, 17, 19, 29, 37], support vector machines (SVM) [38, 39], artificial immune recognition systems [40], and others. Recently, the use of ensemble classifiers has become popular in promoter prediction systems. For example, CoreBoost [23] and CoreBoost HM [22] used ensemble classifiers to improve prediction performance. These methods apply boosting tech-niques with stumps to extract sequence features, including
the core-promoter elements score, transcription factor bind-ing site density, the DNA flexibility of promoter sequences, Markovian log-likelihood ratio scores, k-mer frequencies, and epigenetic features.
Even though many promoter prediction methods have been developed, the effectiveness of used features in identi-fying promoters still needs to be explored. However, accurate promoter prediction relies largely on feature extraction and model selection [3]. Currently, Prom-Machine [39] simply selected 128 four-mer motifs and then utilized these motifs in conjunction with SVM to improve prediction sensitivity and specificity toward the DNA sequences of the five fol-lowing species: plants, Drosophila, human, mouse, and rat. Additionally, one recently published method, FSPP [41], used both filter and wrapper algorithms to select effective feature subsets from 13 kinds of structural features, including DNA-bending stiffness, duplex free energy, and duplex disrupt energy to improve further the sensitivity and accuracy of promoter prediction. Our previous method, ProPolyII [42], selects a small number of sequence-based features to improve prediction performance in human species.
These methods motivate this work to focus on feature selection and effectiveness evaluation of the selected features in promoter prediction. This work presents a knowledge acquisition method (named PromHD) based on if-then rules for promoter prediction in human and Drosophila species. The knowledge can be revealed from three aspects: (1) identified informative DNA sequence descriptors (DNASDs), (2) rules of distinguishing promoter from nonpromoter, and (3) further analysis of distinguishable mechanism using DNASDs. PromHD utilizes a reference feature set of 167 DNASDs, comprising three descriptors of physicochemical properties (absorption maxima, molecular weight, and molar absorption coefficient) [43, 44] with 128 top-ranked fre-quency descriptors of 4-mer motifs and 36 global sequence descriptors. To the best of our knowledge, these three descriptors of physicochemical properties are used herein for the first time in identifying promoter DNA sequences and their sequence-based representation differs from the structural profiles of McPromoter [29]. The 128 top-ranked frequency descriptors of 4-mer motifs are extracted from 256 4-mer combinations of nucleotides (4-base-long nucleotide sequences) according to the scores that equal the difference
Table 1: Conventional features for promoter prediction. Features Label Context features 𝑘-mere frequency A1 Transition A2 Distribution A3
Entropy density profile A4
Codon-position-independent frequencies of
mononucleotides A5
Digitized DNA sequence A6
Position-specific information A7
Relative entropy A8
Flanking genomic sequence A9
Signal features
TATA B1
5UTR (untranslated region) B2
Exons region B3
Intron region B4
3UTR B5
Downstream promoter element B6
TFIIB recognition element B7
Motif ten element B8
CCAAT B9
GC B10
Transcription factor binding site C
CpG islands D
Structural features
DNA curvature E1
DNA flexibility E2
Stabilizing energy of Z-DNA E3
DNA denaturation values E4
Base stacking energy E5
Nucleosome positioning preference E6
Dinucleotide free energy E7
Tri-nucleotide CG content E8
DNA bendability E9
DNA-bending stiffness E10
A-philicity E11
Protein induced deformability E12
Propeller twist E13
B-DNA twist E14
Protein-DNA twist E15
Duplex stability (disrupt energy) E16 Duplex stability (free energy) E17
Radical cleavage intensity E18
Z-DNA E19
Epigenetic features F
between the occurrence frequencies of the 4-mer motif in the positive and negative datasets [45, 46]. PromHD
further utilizes an effective feature mining algorithm (called DNASDmining), which is based on an inheritable biob-jective genetic algorithm [47, 48], to mine informative DNASDs.
A total of 1871 human and 1926 Drosophila promoter sequences were downloaded from the Eukaryotic Promoter Database [49], which is a database containing over 4800 promoters from various species. The same numbers of nonpromoters in human and Drosophila species were col-lected to evaluate the proposed PromHD method. Accord-ingly, PromHD identifies two subsets of 99 and 74 DNASDs and yields test accuracies of 96.4% and 97.5% in human and
Drosophila species, respectively, which are better than those
of SVM-4mer (91.0% and 94.6%) and SVM-GSD (93.6% and 89.2%), respectively. Based on each of the 99- and 74-dimensional feature vector, PromHD uses the decision tree method C5.0 [50] to generate several if-then rules. The top-ranked rules reveal that the global sequence descriptor, the length of nucleotide A at the first position of the sequence, is efficient in distinguishing human promoters from nonpromoters, consistent with the findings of Wang et al. and Zhao et al. [22,23]. Alternatively, the top-ranked rules in Drosophila species reveal that two physicochemical properties, absorption maxima and molecular weight, are effective in distinguishing promoters from nonpromoters. Further analysis of the two feature subsets shows that 32 features are common including three physicochemical prop-erties, 14 descriptors of 4-mer motifs, and 15 global sequence descriptors. When the three descriptors of physicochemical properties are excluded, PromHD with the remaining96(= 99 − 3) and 71(= 74 − 3) DNASD features yield test accuracies of 94.4% and 95.5% in human and Drosophila test datasets, respectively. The prediction accuracies fall by 2.0% (= 96.4% − 94.4% and = 97.5% − 95.5%), reconfirming the three physicochemical properties are obviously effective in distinguishing promoters from nonpromoters in human and Drosophila species. The promoter prediction system by using the PromHD method has been implemented at http://iclab.life.nctu.edu.tw/promhd.
2. Materials and Methods
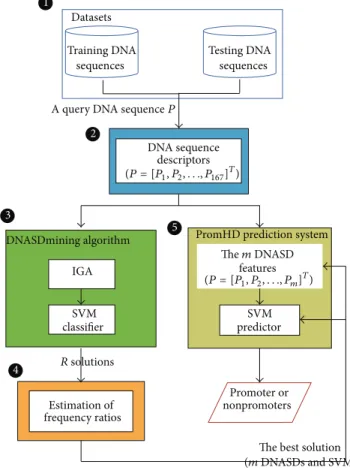
In this work, a block diagram is used to illustrate the main components of the proposed PromHD method. Figure 2 presents five main components, which are datasets, DNA sequence descriptors, DNASDmining algorithm, estimating appearance-frequency ratios, and the PromHD prediction system.
2.1. Datasets. More than 4800 eukaryotic Pol II promoters
from many species have been collected in the Eukaryotic Promoter Database (http://epd.vital-it.ch) in May 2013 [49], in which the transcription start site was determined exper-imentally and the numbers of promoters in the human and
Drosophila species greatly exceed those in other species.
Table 2: Some representative prediction methods and classifiers with their used features. The informative features are explained in Table1.
Methods Classifier Features
ARTS [16] SVM B2, E5, E13
CorePromoter [20] Stepwise strategy B1, B6, C
CoreBoost [23] LogitBoost algorithm with decision trees A1, B1, B9, B10, C, D, E2
CoreBoost HM [22] Hidden Markov model A1, B1, B9, B10, C, D, E2, F
CpGcluster [13] Distance-based algorithm D
CpGProD [14] A generalized linear model D
DragonGSF [12] Artificial neural network B9
DragonPF [15] Artificial neural network D
EP3 [28] Analysis approach E3–18
Eponine [34] Relevance vector machine B1
FSPP [41] SVM E4–6, E10–17
FirstEF [18] Decision tree B4, D
Fuzzy-AIRS [40] Artificial immune recognition system A1
GDZE [6] Fisher’s linear discriminant algorithm A1–5, E7
GSD-FLD [6] Fisher’s linear discriminant algorithm A1–4
HMM-SA [33] Hidden Markov model, simulated
annealing F
McPromoter [51] Artificial neural network,
hidden Markov model E3–6, E8–17
NNPP2.2 [37] Artificial neural network B1, B4
Nscan [52] Hidden Markov model,
Bayesian networks B2–5
Prom-Machine [39] SVM A1 (128 top-ranked 4-mer motifs)
PromPredict [53] A scoring function and threshold values A10, B12, E1, E7, E9, E17 Promoter 2.0 [19] Neural networks and genetic algorithms B1, B4, B9, B10
PromoterExplorer [8] AdaBoost algorithm A1, A6, D
PromoterInspector [54] Context analysis approach A1
PromoterScan [55] Linear discriminant analysis B1, C
ProSOM [30] Artificial neural network E5, E7
PSPA [9] Probabilistic model A1, A7
TSSW [56] Linear discriminant function B1
vw Z-curve [7] Partial least squares A5
Wu method [10] Linear discriminant analysis A3–5, A7, A8
1871 nonpromoters), and DP (1926 Drosophila promoters and 1926 nonpromoters), are established and used in this work to evaluate the proposed PromHD method. Segments of promoter sequences from −200 to +51 relative to a transcription start site [39] are collected. The nonpromoter sequences are extracted from the EMBL CDS (coding sequences) database (ftp://ftp.ebi.ac.uk/pub/databases/embl/ cds/), which is a database of nucleotide coding sequences.
Both of the HP and DP datasets are equally divided into two subsets—one for training (learning) (HPL and DPL) and the other for independent testing (HPT and DPT). The learning dataset is done with the purpose of identifying a small set of DNASDs and finding the best parameters of a SVM to train the complete dataset [57, 58] (see Evaluation Measures). The sequences in the training and test datasets are randomly and near-equally partitioned. The numbers of
DNA sequences within promoter and nonpromoter classes are presented in Supplementary Table S1 available online at http://dx.doi.org/10.1155/2014/327306.
2.2. DNA Sequence Descriptors. This work presents a
reference feature set of 167 DNA sequence descriptors (DNASDs in Supplementary Material) that comprises three sequence descriptors of physicochemical properties, 128 top-ranked frequency descriptors of 4-mer motifs, and 36 global sequence descriptors. Therefore, a DNA sequence is represented as a 167-dimensional feature vector 𝑃 = [𝑃1, 𝑃2, . . . , 𝑃𝑛]𝑇, where 𝑛 = 167. All of the features of P are rescaled into the range [0, 1] and are employed to SVM (Figure2). The following three sections describe three subsets of DNASDs with using the sequence
Datasets Training DNA
sequences sequences
Testing DNA
A query DNA sequenceP
DNA sequence descriptors DNASDmining algorithm IGA SVM classifier R solutions
PromHD prediction system
Them DNASD features SVM predictor Promoter or nonpromoters Estimation of frequency ratios
The best solution
(m DNASDs and SVM with(C, r)) 1 2 3 4 5 (P = [P1, Pm]T) (P = [P1,P2, . . .,P167]T) P2, . . .,
Figure 2: A block diagram of the PromHD method. The block diagram mainly contains the following important parts: (1) datasets, (2) DNA sequence descriptors, (3) DNASDmining algorithm, (4) estimating appearance-frequency ratios, and (5) PromHD predic-tion system.
CATAGCCATTGCATGACCCG of length 20 as an example (called S20).
2.2.1. Physicochemical Properties of Nucleotides. The
physic-ochemical properties of the DNA structure of eukaryotic genomes are critical to promoter recognition. This study pro-poses a sequence-based set of three physicochemical proper-ties of nucleotides (http://www.geneinfinity.org) for design-ing prediction features that are used to distdesign-inguish promoters from nonpromoters. The three DNA sequence descriptors, denoted as𝐷AM,𝐷MW, and𝐷MAC, are derived from the three
physicochemical properties—absorption maxima, molecular weight, and molar absorption coefficient, respectively—by averaging over a nucleotide sequence [59]. The three descrip-tors are the attributes of the subvector [𝑃1, 𝑃2, 𝑃3] in the reference set of 167 DNASDs.
The sequence S20 has five As, seven Cs, four Gs, and four Ts. With reference to Table3, the values of the absorption maxima (determined at pH 7.0) for nucleotides A, C, G, and T are 259, 271, 253, and 267, respectively. Accordingly, the descriptor𝐷AMhas a value263.6 = (5 × 259 + 7 × 271 +
4 × 253 + 4 × 267)/20. The other two descriptors 𝐷MW and
𝐷MAChave values 484.95 and 11950, respectively.
2.2.2. Global Sequence Descriptors. The global description
of promoter/nonpromoter sequences contains four parts, entropy density profile (EDP), composition, transition, and distribution of DNA nucleotides [6]. The EDP model is a global statistical description for a DNA sequence, based on Shannon’s artificial linguistic description for a DNA sequence of finite length [60]. Let𝑞𝑖be the frequencies of occurrence of nucleotides in a promoter/nonpromoter sequence, where 𝑖 is the index that specifies the nucleotides (A, C, G, T). Six EDPs,𝐷EH,𝐷EQ,𝐷EA,𝐷EC,𝐷EG, and𝐷ET, correspond to the
six attributes of the subvector[𝑃4, . . . , 𝑃9], defined as follows: 𝐷EQ= 𝑞2A+ 𝑞2C+ 𝑞2G+ 𝑞2T, 𝐷EH= −∑ 𝑖 𝑞𝑖log𝑞𝑖, 𝐷E𝑖= 𝐷−1 EH 𝑞𝑖log𝑞𝑖, (1)
where𝐷EHis the Shannon entropy and𝐷EQis a statistical
quantity.
The composition is used to measure the frequency of occurrence of each kind of letters in the sequences, and thus herein it is the𝑞𝑖in (1). Additionally, the four frequencies𝑞𝑖 are also called 1-mer motifs of the nucleotides (A, T, C, and G), denoted as𝐷C1(A),𝐷C1(T),𝐷C1(C), and𝐷C1(G), and
correspond to the four attributes of[𝑃10, . . . , 𝑃13].
The third part, transition𝑇(𝛼, 𝛽), characterizes the per-cent frequency with which𝛼 is followed by 𝛽 or 𝛽 is followed by 𝛼. The six transition frequencies, 𝐷𝑇(A, C), 𝐷𝑇(A, G), 𝐷𝑇(A, T),𝐷𝑇(C, G),𝐷𝑇(C, T), and𝐷𝑇(G, T), correspond to the six attributes of [𝑃14, . . . , 𝑃19]. For example, for the S20 sequence, there are four transitions of this type𝑇(A, C),
CATAGCCATTGCATGACCCG in bold style; that is, the
value of𝐷𝑇(A, C) is 21.0526(= 4/19) × 100.00.
The fourth part of the global description, distribution, measures the chain length within which the first, 25%, 50%, 75%, and 100% of certain type of letters are located, respectively. For example, for the S20 sequence, the first, 25%, 50%, 75%, and 100% of the nucleotide A are located within the second, 4th, 8th, 13th, and 16th nucleotides, respectively. So, the five distributions of the nucleotide A, 𝐷𝐷(A, 1st), 𝐷𝐷(A, 25%),𝐷𝐷(A, 50%),𝐷𝐷(A, 75%), and𝐷𝐷(A, 100%), have values of 10(= 2/20∗100), 20 (= 4/20∗100), 40 (= 8/20∗ 100), 65 (= 13/20∗100), and 80 (= 16/20∗100), respectively. A total of 20(= 4 × 5) distributions corresponding to [𝑃20, . . . , 𝑃39] when four types of nucleotides are considered.
2.2.3. Frequency Descriptors of 4-Mer Motifs. The number of
4-mer combinations of nucleotides (4-base-long nucleotide sequences) is 256. Prom-Machine [39] uses top 128 of the 256 4-mer motifs to improve prediction sensitivity and specificity. Our earlier works estimated the scores of amino acids [45] and of GO terms [46] for predicting DNA-binding proteins and nonclassical secretory proteins, respectively. That motives this work, in which a score for each 4-mer motif is calculated and the 128 top-ranked 4-mer motifs based on those scores are identified. The score is the difference between the occurrence frequencies. A detailed description follows.
Table 3: Three physicochemical properties of nucleotide.
DNASD Description Nucleotide Rank by MED
A C G T Human DPL
𝐷AM Absorption maxima (determined at pH 7.0) 259 271 253 267 2 1
𝐷MW Molecular weight 491.2 467.2 507.2 482.2 7 2
𝐷MAC Molar absorption coefficient 15200 9300 13700 9600 11 3
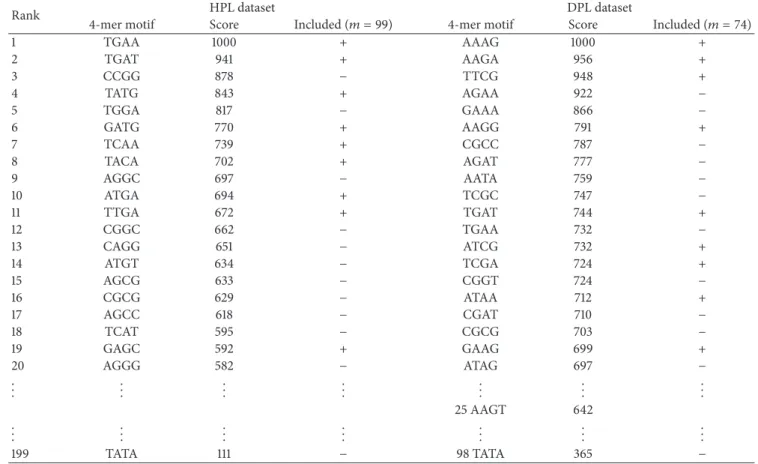
Table 4: Top 20 descriptors of 4-mer motifs. Top 20 descriptors of the 4-mer motifs are contained in the reference set of 167 DNASDs. The descriptors of the TATA motif are ranked at the 199th and 98th when applied for the HPL and DPL datasets, respectively.
Rank HPL dataset DPL dataset
4-mer motif Score Included (𝑚 = 99) 4-mer motif Score Included (𝑚 = 74)
1 TGAA 1000 + AAAG 1000 + 2 TGAT 941 + AAGA 956 + 3 CCGG 878 − TTCG 948 + 4 TATG 843 + AGAA 922 − 5 TGGA 817 − GAAA 866 − 6 GATG 770 + AAGG 791 + 7 TCAA 739 + CGCC 787 − 8 TACA 702 + AGAT 777 − 9 AGGC 697 − AATA 759 − 10 ATGA 694 + TCGC 747 − 11 TTGA 672 + TGAT 744 + 12 CGGC 662 − TGAA 732 − 13 CAGG 651 − ATCG 732 + 14 ATGT 634 − TCGA 724 + 15 AGCG 633 − CGGT 724 − 16 CGCG 629 − ATAA 712 + 17 AGCC 618 − CGAT 710 − 18 TCAT 595 − CGCG 703 − 19 GAGC 592 + GAAG 699 + 20 AGGG 582 − ATAG 697 − .. . ... ... ... ... ... ... 25 AAGT 642 .. . ... ... ... ... ... ... 199 TATA 111 − 98 TATA 365 −
+: included in the set of𝑚 DNASDs. −: not included in the set of 𝑚 DNASDs.
Step 1. The occurrence frequencies𝑓𝜔 and 𝐹𝜔 are those of the𝜔th 4-mer motif in all training promoter (positive) and nonpromoter (negative) sequences, respectively, where𝜔 = 1, 2, . . . , 256. For example, TATA is the 199th 4-mer motif, that is,𝜔 = 199, and its occurrence frequencies in the positive and negative classes of the HPL dataset are𝑓199 = 84 and 𝐹199= 453, respectively (see Table4).
Step 2. Calculate the total numbers of occurrences of 256
4-mer motifs in the positive and negative classes,Σ𝑓𝜔andΣ𝐹𝜔. For example, the total numbers of occurrences of 256 4-mer motifs in the positive and negative classes of the HPL dataset are 29104 and 137017, respectively.
Step 3. The two proportional frequencies of occurrence in
the positive and negative classes for each 4-mer motif are the
values of𝑓𝜔/Σ𝑓𝜔and𝐹𝜔/Σ𝐹𝜔, respectively. For example, the proportional frequencies of occurrence of TATA are 0.002892 (= 84/29104) and 0.003309 (= 453/137017) in the positive and negative classes, respectively.
Step 4. The score for each 4-mer motif is the absolute value
| ⋅ | of the difference between the proportional frequencies of occurrence in the positive class and that in the negative class. For example, the score of TATA is 0.000417(= |0.00309 − 0.002892|).
Step 5. Normalize scores of all 256 4-mer motif into the
range[0, 13000], and represent them as {𝜃1, 𝜃2, . . . , 𝜃𝑛}. The normalized score is also called the frequency descriptor of the 4-mer. For instance, the score of TATA motif is 111 (see Table4).
Step 6. All 256 frequency descriptors are ranked in
descend-ing order. The top 128 motifs with descriptors are denoted as 𝐷C4(⋅) and they correspond to [𝑃40, . . . , 𝑃167]. For example, the descriptor of the well-known TATA box, as shown in Table4, is𝐷C4(TATA) = 111 and corresponds to𝑃137 for the DPL dataset.
2.3. Proposed DNASDmining Algorithm. An efficient
feature-mining algorithm, DNASDfeature-mining, for identifying a set of informative DNASDs is developed. The DNASDmining algorithm is an expansive version of an inheritable biobjective genetic algorithm, which is based on an intelligent genetic algorithm (called IGA) [47, 61], to identify a small number 𝑚 out of 𝑛 = 167 DNASDs. The feature selection is a combinatorial optimization problem Comb(𝑛, 𝑚) with a huge search space of size Comb(𝑛, 𝑚) = 𝑛!/(𝑚!(𝑛 − 𝑚)!). The IGA, based on an orthogonal experimental design using a divide-and-conquer strategy and systematic reasoning, can efficiently solve the large combinatorial optimization prob-lem to obtain the solution𝑆𝑟to Comb(𝑛, 𝑟). The mechanism can efficiently search for the next solution𝑆𝑟+1to Comb(𝑛, 𝑟+ 1) by inheriting the last solution 𝑆𝑟. DNASDmining obtains all solutions𝑆𝑟from𝑟 = 𝑟startto𝑟endone by one using IGA
with the inheritable mechanism [47,61].
2.3.1. Feature Selection. The input of the DNASDmining
algo-rithm is a training set of DNA sequences that are categorized into two classes—promoter and nonpromoter sequences. The output comprises a set of𝑚 informative DNASDs and the parameter settings (𝐶, 𝛾) of an SVM classifier. The SVM is a binary classifier of LIBSVM with a radial basis kernel function [62], where a kernel parameter and a cost parameter 𝐶 are tuned by IGA. In this study, 𝛾 ∈ {2−7, 2−6, . . . , 28} and
𝐶 ∈ {2−7, 2−6, . . . , 28}. The IGA-chromosome 𝑆 comprises 𝑛 binary IGA-genes𝑔𝑖 for selecting informative features and two 4-bit IGA-genes for encoding 𝛾 and 𝐶, where 𝑖 = 1, 2, . . . , 167. The 𝑖th DNASD feature 𝑃𝑖 is used in the SVM classifier if 𝑔𝑖 = 1; otherwise, 𝑃𝑖 is excluded (𝑔𝑖 = 0). Figure2 shows the sequence representation and the IGA-chromosome encoding method. Supplementary Table S2 lists the parameter settings of IGA, such as population size𝑁pop=
20. In this algorithm DNASDmining, 𝑟start= 30, 𝑟end = 100,
and𝐺max= 60 based on former experience.
Step 1 (initiation). Randomly generate an initial population
of𝑁popindividuals. All the𝑛 binary genes in the individual 𝑆
have𝑟 1’s and 𝑛 − 𝑟 0’s where 𝑟 = 𝑟startand gen = 0.
Step 2 (evaluation). Evaluate the fitness values fitness(𝑆) of
all individuals. The fitness function of this training model is the prediction accuracy of 10-fold cross-validation (see Evaluation Measures) using the SVM classifier with the𝑚 DNASDs,𝛾, and 𝐶 by decoding the IGA-chromosome.
Step 3 (selection). Use the simple ranking selection that
replaces the worst𝑝𝑠⋅ 𝑁popindividuals by the best𝑝𝑠⋅ 𝑁pop
individuals to form a new population where𝑝𝑠is the selection probability.
Step 4 (crossover). Select𝑝𝑐⋅ 𝑁popparents from the mating
pool to perform orthogonal array crossover [47,61] on the selected pairs of parents where𝑝𝑐is the crossover probability.
Step 5 (mutation). Apply the swap mutation operator to the
randomly selected𝑝𝑚⋅𝑁popindividuals in the new population
where𝑝𝑚 is the mutation probability. To prevent a decline in the best fitness value, mutation is not applied to the best individual.
Step 6 (termination test). If𝑔𝑒𝑛 = 𝐺max, then output the best individual as𝑆𝑟. Otherwise, increase the number gen by one, and go to Step2.
Step 7 (inheritance). If𝑟 < 𝑟end, then randomly change one
bit in the binary genes of each individual from 0 to 1; increase the number𝑟 by one and let gen = 0, and go to Step2.
Step 8 (decoding chromosome). Let𝑆𝑚be the most accurate solution with 𝑚 selected DNASDs among all solutions 𝑆𝑟 Obtain the𝑚 informative features and values of the parame-ters𝛾 and 𝐶.
Step 9 (system uncertainty). Perform Steps1–8for𝑅 inde-pendent runs to obtain the best solution,𝑆𝑚, and the associ-ated parameter settings of the SVM classifier (see Section2.4).
2.3.2. Evaluation Measures. The independent dataset test,
subsampling or𝑁-fold (e.g., 5- or 10-fold) cross-validation test, and the jackknife test are often used to examine the accuracy of a statistical prediction method [63]. The jackknife test is deemed to be the least arbitrary method that can always yield a unique result for a given benchmark dataset [64]. The 𝑁-fold cross-validation test is used to estimate the error that is involved in the predictions and thus it is also used for model selection [65]. In this work, 10-fold cross-validation scheme is used. Additionally, the independent dataset test is also used in this work to avoid overestimating the success rate of the training model.
Overall accuracy (ACC), sensitivity (SN), and specificity (SP) are three quality measures that are widely used to evaluate the performance of promoter prediction methods [66]. This work also utilizes Matthews correlation coefficient (MCC) to measure the overall performance of the prediction models. It takes into account true and false positives and negatives and is generally regarded as a balanced measure which can be used even if the classes are of very different sizes [67]. These measures are defined as below:
ACC= (TP + TN) (TP + FP + TN + FN), SN= TP (TP + FN), SP= TN (TN + FP),
MCC
= (TP ∗ TN + FP ∗ FN)
√(TP + FP) ∗ (TP + FN) ∗ (TN + FP) ∗ (TN + FN). (2) TP, TN, FP, and FP stand for true positive, true negative, false positive, and false negative, respectively. The MCC returns a value in the range [−1, 1]. A value of 1 indicates a perfect prediction; 0 indicates a random prediction, and−1 indicates an inverse prediction.
2.4. Estimating the Appearance-Frequency Ratios. A total of
𝑅 experimental runs are executed to obtain the best solution in this work due to the system uncertainty of the IGA-based feature selection algorithm. That means that𝑅 solutions are generated and each solution comprises a subset of𝑚𝑘selected DNASDs for𝑘 = 1, . . . , 𝑅. The best solution must have both high prediction accuracy and a high appearance-frequency value. The estimation procedure is further described below.
Step 1. Calculate the appearance-frequency𝐴𝑓𝑗according to (3) for each of𝑗 = 1, 2, . . . , 167 DNASDs in all 𝑅 runs. For example,𝑅 = 20 and the 𝐷𝑀𝑊descriptor that is the 129th out of 167 DNASDs appears 19 times, so its appearance-frequency 𝐴𝑓129= 19.
Step 2. Sum all appearance frequencies to obtain𝐴𝐹(= Σ𝑓j)
according to (4).
Step 3. Calculate the appearance-frequency𝐴𝑓𝑘for each run, 𝑘 = 1, . . . , 𝑅 using (5).
Step 4. Calculate the appearance-frequency ratio R𝑘 =
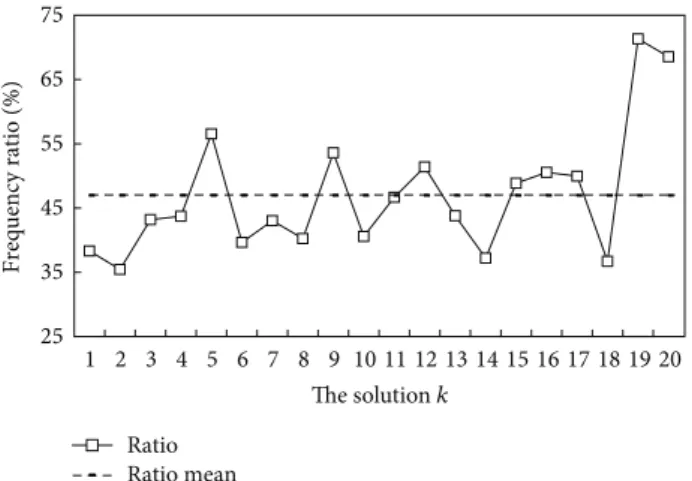
𝐴𝑓𝑘/𝐴𝐹 and the mean value R𝑚. For instance, Figure 3
displays the meanR𝑚= 47.0% for the HPL dataset.
Step 5. Select the candidate solutions 𝑆𝑘 from the𝑅 runs whose appearance-frequency ratiosR𝑘 are larger than the mean valueR𝑚. For instance, the appearance-frequency ratio R𝑘for𝑘 = 5, 9, 12, 15, 16, 17, 19, 20 exceeds the mean 47.0%, as shown by Figure3. Thus, these eight solutions are selected as the candidate solutions.
Step 6. The best solution is the candidate solutions𝑆𝑘with the highest prediction accuracy. For the above example, the 5th candidate solution𝑆5 having the highest accuracy 98.9% is selected as the best solution of the DNASDmining algorithm, where(𝐶, 𝛾) = (27, 2−5), 𝐴𝑓𝑗 =∑𝑅 𝑘=1 𝑎𝑓𝑗𝑘, 𝑗 = 1, 2, . . . , 167, (3) 𝐴 𝐹 =167∑ 𝑗=1𝐴𝑓𝑗, (4) 25 35 45 55 65 75 1 2 3 4 5 6 7 8 9 10 11 12 13 14 15 16 17 18 19 20 The solution k Frequency ratio (%) Ratio Ratio mean
Figure 3: Appearance-frequency ratios of𝑅 DNASDmining solu-tions, where𝑘 = 1, 2, . . . , 𝑅. The mean frequency ratio is 47.0% for HPL dataset.
𝐴𝑓𝑘=167∑
𝑗=1
𝑎𝑓𝑗𝑘, 𝑘 = 1, 2, . . . , 𝑅. (5)
2.5. PromHD Prediction System. The PromHD prediction
system is implemented by using a SVM classifier with a subset of m DNASDs, where the parameter settings of SVM and the value of m are determined in the training phase. Figure2 illustrates the prediction flowchart of PromHD. The input to this prediction system is a query DNA sequence P. The output is the predicted classpromoter or nonpromoter. The prediction procedure is described as follows.
Step 1. The query DNA sequence is represented as a
167-dimensional DNASD feature vectorP = [𝑃1, 𝑃2, . . . , 𝑃167]𝑇.
Step 2. The 𝑚 informative DNASDs are selected from P,
where 𝑚 = 99 and 74 for human and Drosophila DNA sequences, respectively.
Step 3. The𝑚 selected features are input to the trained SVM
to classifyP as a promoter or non-promoter.
3. Results and Discussion
3.1. Effectiveness of Informative DNASDs. DNA sequences
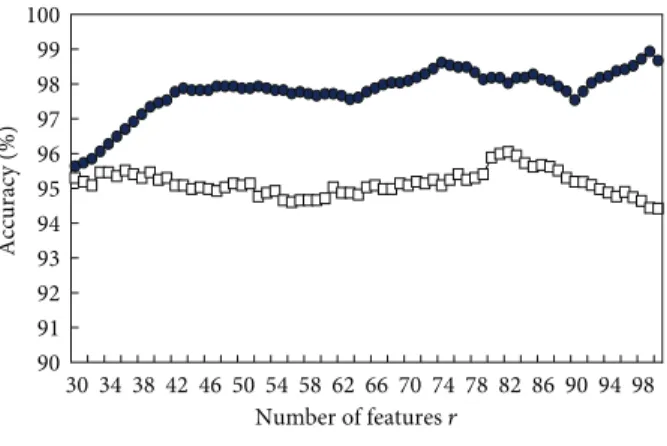
in this work are represented using 167-dimensional vectors of DNASDs. This work uses an efficient feature selection algorithm not only to select a subset of size 𝑚 from the 167 DNASDs but also to design a SVM-based classifier simultaneously. To determine the candidate solution 𝑆𝑟 in the DNASDmining algorithm, the prediction accuracy of 10-CV is used as a fitness function of the IGA. Figure 4 shows the training accuracies of PromHD from𝑟 = 30 to 100 when applied to the HPL dataset and processed the 5th experimental run. These accuracies exceed those of SVM-RBS using SVM with a number 𝑟 of selected informative DNASDs that are selected by the rank-based selection (RBS) method [68]. The RBS method is described below.
90 91 92 93 94 95 96 97 98 99 100 30 34 38 42 46 50 54 58 62 66 70 74 78 82 86 90 94 98 Number of features r Accuracy (%) SVM-RBS PromHD
Figure 4: Training accuracies of the PromHD method and using SVM with a number𝑟 of selected informative features for the HPL dataset.
Each of the𝑛 = 167 DNASDs was ranked according to the accuracy of the SVM with the estimated single feature, where the best values of parameters(𝐶, 𝛾) were determined using a stepwise approach, where𝛾 ∈ {2−7, 2−6, . . . , 28}, and 𝐶 ∈ {2−7, 2−6, . . . , 28}. The 100 top-rank features 𝛿
𝑖,𝑖 = 1, . . . , 100,
were then picked, and the 30 top-ranked features with𝑟 = 30 were used as an initial feature set{𝛿1, . . . , 𝛿30}. Consequently, the feature set with size𝑟 + 1 is incrementally created by adding the best feature𝛿𝑟+1(having the highest accuracy of SVM using 10-CV) from the remaining100 − 𝑟 features into the current feature set.
3.2. Comparison of Prediction Performance between PromHD and Other SVM-Based Methods. Two additional SVM-based
classifiers, SVM-4mer and SVM-GSD, are applied for com-parisons with SVM-RBS. The SVM-4mer and SVM-GSD methods are implemented by using the 128 top-ranked descriptors of 4-mer motifs and 36 global sequence descrip-tors, respectively, as input features to the SVM classifier without feature selection, respectively. The best values of parameters𝐶 and 𝛾 that are determined using a stepwise approach are used in the two SVM-based methods, where 𝛾 ∈ {2−7, 2−6, . . . , 28} and 𝐶 ∈ {2−7, 2−6, . . . , 28}.
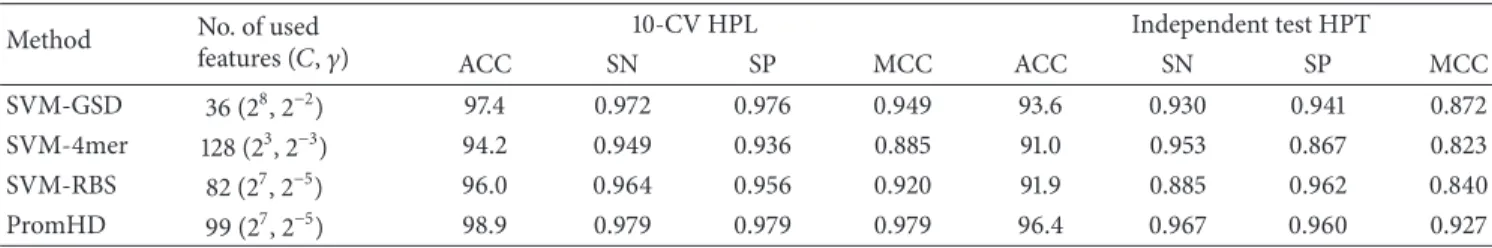
Tables 5and 6compare the three SVM-based methods in terms of performance when applied to the HP and DP datasets, respectively. SVM-GSD obtains the highest testing accuracy of 93.6% for the human species; SVM-4mer performs the best in Drosophila species. However, these testing accuracies are lower than those of PromHD, 98.9% and 96.4%, where𝑚 = 99 and 74 informative features are identified for human and Drosophila species, respectively. Additionally, the testing MCC values of PromHD are 0.927 and 0.949 for HPT and DPT, respectively, which exceed those of SVM-GSD (0.872 and 0.802), SVM-4-mer (0.823 and 0.830), and SVM-RBS (0.840 and 0.660), respectively. PromHD also yields high sensitivity (SN = 0.967 and 0.961)
and specificity (SP = 0.960 and 0.988) performances when used with HPT and DPT datasets, respectively.
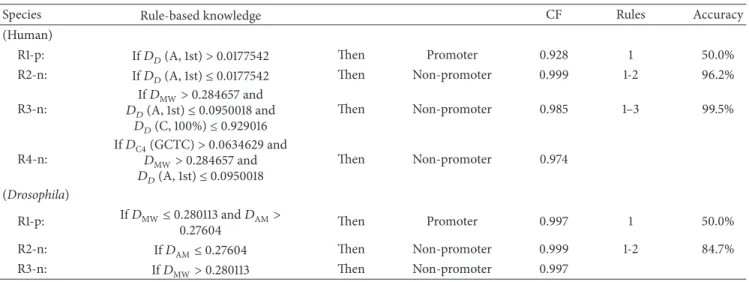
3.3. Rule-Based Knowledge. This work presents a knowledge
acquisition method based on if-then rule for insight of pro-moter prediction mechanism. The knowledge can be revealed from three aspects: (1) identified informative DNASDs, (2) rules of distinguishing promoters from nonpromoters, and (3) further analysis of distinguishable mechanism using DNASDs. This rule-based knowledge acquisition method uses decision tree method C5.0 [50] to develop if-then rules of the 99- and 74-dimensional DNASD feature vec-tors in human and Drosophila species. Each if-then rule has two types, one for promoter (Ri-p) and the other for nonpromoter (Ri-n) prediction, where𝑖 is the rule number index. The selected DNASDs are𝐷𝐷(A, 1st) (the length of nucleotide A at the first position of the sequence),𝐷𝐷(C, 100%) (the length of nucleotide C at the last position of the sequence),𝐷C4(GCTC) (the frequency descriptor of
4-mer GCTC), and𝐷MW (the physicochemical property of
molecular weight) in human species. Table 7 shows the interpretable rules as follows.
Rules in human species:
R1-p: if𝐷𝐷(A, 1st)> 0.0177542, then promoter prediction with CF = 0.928;
R2-n: if𝐷𝐷(A, 1st)≤ 0.0177542, then nonpromoter predic-tion with CF = 0.999;
R3-n: if 𝐷MW > 0.284657, 𝐷𝐷(A, 1st) ≤ 0.0950018
and𝐷𝐷(C, 100%) ≤ 0.929016, then nonpromoter prediction with CF= 0.999;
R4-n: if 𝐷C4(GCTC) >0.0634629, 𝐷MW > 0.284657 and
𝐷𝐷(A, 1st) 0.0950018, then nonpromoter prediction with CF= 0.974.
The CF is a certainty grade of this rule in the unit interval [0, 1]. The R1-p rule has a certainty grade of 0.928 to predict 935(= 50%×1871) human promoters by using the 𝐷𝐷(A, 1st) feature. With the same𝐷𝐷(A, 1st) feature, the second rule, R2-n, with a certainty grade of 0.999 can identify 864(= (96.2%− 50%) × 1871) nonpromoters. When applying these two rules, the rule-based classifier yields a prediction accuracy of 96.2%, reconfirming that the global sequence descriptor, the length of nucleotide A at the first position of the sequence, is an efficient feature in distinguishing human promoters from nonpromoters. When adding the third rule, PromHD further enhances the prediction accuracy up to 99.5%. For example, a query sequence P has normalized values of 0.0179, 0.9218, 0.2499, and 0.2823 for𝐷𝐷(A, 1st),𝐷𝐷(C, 100%),𝐷C4(GCTC),
and𝐷MW, respectively. The classification procedure using
the third rule R1-p (0.0179> 0.0177542) predicts this query sequence to be a promoter.
Alternatively, the selected DNASDs are 𝐷MW (the
physicochemical property of molecular weight) and𝐷AM
(the physicochemical property of absorption maxima) in
Drosophila species. The interpretable rules, as shown in
Table 5: Comparisons of training and test accuracies (ACC, %), sensitivity (SN), specificity (SP), and MCC for the HP dataset. Method No. of used
features (𝐶, 𝛾) 10-CV HPL Independent test HPT ACC SN SP MCC ACC SN SP MCC SVM-GSD 36 (28, 2−2) 97.4 0.972 0.976 0.949 93.6 0.930 0.941 0.872 SVM-4mer 128 (23, 2−3) 94.2 0.949 0.936 0.885 91.0 0.953 0.867 0.823 SVM-RBS 82 (27, 2−5) 96.0 0.964 0.956 0.920 91.9 0.885 0.962 0.840 PromHD 99 (27, 2−5) 98.9 0.979 0.979 0.979 96.4 0.967 0.960 0.927
Table 6: Comparisons of training and test accuracies (ACC, %), sensitivity (SN), specificity (SP), and MCC for the DP dataset. Method No. of used
features (𝐶, 𝛾) 10-CV DPL Independent test DPT ACC SN SP MCC ACC SN SP MCC SVM-GSD 36 (22, 2) 95.1 0.956 0.946 0.902 89.2 0.789 0.996 0.802 SVM-4mer 128 (23, 2−6) 96.4 0.960 0.967 0.952 94.6 0.912 0.981 0.830 SVM-RBS 31 (27, 1) 95.3 0.959 0.946 0.906 80.5 0.612 0.996 0.660 PromHD 74 (24, 1) 99.3 0.996 0.990 0.986 97.5 0.961 0.988 0.949
Rules in Drosophila species:
R1-p: if 𝐷MW ≤ 0.280113 and 𝐷AM > 0.27604, then
promoter prediction with CF = 0.997;
R2-n: if𝐷AM≤ 0.27604, then nonpromoter prediction with
CF = 0.999;
R3-n: if𝐷MW > 0.280113, then nonpromoter prediction
with CF = 0.997.
The rule-based classifier uses the first rule to predict 961 (= 50% × 1922) Drosophila promoters. The first two rules make the rule-based classifier have a prediction accuracy of 84.7% in Drosophila species. For example, a query sequence 𝑃 has normalized values of 𝐷MW and 𝐷AM, 0.4 and 0.3,
respectively. The classification procedure using the third rule R3-n 𝐷MW(= 0.4) > 0.280113 predicts this query DNA
sequence to be a nonpromoter.
3.4. Top 20 Descriptors of 4-Mer Motifs. Table 4 lists that the𝐷C4(TGAA) and𝐷C1(AAAG) descriptors have the max-imum scores when applied to the HPL and DPL datasets, respectively. A comparison between the two sets of the top 20 descriptors of 4-mer motifs reveals two common 4-mer motifs. One is TGAA, which has scores of 1000 and 732; the other is TGAT, at ranks of 2 and 12 when used with HPL and DPL datasets, respectively. The descriptors of the well-known TATA motif are ranked at the 199th and 98th when applied for the HPL and DPL datasets, respectively.
The former descriptor𝐷𝐶4(TATA) ranking at the 199th is excluded out of the reference feature set due to the fact that only 128 top-ranked descriptors of 4-mer motifs are allowed to be included. This agrees closely with the findings of Gershenzon and Ioshikhes [11], who found that the TATA motif exists only in a small proportion of all human promoters. Additionally, only nine descriptors are included in each of the two feature subsets of 𝑚 = 99 and 74 DNASD feature, which are marked with “+” Table4. This main reason is that the DNASDmining feature selection
algorithm considers a set of informative DNASDs at once, rather than individual DNASDs.
3.5. Analysis of the Identified DNASDs. The orthogonal
exper-imental design with orthogonal array and factor analysis is an efficient method for simultaneously examining the individual effect of several factors on the evaluative function [47,48]. In this study, the two levels of a factor represent its inclusion and exclusion of the feature in the feature selection using IGA [47, 48]. The factor analysis can quantify the effects of individual factors on the evaluation function, rank the most effective factors, and determine the best level for each factor for optimization of the evaluation function. The most effective factor has the largest main effect difference (MED) amongst the levels of a single factor.
Figure5displays top 20 DNASDs when ranked in order of decreasing MED value. The MED values of the first two and four features exceed 30 when applied to the HPL and DPL datasets, respectively. The two features with the maximum MED values are𝐷𝐷(A, 1st) and𝐷𝐷(T, 1st), which are two distributions of the global description, respectively (Supplementary Table S3). Specifically, the 𝐷𝐷(A, 1st) has the highest MED value of 93.1, meaning that the length of nucleotide A at the first position of the sequences can be used to distinguish promoters from nonpromoters in the human species. This result is consistent with the first if-then rule, R1-p (Table7).
As for the four features with the MED values exceeding 30, they are the descriptors of the physicochemical properties (𝐷AM, 𝐷MW, and 𝐷MAC) and 𝐷C4(AAGT), revealing that
the three physicochemical properties of absorption maxima, molecular weight, and molar absorption coefficient can be used to distinguish promoters from nonpromoters in the
Drosophila specie. The 𝐷C4(AAGT), a descriptor of the AAGT motif, has the fourth highest MED value of 31.5; however, it only has a score of 73 and a rank of 41, as shown in Table4, revealing that DNASDmining can consider the internal correlation within relevant features rather than
Table 7: The rule-based knowledge of promoter prediction in human and Drosophila species.
Species Rule-based knowledge CF Rules Accuracy
(Human)
R1-p: If𝐷𝐷(A, 1st)> 0.0177542 Then Promoter 0.928 1 50.0%
R2-n: If𝐷𝐷(A, 1st)≤ 0.0177542 Then Non-promoter 0.999 1-2 96.2%
R3-n: If𝐷MW> 0.284657 and 𝐷𝐷(A, 1st)≤ 0.0950018 and 𝐷𝐷(C, 100%)≤ 0.929016 Then Non-promoter 0.985 1–3 99.5% R4-n: If𝐷C4(GCTC)> 0.0634629 and 𝐷MW> 0.284657 and 𝐷𝐷(A, 1st)≤ 0.0950018 Then Non-promoter 0.974 (Drosophila) R1-p: If𝐷MW≤ 0.280113 and 𝐷AM> 0.27604 Then Promoter 0.997 1 50.0% R2-n: If𝐷AM≤ 0.27604 Then Non-promoter 0.999 1-2 84.7% R3-n: If𝐷MW> 0.280113 Then Non-promoter 0.997 0 10 20 30 40 50 60 70 80 90 100 1 2 3 4 5 6 7 8 9 10 11 12 13 14 15 16 17 18 19 20 DNASD features MED val ue (%) HPL DPL
Figure 5: Top 20 DNASDs, which are ranked by MED values, for human and Drosophila training datasets. The MED values of the first two and four features exceed 30 when performing HPL and DPL datasets, respectively.
individual features using an efficient global optimization [45]. The transition descriptor𝐷𝑇(C, G) of the occurrence frequency of CG or GC has the fifth highest MED value of 26.6. This analytical result agrees with those obtained in other studies in [4,19,22,23], which have found that GC content is effective in identifying promoter regions.
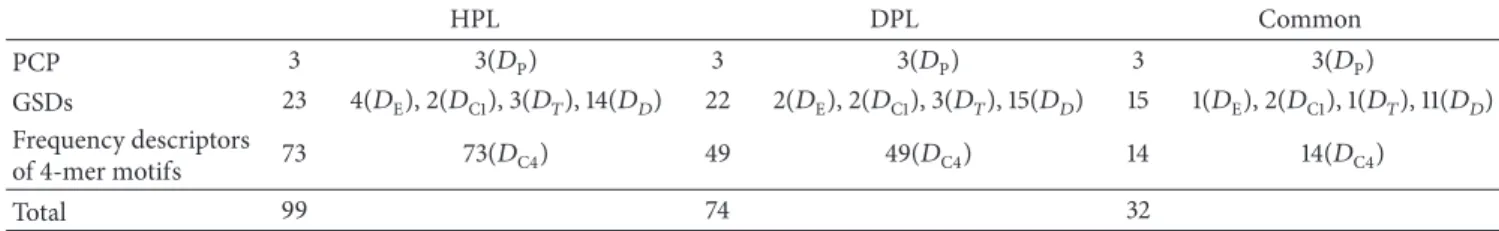
Supplementary Table S3 ranks all of the 𝑚 = 99 informative DNASDs by MED value. They consist of three descriptors of physicochemical properties, four EDP tors, two composition descriptors, three transition descrip-tors, 14 distribution descripdescrip-tors, and 73 4-mer frequency descriptors, denoted as 3(𝐷P), 4(𝐷E), 2(𝐷C1), 3(𝐷𝑇), 14(𝐷𝐷),
and 73(𝐷C4), respectively, (see Table8), where the abbrevia-tions𝐷P,𝐷C1,𝐷C4,𝐷E,𝐷𝐷, and𝐷𝑇represent the descriptors
of the physicochemical property of nucleotides, the 1-mer motif, the 4-mer motif, EDP, distribution, and transition, respectively. On the other hand, the subset of 𝑚 = 74 DNASDs comprises 3(𝐷P), 2(𝐷E), 2(𝐷C1), 3(𝐷𝑇), 15(𝐷𝐷),
and 49(𝐷C4), shown in Table7. Supplementary Table S4 ranks
all of the 74 informative DNASDs by MED value.
3.6. Common DNASDs in Human and Drosophila Species.
The percentages of common DNASDs in the two identified feature subsets are 32%(= 32/99) and 43% (= 32/74). The 32 common DNASDs, as shown in Table8, comprise three descriptors of physicochemical properties, one EDP descrip-tor, two composition descriptors, one transition descripdescrip-tor, 11 distribution descriptors, and 14 descriptors of 4-mer motifs, denoted as 3(𝐷P), 1(𝐷E), 2(𝐷C1), 1(𝐷𝑇), 11(𝐷𝐷), and 14(𝐷C4),
respectively
All of the three descriptors of physicochemical properties, 𝐷AM, 𝐷MW, and 𝐷MAC, are ranked the first, second, and
third for DPL and ranked the 5th, 6th, and 10th for HPL, respectively, consistent with the interpretation of if-then rules in Table7. When the three descriptors of physicochemical properties are excluded, PromHD with the remaining 96(= 99 − 3) and 71(= 74 − 3) DNASD features yields test accuracies of 94.4% and 95.5% in human and Drosophila test datasets, respectively. The prediction accuracies fall by 2.0% (= 96.4% − 94.4% and = 97.5% − 95.5%), reconfirming the three physicochemical properties are obviously effective in distinguishing promoters from nonpromoters in human and
Drosophila species.
The one EDP descriptor𝐷EGis ranked the 13th and 32th
for DPL and HPL, respectively, as shown in Supplementary Tables S3 and S4. The two compositions that are related to nucleotide A and G, denoted as 𝐷C1(A) and 𝐷C1(G),
clearly contribute to promoter prediction, consistent with the findings of Wang et al. and Zhao et al. [22,23]. The one tran-sition descriptor𝐷𝑇(G, T) that characterizes the frequency of occurrence of two nucleotides GT or TG is ranked the 84th and 23th for human and Drosophila species, respectively. Among the 11 common distribution descriptors,𝐷𝐷(A, 1st), 𝐷𝐷(T, 1st), and𝐷𝐷(G, 1st) are ranked the first, second, and third for the human species but the 46th, 20th, and 27th for Drosophila species, respectively. Two of the 14 common
Table 8: Distribution of the extracted DNASDs. HPL DPL Common PCP 3 3(𝐷P) 3 3(𝐷P) 3 3(𝐷P) GSDs 23 4(𝐷E), 2(𝐷C1), 3(𝐷𝑇), 14(𝐷𝐷) 22 2(𝐷E), 2(𝐷C1), 3(𝐷𝑇), 15(𝐷𝐷) 15 1(𝐷E), 2(𝐷C1), 1(𝐷𝑇), 11(𝐷𝐷) Frequency descriptors of 4-mer motifs 73 73(𝐷C4) 49 49(𝐷C4) 14 14(𝐷C4) Total 99 74 32
The abbreviations𝐷P,𝐷C1,𝐷C4,𝐷E,𝐷𝐷, and𝐷𝑇represent the descriptors of physicochemical property (PCP) and the global sequence descriptors (GSDs) of
1-mer motif, 4-mer motif, EDP, distribution, and transition, respectively.
descriptors of 4-mer motifs,𝐷C4(GAGC) and𝐷C4(GAAG), not only have high scores of 592 and 699, respectively, but are also identified by PromHD to be informative DNASDs as can be seen by comparing Tables4, S3, and S4. Although the ranks of these common 32 DNASDs largely differ between human and Drosophila species, they form the six clusters of 𝐷P,𝐷E,𝐷C1,𝐷𝑇,𝐷𝐷, and𝐷C4. The scenarios reveal that the
six clusters are all useful for distinguishing promoters from nonpromoters in human and Drosophila species.
4. Conclusions
Promoter prediction is an important problem in elucidating the regulation of gene expression. Therefore, the development of a well-characterized promoter system is vital for syn-thetic biology applications. This proposed PromHD method presents a reference feature set of 167 DNASDs, utilizes a feature mining algorithm to select a feature subset of infor-mative DNASDs, and acquires rule-based knowledge based on the selected feature subset. The mining algorithm using an optimization approach to feature selection identifies the most informative and discriminating DNASDs among human and
Drosophila species. The top-ranked rules reveal that the
global sequence descriptor, the length of nucleotide A at the first position of the sequence, and two physicochemical prop-erties, absorption maxima and molecular weight, are efficient in distinguishing promoters from nonpromoters in human and Drosophila species, respectively. Additionally, this work analyzes the contributions of a feature set of DNA sequence descriptors to the promoter prediction using the MED values. The three physicochemical properties of absorption maxima, molecular weight, and molar absorption coefficient have high MED values, meaning the three properties are clearly useful in distinguishing promoters from nonpromoters in human and Drosophila species. Future work on PromHD will develop a well-characterized promoter system for synthetic biology applications. Moreover, we believe that this proposed method will also be effective in designing prediction methods for other DNA sequence-based applications. The promoter pre-diction system by using PromHD has been implemented at http://iclab.life.nctu.edu.tw/promhd. All used datasets were given in the website.
Conflict of Interests
The authors declare no conflict of interests.
Authors’ Contribution
Wen-Lin Huang (WLH) designed the system and carried out the detail study. Chun-Wei Tung and Chyn Liaw designed the system and implemented programs. Hui-Ling Huang carried out the detail study. WLH and Shinn-Ying Ho (SYH) conceived the idea of this study and wrote the paper. In addition, SYH supervised the whole project. All authors have read and approved the final paper.
Acknowledgments
This work was supported by the National Science Council of Taiwan under the Contract no. NSC-102-2627-B-009-003, NSC-102-2221-E-243-002 and “Center for Bioinformat-ics Research of Aiming for the Top University Program” of the National Chiao Tung University and Ministry of Education, Taiwan, for the Project 102W962. This work was also supported in part by the UST-UCSD International Center of Excellence in Advanced Bioengineering sponsored by the Taiwan National Science Council I-RiCE Program under Grant no.: NSC-101-2911-I-009-101.
References
[1] J. Bradley, D. Johnson, and D. Rubenstein, Lecture Notes on
Molecular Medicine, Blackwell Science, London, UK, 2005.
[2] M. M. Yin and J. T. L. Wang, “GeneScout: a data mining system for predicting vertebrate genes in genomic DNA sequences,”
Information Sciences, vol. 163, no. 1–3, pp. 201–218, 2004.
[3] J. Zeng, S. Zhu, and H. Yan, “Towards accurate human promoter recognition: a review of currently used sequence features and classification methods,” Briefings in Bioinformatics, vol. 10, pp. 498–508, 2009.
[4] V. Rangannan and M. Bansal, “High-quality annotation of promoter regions for 913 bacterial genomes,” Bioinformatics, vol. 26, no. 24, pp. 3043–3050, 2010.
[5] M. Scherf, A. Klingenhoff, and T. Werner, “Highly specific localization of promoter regions in large genomic sequences by PromoterInspector: a novel context analysis approach,” Journal
of Molecular Biology, vol. 297, no. 3, pp. 599–606, 2000.
[6] J.-Y. Yang, Y. Zhou, Z.-G. Yu, V. Anh, and L.-Q. Zhou, “Human Pol II promoter recognition based on primary sequences and free energy of dinucleotides,” BMC Bioinformatics, vol. 9, article 113, 2008.
[7] K. Song, “Recognition of prokaryotic promoters based on a novel variable-window Z-curve method,” Nucleic Acids
[8] X. Xie, S. Wu, K.-M. Lam, and H. Yan, “PromoterExplorer: an effective promoter identification method based on the AdaBoost algorithm,” Bioinformatics, vol. 22, no. 22, pp. 2722– 2728, 2006.
[9] J. Wang and S. Hannenhalli, “A mammalian promoter model links cis elements to genetic networks,” Biochemical and
Bio-physical Research Communications, vol. 347, no. 1, pp. 166–177,
2006.
[10] S. Wu, X. Xie, A. W.-C. Liew, and H. Yan, “Eukaryotic promoter prediction based on relative entropy and positional informa-tion,” Physical Review E, vol. 75, no. 4, Article ID 041908, 2007. [11] N. I. Gershenzon and I. P. Ioshikhes, “Synergy of human
Pol II core promoter elements revealed by statistical sequence analysis,” Bioinformatics, vol. 21, no. 8, pp. 1295–1300, 2005. [12] V. B. Bajic and V. Brusic, “Computational detection of vertebrate
RNA polymerase II promoters,” in Rna Polymerases and
Asso-ciated Factors, pp. 237–250, Academic Press, San Diego, Calif,
USA, 2003.
[13] M. Hackenberg, C. Previti, P. L. Luque-Escamilla, P. Carpena, J. Mart´ınez-Aroza, and J. L. Oliver, “CpGcluster: a distance-based algorithm for CpG-island detection,” BMC Bioinformatics, vol. 7, article 446, 2006.
[14] L. Ponger and D. Mouchiroud, “CpGProD: identifying CpG islands associated with transcription start sites in large genomic mammalian sequences,” Bioinformatics, vol. 18, no. 4, pp. 631– 633, 2002.
[15] V. B. Bajic, S. H. Seah, A. Chong, G. Zhang, J. L. Y. Koh, and V. Brusic, “Dragon promoter finder: recognition of vertebrate RNA polymerase II promoters,” Bioinformatics, vol. 18, no. 1, pp. 198–199, 2002.
[16] S. Sonnenburg, A. Zien, and G. R¨atsch, “ARTS: accurate recognition of transcription starts in human,” Bioinformatics, vol. 22, no. 14, pp. e472–e480, 2006.
[17] NNP 2.2,http://www.fruitfly.org/seq tools/promoter.html. [18] R. V. Davuluri, I. Grosse, and M. Q. Zhang, “Computational
identification of promoters and first exons in the human genome,” Nature Genetics, vol. 29, no. 3, pp. 412–417, 2002. [19] S. Knudsen, “Promoter2.0: for the recognition of PolII promoter
sequences,” Bioinformatics, vol. 15, no. 5, pp. 356–361, 1999. [20] M. Q. Zhang, “Identification of human gene core promoters in
silico,” Genome Research, vol. 8, no. 3, pp. 319–326, 1998. [21] C. Y. Lim, B. Santoso, T. Boulay, E. Dong, U. Ohler, and J.
T. Kadonaga, “The MTE, a new core promoter element for transcription by RNA poymerase II,” Genes and Development, vol. 18, no. 13, pp. 1606–1617, 2004.
[22] X. Wang, Z. Xuan, X. Zhao, Y. Li, and M. Q. Zhang, “High-resolution human core-promoter prediction with CoreBoost-HM,” Genome Research, vol. 19, no. 2, pp. 266–275, 2009. [23] X. Zhao, Z. Xuan, and M. Q. Zhang, “Boosting with stumps for
predicting transcription start sites,” Genome Biology, vol. 8, no. 2, article R17, 2007.
[24] J. W. Fickett and A. G. Hatzigeorgiou, “Eukaryotic promoter recognition,” Genome Research, vol. 7, no. 9, pp. 861–878, 1997. [25] W. Deng and S. G. E. Roberts, “A core promoter element
downstream of the TATA box that is recognized by TFIIB,”
Genes and Development, vol. 19, no. 20, pp. 2418–2423, 2005.
[26] K. Florquin, Y. Saeys, S. Degroeve, P. Rouz´e, and Y. van de Peer, “Large-scale structural analysis of the core promoter in mammalian and plant genomes,” Nucleic Acids Research, vol. 33, no. 13, pp. 4255–4264, 2005.
[27] S. P. Pandey and A. Krishnamachari, “Computational analysis of plant RNA Pol-II promoters,” BioSystems, vol. 83, no. 1, pp. 38–50, 2006.
[28] T. Abeel, Y. Saeys, E. Bonnet, P. Rouz´e, and Y. van de Peer, “Generic eukaryotic core promoter prediction using structural features of DNA,” Genome Research, vol. 18, no. 2, pp. 310–323, 2008.
[29] U. Ohler, H. Niemann, G.-C. Liao, and G. M. Rubin, “Joint modeling of DNA sequence and physical properties to improve eukaryotic promoter recognition,” Bioinformatics, vol. 17, no. 1, pp. S199–S206, 2001.
[30] T. Abeel, Y. Saeys, P. Rouz´e, and Y. van de Peer, “ProSOM: core promoter prediction based on unsupervised clustering of DNA physical profiles,” Bioinformatics, vol. 24, no. 13, pp. i24–i31, 2008.
[31] P. S. Ho, G. Zhou, and L. B. Clark, “Polarized electronic spectra of Z-DNA single crystals,” Biopolymers, vol. 30, no. 1-2, pp. 151– 163, 1990.
[32] J. A. Greenbaum, B. Pang, and T. D. Tullius, “Construction of a genome-scale structural map at single-nucleotide resolution,”
Genome Research, vol. 17, no. 6, pp. 947–953, 2007.
[33] K.-J. Won, I. Chepelev, B. Ren, and W. Wang, “Prediction of regulatory elements in mammalian genomes using chromatin signatures,” BMC Bioinformatics, vol. 9, article 547, 2008. [34] T. A. Down and T. J. P. Hubbard, “Computational detection
and location of transcription start sites in mammalian genomic DNA,” Genome Research, vol. 12, no. 3, pp. 458–461, 2002. [35] I. A. Shahmuradov, V. V. Solovyev, and A. J.
Gammer-man, “Plant promoter prediction with confidence estimation,”
Nucleic Acids Research, vol. 33, no. 3, pp. 1069–1076, 2005.
[36] L. R. Cardon and G. D. Stormo, “Expectation maximization algorithm for identifying protein-binding sites with variable lengths from unaligned DNA fragments,” Journal of Molecular
Biology, vol. 223, no. 1, pp. 159–170, 1992.
[37] M. G. Reese, “Application of a time-delay neural network to promoter annotation in the Drosophila melanogaster genome,”
Computers and Chemistry, vol. 26, no. 1, pp. 51–56, 2001.
[38] R. Gangal and P. Sharma, “Human pol II promoter prediction: time series descriptors and machine learning,” Nucleic Acids
Research, vol. 33, no. 4, pp. 1332–1336, 2005.
[39] F. Anwar, S. M. Baker, T. Jabid et al., “Pol II promoter pre-diction using characteristic 4-mer motifs: a machine learning approach,” BMC Bioinformatics, vol. 9, article 414, 2008. [40] K. Polat and S. G¨unes¸, “A new method to forecast of Escherichia
coli promoter gene sequences: Integrating feature selection and Fuzzy-AIRS classifier system,” Expert Systems with Applications, vol. 36, no. 1, pp. 57–64, 2009.
[41] Y. Gan, J. Guan, and S. Zhou, “A comparison study on feature selection of DNA structural properties for promoter predic-tion,” BMC Bioinformatics, vol. 13, no. 1, article 4, 2012. [42] W.-L. Huang, C.-W. Tung, and S.-Y. Ho, “Human Pol II
promoter prediction by using nucleotide property composition features,” in Proceedings of the International Symposium on
Biocomputing (ISB ’10), ACM, New York, NY, USA, Kerala,
India, February 2010.
[43] Nucleotide properties, http://www.geneinfinity.org/sp/sp dnaprop.html.
[44] D. Onidas, D. Markovitsi, S. Marguet, A. Sharonov, and T. Gustavsson, “Fluorescence properties of DNA nucleosides and nucleotides: a refined steady-state and femtosecond investiga-tion,” The Journal of Physical Chemistry B, vol. 106, no. 43, pp. 11367–11374, 2002.
[45] H.-L. Huang, I.-C. Lin, Y.-F. Liou et al., “Predicting and analyzing DNA-binding domains using a systematic approach to identifying a set of informative physicochemical and bio-chemical properties,” BMC Bioinformatics, vol. 12, no. 1, article S47, 2011.
[46] W. L. Huang, “Ranking gene ontology terms for predicting non-classical secretory proteins in eukaryotes and prokaryotes,”
Journal of Theoretical Biology, vol. 312, pp. 105–113, 2012.
[47] S.-Y. Ho, J.-H. Chen, and M.-H. Huang, “Inheritable genetic algorithm for biobjective 0/1 combinatorial optimization prob-lems and its applications,” IEEE Transactions on Systems, Man,
and Cybernetics B, vol. 34, no. 1, pp. 609–620, 2004.
[48] W.-L. Huang, C.-W. Tung, S.-W. Ho, S.-F. Hwang, and S.-Y. Ho, “ProLoc-GO: utilizing informative gene ontology terms for sequence-based prediction of protein subcellular localization,”
BMC Bioinformatics, vol. 9, article 80, 2008.
[49] R. Dreos, G. Ambrosini, R. Cavin P´erier, and P. Bucher, “EPD and EPD new, high-quality promoter resources in the next-generation sequencing era,” Nucleic Acids Research, vol. 41, pp. D157–D164, 2013.
[50] J. R. Quinlan, “C5.0 online tutorial,” 2003,http://www.rulequest .com.
[51] U. Ohler, H. Niemann, G.-C. Liao, and G. M. Rubin, “Joint modeling of DNA sequence and physical properties to improve eukaryotic promoter recognition,” Bioinformatics, vol. 17, no. 1, pp. S199–S206, 2001.
[52] S. S. Gross and M. R. Brent, “Using multiple alignments to improve gene prediction,” in Proceedings of the 9th Annual
International Conference on Research in Computational Molec-ular Biology (RECOMB ’05), pp. 379–393, Mary Ann Liebert,
Cambridge, Mass, USA, 2005.
[53] V. Rangannan and M. Bansal, “High-quality annotation of promoter regions for 913 bacterial genomes,” Bioinformatics, vol. 26, no. 24, pp. 3043–3050, 2010.
[54] M. Scherf, A. Klingenhoff, K. Frech et al., “First pass annotation of promoters on human chromosome 22,” Genome Research, vol. 11, no. 3, pp. 333–340, 2001.
[55] D. S. Prestridge, “Predicting Pol II promoter sequences using transcription factor binding sites,” Journal of Molecular Biology, vol. 249, no. 5, pp. 923–932, 1995.
[56] TSSW,http://linux1.softberry.com/berry.phtml.
[57] S. Varma and R. Simon, “Bias in error estimation when using cross-validation for model selection,” BMC Bioinformatics, vol. 7, article 91, 2006.
[58] D. Restrepo-Montoya, C. Pino, L. F. Nino, M. E. Patarroyo, and M. A. Patarroyo, “NClassG+: a classifier for non-classically secreted Gram-positive bacterial proteins,” BMC
Bioinformat-ics, vol. 12, article 21, 2011.
[59] W.-L. Huang, C.-W. Tung, H.-L. Huang, F. Hwang, and S.-Y. Ho, “ProLoc: prediction of protein subnuclear localization using SVM with automatic selection from physicochemical composition features,” BioSystems, vol. 90, no. 2, pp. 573–581, 2007.
[60] Z. Zhang, S. Kochhar, and M. G. Grigorov, “Descriptor-based protein remote homology identification,” Protein Science, vol. 14, no. 2, pp. 431–444, 2005.
[61] S.-Y. Ho, L.-S. Shu, and J.-H. Chen, “Intelligent evolutionary algorithms for large parameter optimization problems,” IEEE
Transactions on Evolutionary Computation, vol. 8, no. 6, pp.
522–541, 2004.
[62] C. C. Chang and C. J. Lin, “LIBSVM : a library for support vector machines,” 2001,http://www.csie.ntu.edu.tw/∼cjlin/libsvm. [63] K.-C. Chou and C.-T. Zhang, “Prediction of protein structural
classes,” Critical Reviews in Biochemistry and Molecular Biology, vol. 30, no. 4, pp. 275–349, 1995.
[64] K.-C. Chou, “Some remarks on protein attribute prediction and pseudo amino acid composition,” Journal of Theoretical Biology, vol. 273, no. 1, pp. 236–247, 2011.
[65] C.-H. Su, N. R. Pal, K.-L. Lin, and I.-F. Chung, “Identification of amino acid propensities that are strong determinants of linear B-cell epitope using neural networks,” PLoS ONE, vol. 7, no. 2, Article ID e30617, 2012.
[66] V. B. Bajic, L. T. Sin, Y. Suzuki, and S. Sugano, “Promoter prediction analysis on the whole human genome,” Nature
Biotechnology, vol. 22, no. 11, pp. 1467–1473, 2004.
[67] B. W. Matthews, “Comparison of the predicted and observed secondary structure of T4 phage lysozyme,” Biochimica et
Biophysica Acta, vol. 405, no. 2, pp. 442–451, 1975.
[68] T. Li, C. Zhang, and M. Ogihara, “A comparative study of feature selection and multiclass classfication methods for tissue classification based on gene expression,” Bioinformatics, vol. 20, no. 15, pp. 2429–2437, 2004.
Submit your manuscripts at
http://www.hindawi.com
Hindawi Publishing Corporation
http://www.hindawi.com Volume 2014
Anatomy
Research International
Peptides
Hindawi Publishing Corporation
http://www.hindawi.com Volume 2014
Hindawi Publishing Corporation http://www.hindawi.com
International Journal of
Volume 2014
Zoology
Hindawi Publishing Corporation
http://www.hindawi.com Volume 2014
Molecular Biology International
Hindawi Publishing Corporation
http://www.hindawi.com Volume 2014
The Scientific
World Journal
Hindawi Publishing Corporationhttp://www.hindawi.com Volume 2014
Hindawi Publishing Corporation
http://www.hindawi.com Volume 2014
Bioinformatics
Advances inMarine Biology
Journal ofHindawi Publishing Corporation
http://www.hindawi.com Volume 2014
Hindawi Publishing Corporation
http://www.hindawi.com Volume 2014
Signal Transduction
Journal ofHindawi Publishing Corporation
http://www.hindawi.com Volume 2014
BioMed
Research International
Evolutionary Biology International Journal of Hindawi Publishing Corporation
http://www.hindawi.com Volume 2014
Hindawi Publishing Corporation
http://www.hindawi.com Volume 2014 Biochemistry Research International
Archaea
Hindawi Publishing Corporation
http://www.hindawi.com Volume 2014
Hindawi Publishing Corporation
http://www.hindawi.com Volume 2014
Genetics
Research International
Hindawi Publishing Corporation
http://www.hindawi.com Volume 2014 Advances in
Virology
Hindawi Publishing Corporation http://www.hindawi.com
Nucleic Acids
Journal ofVolume 2014
Stem Cells
International
Hindawi Publishing Corporation
http://www.hindawi.com Volume 2014
Hindawi Publishing Corporation
http://www.hindawi.com Volume 2014
Enzyme
Research
Hindawi Publishing Corporation
http://www.hindawi.com Volume 2014
International Journal of