Vacuum measurement using total-internal-reflection heterodyne
interferometry
Ming-Horng Chiu
a, Ju-Yi Lee
b, Der-Chin Su
b,*, King-Hung Lee
caDepartment of Electric Engineering, Chien Hsin College of Technology and Commerce, 229 Chien Hsin Road, Chung-Li, 320, Taiwan, Republic of China
bInstitute of Electro-Optical Engineering, National Chiao Tung University, 1001 Ta-Hsueh Road, Hsin-Chu, 300, Taiwan, Republic of China cCenter for Measurement Standards, Industrial Technology Research Institute, Bldg.16, 321 Kuang Fu Road, Sec.2, Hsin-Chu,
Taiwan 30042, Republic of China Received 4 January 1999; accepted 3 May 1999
Abstract
Based on the effect that the phase difference between s- and p-polarizations at the total-internal-reflection is changed with the variation of the air refractive index, which is related to the air pressure, a new optical method for measuring the air pressure of a vacuum cavity is proposed. From the experimental curve of the phase difference variation measured by the heterodyne interferometry and the calibrated pressure measurement of a vacuum cavity, an empirical formula is derived. With this empirical formula, the measurable range of this new optical method is 760 to 0.1 torr. © 1999 Elsevier Science Inc. All rights reserved.
Keywords: Vacuum measurement; Total-internal-reflection; Heterodyne interferometry
1. Introduction
There are several vacuum gauges for measuring the air pressure of a vacuum cavity, for instance, the McLeod gauge [1], the ionization gauge, the spinning rotor gas friction gauge [2], and the thermal conductivity gauge [3]. These are not optical methods. From Edlen’s equation [4], it is possible to see that the air REFractive index relates to its pressure. In this paper, we propose a new optical method for vacuum measurement based on the effect that the phase difference between s- and p-polarizations at the total-inter-nal-reflection changes as the air refractive index changes. We measure an experimental curve of the phase difference variation as a function of the air pressure of a vacuum cavity with the heterodyne interferometry. Then, an empirical for-mula for the relationship of the calibrated air pressure and the phase difference variation is derived by using a polyno-mial fitting technique. With the aid of this empirical for-mula, the new optical method is suitable for the vacuum range between 760 and 0.1 torr.
2. Principle
2.1. The relationship between the pressure and the refractive index of air
According to the modification of Edlen’s equation by Brich and Downs [5], we have
共n ⫺ 1兲T,P⫽ P䡠 共n ⫺ 1兲s 96095.43 ⫻关1 ⫹ 10⫺8共1 ⫹ 0.0036610T兲共0.601 ⫺ 0.00972T兲 䡠 P兴, (1) where
(n⫺ 1)T,P ⫽ the refractive index difference at
temperature T(°C) and pressure
P(Pa);
(n ⫺ 1)s ⫽ the refractive index difference at
15°C and 1 atm; and [(n⫺ 1)s ⫻ 10
8
] ⫽ 8343.05 ⫹ 2406294 ⫻ (130 ⫺
2
)⫺1⫹ 15999 ⫻ (38.9 ⫺2)⫺1. * Corresponding author. Tel.: 5731951; fax:
⫹886-3-57116631.
E-mail address: [email protected] (D.-C. Su)
Precision Engineering 23 (1999) 260 –263
0141-6359/99/$ – see front matter © 1999 Elsevier Science Inc. All rights reserved. PII: S 0 1 4 1 - 6 3 5 9 ( 9 9 ) 0 0 0 1 9 - 7
where ⫽ 1/ (1/m), and is the wavelength of a light source. If is at 0.633 m, T is at 20°C, and the unit of pressure is torr, then Eq. (1) can be rewritten as [Eq. (2)]
共n ⫺ 1兲P⫽
P䡠 共n ⫺ 1兲s
720.788
⫻关1 ⫹ 10⫺6共1 ⫹ 0.0036610T兲共0.8012 ⫺ 0.01296T兲 P兴
⫽␣ 䡠 P, (2)
where␣ ⫽ 3.574983 ⫻ 10⫺7. From Eq. (2), we can get [Eq. (3)]
⌬n ⫽␣ 䡠 ⌬P. (3) Obviously, the variation of the refractive index of air⌬n is proportional to the variation of air pressure⌬P.
2.2. The phase difference variation resulted from the variation of the air pressure
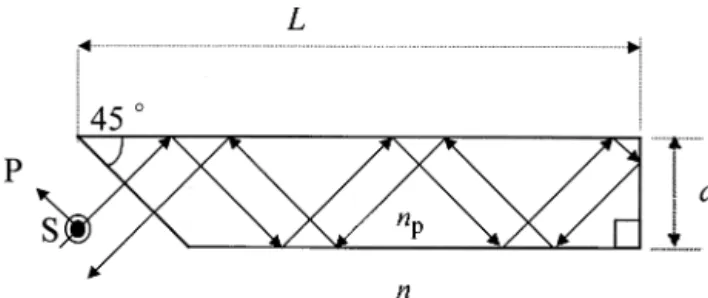
The structure of a special designed vacuum probe is shown Fig. 1. It is made of glass with refractive index np,
and its base angle, length and thickness are 45°, L and d, respectively. A light beam is incident normally on the oblique surface of the probe, and is guided within this probe because of the total-internal-reflections. After it is totally reflected at the other end of the probe, the light beam goes back in anti-parallel direction with the original path. The number of total-internal-reflections is m ⫽ 2 L/d. Hence, according to Fresnel’s equations [6], the phase difference between s- and p-polarizations due to multiple total-inter-nal-reflections is
⫽ 2m 䡠 tan⫺1兵关1 ⫺ 2共n/n
p兲
2兴1/ 2其,
(4) where n is the refractive index of air. From Eq. (4), we have
⌬ ⫽ ⫺2m n/np 关1 ⫺ 共n/np兲2兴关1 ⫺ 2共n/np兲2兴1/ 2 ⌬n np
兩
n⫽1 ⫽共n ⫺2m 䡠 ⌬n p 2⫺ 1兲共1 ⫺ 2/n p 2兲1/ 2, (5)where⌬ and ⌬n are the variations of the phase difference and the refractive index of air at constant np. Substituting
Eq. (5) into Eq. (3), we can get [Eq. (6)]
⌬P ⫽ ⫺共np 2⫺ 1兲共n p 2⫺ 2兲1/ 2 2m䡠␣ 䡠 np ⌬. (6) Let the specially designed vacuum probe be located inside a cavity to measure the pressure variation⌬P. If the initial pressure of the cavity is P0, then after vacuum
pump-ing the pressure P can be written as
P⫽ P0⫺ ⌬P ⫽ P0⫺ 共np 2⫺ 1兲共n p 2⫺ 2兲1/ 2 2m䡠␣ 䡠 np ⌬. (7)
From Eq. (7) one can see that P can be calculated with the measurement of the phase difference ⌬ under the
Fig. 1. The optical path in the vacuum probe.
Fig. 2. Schematic diagram for measuring the air pressure of a vacuum cavity: BS⫽ beam-splitter; AN ⫽ analyzer; D ⫽ photodetector; PM ⫽ phase meter. 261 M.-H. Chiu et al. / Precision Engineering 23 (1999) 260 –263
experimental conditions in which P0, np, and m are
speci-fied.
2.3. Phase difference variation measurements with the total-internal-reflection heterodyne interferometry
Chiu et al.[6] proposed a method for measuring the refractive index by using the total-internal-reflection het-erodyne interferometry. The schematic diagram of the optical arrangement of our method, which is based on a similar consideration, is shown in Fig. 2. For conve-nience, the ⫹z axis is chosen to be along the light propagation direction and the y axis is chosen to be along the direction perpendicular to the paper plane. A light coming from a heterodyne light source [7] having a frequency difference f between s- and p-polarizations is incident on a beam-splitter, BS, and is divided into two parts: the reflected light and the transmitted light. The reflected light passes through an analyzer ANr with the
transmission axis at 45° to the x-axis, then enters a photodetector Dr. The intensity measured by Dr can be
written as Eq. (8):
Ir⫽
1
2关1 ⫹ cos共t ⫺ r兲兴, (8) where Ir is the reference signal, and r is the phase
difference between s- and p-polarizations produced by the reflection at BS. On the other hand, the transmitted light is incident normally on the oblique surface of the vacuum probe which is located inside a vacuum cavity with an initial air pressure P0, and is guided by the probe
as shown in Fig. 1. After it is totally reflected at the other end of the probe, the light goes back in anti-parallel with the original path. Then, it is reflected again by BS and passes through an analyzer ANtwith the transmission axis
at 45° to the x-axis. Finally it is detected by another photodetector Dt. The intensity Itmeasured by Dtcan be
written as Eq. (9):
It⫽
1
2关1 ⫹ cos共t ⫺ ⫺ r兲兴. (9) The two signals, Ir and It, are sent to a phase meter, PM,
then the phase difference can be obtained. When the air pressure of the vacuum cavity changes to P, the measured phase difference variation is⌬. Substituting ⌬ into Eq. (7), the air pressure of the vacuum cavity is obtained.
3. Experiments and results
To test the performance of this new method, the air pressure of a vacuum cavity is measured with the optical setup shown in Fig.2. The heterodyne light source is at wavelength 632.8 nm and with a difference frequency 2 kHz between s- and p-polarizations. A phase meter with a
reso-lution 0.01° is self-made. The vacuum probe is made of BaSF2 glass with a refractive index 1.66059, and its dimen-sions are 103⫻ 10 ⫻ 5 mm. Hence there are 40 times of total-internal-reflection in the probe. To test the validity of this method, a vacuum gauge (GP307; Granville-Phillips, Boulder, Colorado, USA) is introduced to measure the air pressure simultaneously under the conditions: initial pres-sure (P0)⫽ 760 torr, temperature (T) ⫽ 20°C, and relative
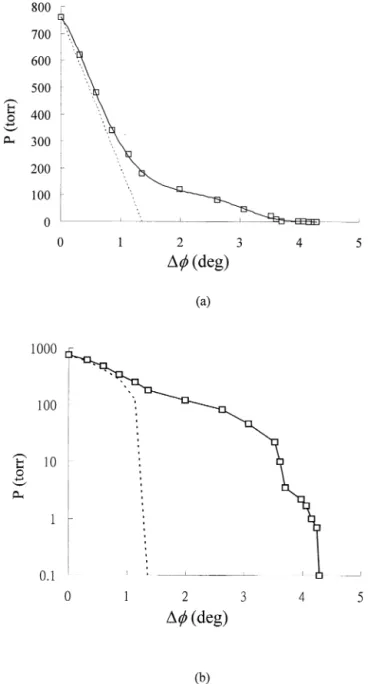
humidity (RH) ⫽ 50%. In our experiments, the vacuum pumping rate is so slow that the temperature T is almost kept at 20°C. The experimental curves of P versus⌬ are shown in Fig. 3, in which the ordinates are marked in (a) an ordinary scale and (b) a logarithmic scale. In these figures, the dashed curves represent the evaluated values, which are
Fig. 3. Theoretical and experimental curves of P versus⌬ under the conditions: P0⫽ 760 torr, T ⫽ 20°C, and RH ⫽ 50%. The ordinates are marked in (a) an ordinary scale, and (b) a logarithmic scale.
obtained by introducing the data of m,␣, np, and P0into Eq.
(7); the squares represent the direct readouts from the calibrated vacuum gauge GP307.
4. Discussion
From Fig. 3, once can see that the experimental curve is different from the theoretical curve, especially in the low pressure range. This discrepancy might be caused by:
1. Edlen’s equation might not be suitable for such low pressure range that it might need some corrections or 2. The refractive index of the vacuum probe might be
changed as the air pressure is decreased.
Although this discrepancy falls outside our expectation, the accuracy of the measurement in the low pressure range can be enhanced. By using a polynomial fitting technique, an empirical formula for the relation between the air pres-sure and the phase difference variation is derived as
P⫽ ⫺3.819共⌬兲6⫹ 55.868共⌬兲5⫺ 306.87共⌬兲4
⫹ 756.76共⌬兲3⫺ 691.6共⌬兲2⫺ 282.76共⌬兲
⫹ 759.65. (10)
If the vacuum cavity is measured with the same conditions, that is, P0⫽ 760 torr, T ⫽ 20°C, RH ⫽ 50%, the data of the
measured phase difference variation is substituted into Eq. (10) and the air pressure of the cavity can be obtained. This empirical formula may not be suitable for other conditions because the lowest pressure of our vacuum pump is 0.1 torr. Thus, this method is confirmed to be valid for the vacuum range between 760 and 0.1 torr.
5. Conclusion
In this article, a new optical method for measuring the air pressure of a vacuum cavity is proposed based on the total-internal-reflection heterodyne interferometry. The op-tical arrangment shown in Fig. 2 can be used as an opop-tical vacuum gauge. It is experimentally confirmed that under our initial conditions, it is convenient to obtain the air pressure of a vacuum cavity by substituting the measured data of the phase difference variation into Eq. (10). Because of its common-path configuration, it is stable against the environmental vibration and the air turbulence. The vacuum probe is small and inexpensive and does not pollute the vacuum cavity. The method has several merits, such as simple optical setup, easy operation, and high stability. In addition, it is suitable for the vacuum range between 760 and 0.1 torr.
References
[1] Redhead PA, Hobson JP, Kornelsen EV. General considerations of pressure measurement. The Physical Basis of Ultrahigh Vacuum. New York: American Institute of Physics, 1993. pp. 253–99.
[2] Delchar TA. Vacuum Physics and Techniques. London: Chapman & Hall, 1993.
[3] Leck JH. Total and Partial Pressure Measurement in Vacuum Systems. : Blackie & Son, 1989.
[4] Edlen B. The refractive index of air. Metrologia 1966;2:71– 80. [5] Birch KP, Downs MJ. An updated Edlen equation for the refractive
index of air. London: Metrologia 1993;30:155– 62.
[6] Chiu MH, Lee JY, Su DC. Refractive index measurement based on the effects of the total-internal-reflection and the uses of the heterodyne interferometry. J Appl Opt 1997;36:1936 –9.
[7] Su DC, Chiu MH, Chen CD. Simple two frequency laser. Prec Eng 1996;18: 161–3.
263 M.-H. Chiu et al. / Precision Engineering 23 (1999) 260 –263