IMRT with different PTV shrinkage margins
An-Cheng Shiaua兲
Department of Biomedical Imaging and Radiological Sciences, National Yang-Ming University; Department of Radiation Oncology, Far Eastern Memorial Hospital; and Department of Biomedical Imaging and Radiological Science, China Medical University, Taipei, 220 Taiwan
Pei-Ling Lai
Institute of Nuclear Engineering and Science, National Tsing Hua University, Taipei, 220 Taiwan Ji-An Liang
Department of Radiation Oncology, China Medical University Hospital and School of Medicine, China Medical University, Taichung City, 40447 Taiwan
Pei-Wei Shuengb兲
Department of Radiation Oncology, Far Eastern Memorial Hospital and Department of Radiation Oncology, Tri-Service General Hospital, National Defense Medical Center, Taipei, 220 Taiwan Wei-Li Chen and Wei-Peng Kuan
Department of Biomedical Imaging and Radiological Sciences, National Yang-Ming University, Taipei, 112 Taiwan
共Received 14 July 2010; revised 5 January 2011; accepted for publication 20 January 2011; published 18 February 2011兲
Purpose: Dosimetric uncertainty in the surface and superficial regions is still a major concern for
radiation therapy and becomes more important when using the inverse planning algorithm for IMRT. The purpose of this study was to measure dose distributions and to evaluate the calculation accuracy in the superficial region for different planning target volume共PTV兲 shrinkage methods for head and neck IMRT plans.
Methods: A spherical polystyrene phantom 160 mm in diameter共ball phantom兲 was used to
simu-late the shape of the head. Strips of superflab bolus with thicknesses of 3.5 and 7.0 mm were spread on the surface of the ball phantom. Three sets of CT images were acquired for the ball phantom without and with the bolus. The hypothetical clinical target volume 共CTV兲 and critical structures 共spinal cord and parotid glands兲 were outlined on each set of CT images. The PTVs were initially created by expanding an isotropic 3 mm margin from the CTV and then margins of 0, 3, and 5 mm were shrunk from the phantom surface for dosimetric analysis. Seven-field IMRT plans with a prescribed dose of 180 cGy and same dose constraints were designed using an Eclipse treatment planning system. Superficial doses at depths of 0, 3.5, and 7.0 mm and at seven beam axis positions 共gantry angles of 0°, 30°, 60°, 80°, 330°, 300°, and 280°兲 were measured for each PTV shrinkage margin using 0.1 mm ultrathin thermoluminescent dosimeters. For each plan, the measured doses were compared to the calculated doses.
Results: The PTV without shrinkage had the highest intensity and the steepest dose gradient in the
superficial region. The mean measured doses for different positions at depths of 0, 3.5, and 7.0 mm were 106⫾18, 185⫾16, and 188⫾12 cGy, respectively. For a PTV with 3 mm shrinkage, the mean measured doses were 94⫾13, 183⫾8, and 191⫾8 cGy. For a PTV with 5 mm shrinkage, the mean measured doses were 86⫾11, 173⫾8, and 187⫾5 cGy. The comparisons indicated that more than 73.3% of the calculated points are with doses lower than the measured points and the difference of the dose becomes more significant in the shallower region. At 7.0 mm depth, the average difference between calculations and measurements was 2.5%共maximum 5.5%兲.
Conclusions: Application of the PTV shrinkage method should take into account the calculation
inaccuracy, tumor coverage, and possible skin reaction. When the tumor does not invade the su-perficial region, an adequate shrinkage margin from the surface is helpful for reducing the skin reaction. As the tumor invades the superficial region, adding a bolus is a method better than only contouring PTV with skin inclusion. © 2011 American Association of Physicists in Medicine. 关DOI:10.1118/1.3553406兴
Key words: intensity-modulated radiation therapy, dose in the buildup region, superficial dose, thermoluminescent dosimeter
I. INTRODUCTION
Dosimetric uncertainty in the surface and superficial regions is still a major concern for radiation therapy and becomes more important when using the inverse planning algorithm for intensity-modulated radiation therapy共IMRT兲. Adequate doses to near-skin tumors need to be delivered by a radio-therapy treatment regimen that minimizes the probability of tumor recurrence. In addition, appropriate skin doses need to be administered to avoid a skin reaction when the tumor does not invade the superficial region.
Two distinct reactions are observed in the skin following irradiation. An acute reaction is observed within days after irradiation and results from damage to the epidermis 共0.03– 0.3 mm thick兲. Late reactions occur months later, mediated through damage to the dermis 共1–3 mm thick兲.1 In clinical radiation therapy, most patients experience different degrees of skin reactions. Erythema is common after a skin dose of about 3000 cGy. Dry desquamation may appear after doses of about 4000 cGy to the skin. Moist desquamation occurs when doses to the skin exceed 5000 cGy.2Skin reactions can be painful and may require interrupting the treatment. Both the epidermis and dermis are in the superficial region, a re-gion with high dosimetric uncertainties.
Current treatment planning systems共TPSs兲 can accurately calculate doses for most treatment regions. However, due to the steep dose gradient and the complicated distributions of the contaminating electrons, the accuracy of dose calculation in the buildup region still needs to be verified. In forward planning, such as three-dimensional conformal radiation therapy 共3D-CRT兲, beams with uniform intensity are deliv-ered to targets. The superficial dose at a particular point for normal or oblique incidence can be calculated using the equation introduced by Gerbi et al.3 However, in inverse planning, such as IMRT, the complex and nonuniform beam intensities are created by a TPS optimization algorithm through an iteration process according to the dose constraints of the targets, critical organs, and other avoidance structures in the treatment region. Consequently, the contouring for tar-gets, critical organs, and other avoidance structures will sig-nificantly affect the dose distributions in an inverse planning process. In the case of contouring, inverse planning will give intensities incorrectly in order to satisfy the plan constraints in regions where the TPS cannot accurately calculate the dose. In this situation, it is difficult to modify these incorrect intensities manually. Ezzell et al.4 reported that if the TPS underestimates the superficial dose, the inverse planning al-gorithm will identify low doses in the buildup region and then increase the intensities incorrectly. These modulations may cause high doses to the superficial regions if the TPS underestimates the dose in the buildup region.
To avoid dose calculations in the high uncertainty regions, if the tumor is away from the surface, the planning target volume共PTV兲 is usually shrunk a few millimeters from the body surface. However, it is still not clear how the shrinkage margin affects the superficial dose and how large of a shrink-age margin is adequate for a head and neck IMRT planning. A larger margin will decrease the skin dose, but also
deterio-rate the target coverage. Therefore, it is important to inves-tigate how PTV shrinkage affects the surface and superficial doses and how accurate the TPS calculations are in the buildup region.
Lee et al.5used thermoluminescent dosimeters共TLDs兲 to measure the skin dose for extended-field IMRT head and neck cancer patients and discussed the skin reactions accord-ingly. They concluded that the use of different contouring methods including or excluding the surface would cause sig-nificant differences in the skin dose. However, the measure-ments at the surface were done for PTV shrinkage of 5 mm from the surface. They did not report data for other shrinkage margins or the dose differences in the buildup region be-tween calculations and measurements.
The sources of surface dose include the contamination radiation from machine head and air and backscattered radia-tion from patient. Previous studies have shown that the sur-face dose is predominantly contributed by collimator scat-tered electrons.6–8Most of the collimator scattered electrons come from the flattening filter and ion chambers.9 One rea-son that current TPSs do not provide accurate calculations in the buildup region is the difficulty in estimating low-energy contaminating electrons. Zhu and Palta10 have discussed the behaviors of contaminating electrons in detail. The accuracy of dose calculation can be improved by including the con-taminating electrons accurately.
Due to the steep dose gradient in the buildup region, the size of the dosimeter in the beam direction should be as small as possible. Quach et al.11compared measurements of superficial doses using different detectors, including radio-chromic film 共effective depth of 0.17 mm兲, TLD 共effective depth of 0.14 mm兲, and MOSFET 共effective depth of 0.5 mm兲. Their results indicated that a smaller effective depth of measurement can result in a more accurate measurement in the buildup region.
For the analysis of IMRT superficial dose, Dogan and Glasgow12 used a parallel-plate ion chamber and KODAK extended dose range共EDR2兲 film to measure the superficial dose for perpendicular and oblique incidence beams for IMRT and open fields. Their results showed that surface and superficial doses would not be increased in IMRT segmenta-tion planning. However, their study focused on the compari-son of a single field between IMRT and open fields. How the skin dose is affected in the optimization process was not discussed in their study. Chung et al.13 used two semicylin-drical solid water slabs to simulate head and neck treatments and used GafChromic films 共model HS with total thickness of 0.234 mm兲 for dose measurements. They found that Cor-vus and Pinnacle3 TPS overestimated the surface dose for both shallow and deep target cases. However, the shallow target in their study was 5 mm from the top surface of the phantom. Dosimetric analysis for PTV that included surface and different target outline methods were not included in their study.
In this study, we investigated the influence of PTV shrink-age margins on the surface and superficial doses and evalu-ated the accuracy of dose calculation in the buildup region for head and neck IMRT plans. Because skin reactions result
from damage to the epidermis or dermis, measurements at depths of 0, 3.5, and 7 mm were made in phantoms with extra-thin TLDs, with comparisons between the calculations and measurements performed.
II. METHODS AND MATERIALS II.A. Facilities and phantom
A Varian 21EX linear accelerator system共Palo Alto, CA兲 with a 6 MV photon beam and a Millennium 120 leaf MLC system was used in this study. An Eclipse planning system 共version 7.1兲 with 2.5 mm calculation grid size was used for every head and neck plan. A spherical polystyrene phantom 160 mm in diameter共ball phantom, Fig.1兲 provided with the Leksell Gamma Knife® system was used to simulate the shape of the head. Solid water phantoms 共Plastic Water®, CIRS, Norfolk, Virginia兲 were used for TLD calibrations.
II.B. TLD
A total of 70 TLDs 0.1 mm in thickness and 5 mm in diameter共GR200F, LiF:Mg, Cu, P Solid Dosimetric Detector & Method Laboratory, SANGE Technologies Inc. Beijing, China兲 was used for dose measurements. These TLDs were selected from a batch of more than 100 TLDs. The selection was based on the consistency of response. A REXON model UL-320 TLD reader 共TLD System Inc., Cleveland, Ohio兲 was used to record the TL counts from the TLDs. A constant nitrogen flow was maintained over the TLD when reading.
To monitor the stability of the TLD reader, readings from a stable LED reference light source were recorded in the be-ginning and every 30 min. The variations in readings from the reference light source were kept within 1.0% when the TLD reader was in use. For TLD selection, the batch of TLDs was irradiated with individual doses of 50, 100, and 200 cGy. After each irradiation, TLDs were read and a re-sponse factor共RF兲 for each TLD was calculated. The RF was defined as the ratio of the count of the individual TLD to the average count of the batch of TLDs. Statistical parameters of the RFs such as average, standard deviation共兲, and coeffi-cient of variation关共CV兲 in %, CV=1.96/average兴 were cal-culated for each TLD in each irradiation. An iterative process is used to remove the TLD with the highest CV共the greatest inconsistent response兲 from the batch, with the RFs and CVs calculated again until the CV of each TLD in the batch was ⬍5%. The RFs of each TLD were then used to correct the different responses for individual TLDs.
GR200F is composed of two layers. The upper layer is 5 mg/cm2 of the TLD powder uniformly adhered to a
PE-supported lower layer. The effective atomic number of GR200F is 8.2. The annealing procedure for GR200F can be completed in 10 min at 240 ° C. The properties of GR200F, high sensitivity, extremely high spatial resolution in depth dose measurement, and small fading effect, make it an ideal detector for dose measurement in the superficial regions.14
The accuracy of dose measurements with GR200F in the superficial regions was verified by comparing the percent depth dose 共PDD兲 of a 6 MV photon beam using a Markus plane-parallel ionization chamber共Victoreen/Nuclear Associ-ates共Fluke Biomedical Division of Fluke Electronics Corpo-ration, Everett, WA兲, PTW model 30-329兲 in a solid water phantom. An over-response in the buildup region for the Markus chamber was corrected according to the method sug-gested by Gerbi and Khan.15
A polyester envelope 0.075 mm thick was used to protect the TLDs from contamination. Based on the PDD of a 6 MV photon beam, the dose perturbations in normal incidence at depths of 0, 3, and 6 mm for the PE envelope were less than 2.1%, 0.6%, and 0.3%, respectively. Because beam inci-dences were from multiple angles in this study and the obliq-uity factors decreased sharply with depth,3the perturbations from the PE envelope were much less than in a single normal incidence. Thus, the perturbations from the PE envelope were ignored in this study.
II.C. Contours and plan information
TLDs were placed on the surface of the ball phantom for all measurements. In order to measure the doses at depths of about 3 and 6 mm, strips of superflab bolus with a rectangu-lar dimension of 24.5⫻4.8 cm and thicknesses of 3.48⫾0.31 and 6.96⫾0.16 mm were spread on the ball phantom surface to fully cover the positions of measurement. Three sets of CT images without and with the bolus on the ball phantom were taken. A boomerang shape of hypothetical clinical target volume共CTV兲 and critical structures, such as the spinal cord and parotid glands, were contoured for the set
(a)
(b)
FIG. 1. A spherical polystyrene phantom 160 mm in diameter was used.共a兲 TLDs were placed on phantom surface.共b兲 A strip of superflab bolus was placed on the phantom surface to fully cover the positions of measurement.
of CT images without bolus and copied to the others using fused images. The hypothetical CTV was contoured or modi-fied to fit a margin of 3 mm away from the surface for all sets of CT images 共Fig. 2兲. The PTVs were initially created by expanding an isotropic 3 mm margin from the CTV and then the margins of 0, 3, and 5 mm were shrunk from the surface for dosimetric analysis. As the PTV was shrunk 5 mm, the CTV was shrunk accordingly.
Seven-field IMRT plans with beam angles of 0°, 50°, 100°, 150°, 210°, 260°, and 310° were designed using an Eclipse TPS. Dynamic leaf sequencing共sliding window兲 was used for all IMRT plans. The prescribed dose共Dp兲 for PTVs was 180 cGy and the dose rate was maintained at 400 MU/ min. Identical optimization constraints were used and “no normalization” method was selected for any IMRT plan. Ac-cording to the RTOG0225 report,16 the constraints of maxi-mum and minimaxi-mum doses for CTV and PTV were 107% and 100%, respectively, of the Dp. The constraint of maximum dose for the nontarget area共the volume excluding PTV兲 was 103% of the Dp. The normal tissue constraints were 64% of the Dpfor the maximum spinal cord dose and no more than 50% of the parotid glands received over 40% of the Dp. Each plan was optimized for exactly 80 iterations. The priorities 共or weights, relative to 100兲 were 80 for CTV and PTV, 70 for nontarget area, 45 for the spinal cord, and 25 for the parotid glands. In total, nine treatment plans were designed in this study 共three PTV shrinkages for each set of CT im-ages兲.
TPSs usually use correction functions to correct the varia-tions in beam attenuation and scattering for heterogeneous geometries, e.g., a low-density sinus cavity and a high-density bone tissue for a head and neck plan. The Eclipse TPS provides three different correction functions, including equivalent TAR, Batho power law, and modified Batho 共MB兲. For consistency with the clinical application, the MB correction function was used in the dose calculation and in the optimization steps for all plans in this study.
II.D. IMRT dose measurements
For each measurement, machine output calibration was performed and a TLD calibration curve was generated by irradiating more than five randomly selected TLDs, with each TLD irradiated at each dose point to cover a range of doses. The dose range of the calibration curve should be large enough to cover the doses which will be measured for an IMRT plan, e.g., 30–200 cGy. The equation of a linear regression curve for each calibration curve was generated and the conversion from TLD reading to dose was performed accordingly共Fig.3兲. For tracking the stability of the batch of TLDs, calculation of the coefficient of determination共R2兲 for each linear regression curve was performed. During this study, R2 was kept in the range of 0.9936–0.9997, which implies good stability of the batch of TLDs.
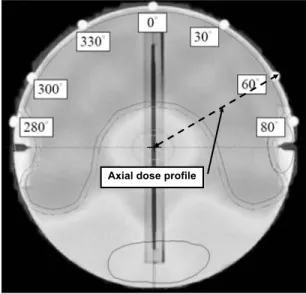
Doses in IMRT fields were measured at depths of 0, 3.5, and 7.0 mm and at seven beam axis positions共gantry angles of 280°, 300°, 330°, 0°, 30°, 60°, and 80°兲 for plans with PTV shrinkage margins of 0, 3, and 5 mm 共Table I兲. TLDs were placed carefully at each measurement point 共Fig. 4兲, one TLD at each point. At least three measurements were done for each individual plan for statistical analysis. At dose delivery, the phantom was supported on a frame extended outside the treatment couch. Radiation fields were checked carefully to be certain that no supporting accessories were irradiated.
The exact position of the phantom surface is very difficult to define on a CT image. Contrast and brightness are some of FIG. 2. CTV and normal structures such as the spinal cord共SC兲 and parotid
glands共PG兲 were contoured on the CT images of the ball phantom. PTV was generated by expanding a margin of 3 mm isotropically from the CTV.
FIG. 3. A TLD calibration curve was generated by irradiating a dose range of 30–200 cGy to five TLDs. The equation of a linear regression curve was generated and the coefficient of determination共R2兲 for the linear regression curve was obtained.
TABLEI. Mean measurement doses and standard deviations in cGy for dif-ferent beam incidence positions for PTV with difdif-ferent shrinkage margins at different depths. Shrink margin Measurement depth 0 mm 3.5 mm 7.0 mm 0 mm 106⫾18 185⫾16 188⫾12 3 mm 94⫾13 183⫾8 191⫾8 5 mm 86⫾11 173⫾8 187⫾5
the factors that will alter the displayed image. A small devia-tion in the determinadevia-tion of surface posidevia-tion will lead to a large dose variation because of the high dose gradient in the buildup region. In order to determine the exact surface posi-tion, the geometric center of the ball phantom was deter-mined first on an axial CT image and then the surface posi-tion was at 80 mm radial away from the center definitely. This method provides a more accurate surface position for the purpose of dose comparison between TPS calculation and measurement.
The calculated doses at different measurement positions were obtained by interpolating the values exported from the dose profiles共Figs.4and5兲. Regarding the diameter of the TLD and the fluctuation of dose distribution in the superficial region for the IMRT plan, the calculated dose at the measure-ment position 共the entrance point for beam incidence of angle°兲 was obtained by averaging three doses of incidence angles of°,共+ 1兲°, and 共− 1兲° at the same radial distance.
III. RESULTS
III.A. PDD comparison between TLD and Markus ion chamber
As shown in Fig.6, GR200F exhibits good characteristics for dose measurements in the buildup region. The difference of PDD in the buildup region between GR200F and the plane-parallel ion chamber was within a maximum of 2.5% at 3 mm and within 0.85% at the surface. PDDs calculated by using TPS are also shown in Fig.6for the comparison.
III.B. Intensity distribution of treatment fields
Figure 7 displays the intensity distributions at 0° inci-dence for 0, 3, and 5 mm shrinkage margins. The PTV with-out shrinkage has the highest radiation intensity distribution in the superficial region 关Fig. 7共a兲兴, while the PTVs with 3 and 5 mm shrinkages have the gradual intensity distributions 关Figs.7共b兲 and7共c兲, respectively兴.
III.C. IMRT dose measurements
Figure 8共a兲 shows the surface doses at the beam axis points for gantry angles of 280°, 300°, 330°, 0°, 30°, 60°, and 80° for plans with PTV shrinkage margins of 0, 3, and 5 mm. The surface dose increases with decreasing shrinkage margin. The surface doses range from 88 to 134, 78 to 114, and 73 to 102 cGy for 0, 3, and 5 mm shrinkage margins, respectively. The maximum surface dose is 74.6% relative to the Dpfor a 0 mm shrinkage margin关Fig.8共a兲兴.
Figure 8共b兲 shows the doses at a 3.5 mm depth for PTV shrinkage margins of 0, 3, and 5 mm. The doses range from 174 to 204, 173 to 192, and 160 to 182 cGy for 0, 3, and 5 mm shrinkage margins, respectively. Two measurement po-sitions共gantry angles of 280° and 80°兲 have doses lower than Dpfor 0 and 3 mm shrinkage margins, while five measure-ment positions have doses lower than Dp for the 5 mm shrinkage margin. Based on these results, for a case with a CTV at 3 mm away from the surface, planning for the PTV with a 5 mm shrinkage margin from the surface may cause insufficient dose coverage to the CTV.
Figure 8共c兲shows the doses at a 7.0 mm depth for PTV shrinkage margins of 0, 3, and 5 mm. The doses range from 167 to 202, 182 to 200, and 178 to 192 cGy for 0, 3, and 5 Axial dose profile
FIG. 4. TLDs were placed on the surface of the ball phantom for different gantry angles. The dose profile of a gantry angle of 60° is displayed 共䉳– – –䉴兲.
Cumulative profile for all seven fields
FIG. 5. Axial dose profiles of different treatment fields and the cumulative profile for all seven fields for a certain measurement position generated by the Eclipse TPS. The origin of the profile was at the center of the ball phantom. 0% 20% 40% 60% 80% 100% 120% 0 3 6 9 12 15 18 depth(mm) p ercen t d ep thd os e ion chamber TLD TPS
FIG. 6. PDD curves measured by plane-parallel ion chamber 共- ⴱ -兲 and GR200F共—•—兲, calculated by TPS 共- - -兲 for a 6 MV photon beam and 10⫻10 cm open field.
mm shrinkage margins, respectively. Most measurements are higher than Dp, except at incident angles of 280° and 80°. These points are very close to the hypothetical parotid glands and have high gradient dose distributions. The doses at these points would be lower than the prescribed dose to spare the parotid gland.
III.D. Dose comparison between TPS calculations and measurements
The dose comparisons between TPS calculations and TLD measurements at depths of 0, 3.5, and 7.0 mm and at seven beam axis positions共gantry angles of 0°, 30°, 60°, 80°, 330°,
300°, and 280°兲 for plans with PTV shrinkage margins of 0, 3, and 5 mm are shown in Fig. 9. There was no significant dependence of calculation accuracy with different shrinkage margins. From Figs.9共b兲and9共c兲, it can be seen that 76.2% and 90.5%, respectively, of the calculated points are with doses lower than the measured points and the difference of dose becomes more significant in the shallower regions. The deviations of dose for 0, 3.5, and 7.0 mm depths are from ⫺15% to 45%, ⫺12% to 6%, and ⫺6% to 3%, respectively. From Fig. 9共a兲, differences up to 45% were noted at the surface for gantry angles of 80° and 280°. These positions are on the surface and at the boundary between the PTV and the hypothetical parotid glands. The dose gradient in this region is even higher than at other positions on the surface. If (a)
(b)
(c)
FIG. 7. The intensity distributions of a beam angle of 0° for different PTV shrinkage margins.共a兲 No shrinkage. 共b兲 3 mm margin. 共c兲 5 mm margin.
Measure depth: 0 mm Shrinkage (mm): 0 , 3 , 5 Measure depth: 3.5 mm Shrinkage (mm): 0 , 3 , 5 Measure depth: 7.0 mm Shrinkage (mm): 0 , 3 , 5 (a) (b) (c)
FIG. 8. The measured doses for different positions and different PTV shrink-age margins.共a兲 Surface 共0 mm depth兲. 共b兲 3.5 mm depth. 共c兲 7.0 mm depth.
points at the surface for gantry angles of 80° and 280° are deducted from the seven comparison points, there will be 73.3% of the calculated points with doses lower than the measured points 关Fig.9共a兲兴. The average difference of dose between calculations and measurements is 2.5% 共maximum 5.5%兲 at a depth of 7.0 mm 关Fig.9共c兲兴.
IV. DISCUSSION AND CONCLUSION
In general, an IMRT plan has a much greater conformal dose distribution than a 2D-CRT or 3D-CRT plan. In order to have the actual dose distributions on patients according to the constraints in an IMRT plan, the beam intensity gener-ated from the optimization process should have a correct dose calculation in any condition. Otherwise, the processing
of optimization will generate intensities and dose distribu-tions incorrectly and mislead the plan evaluation.
The accuracy of dose calculation in the buildup region and at the interface between high and low-density structure tissues still needs to be verified for most TPSs. For IMRT planning, users should well understand the limitations in TPSs. Additional evaluation should be performed when the contouring includes those regions where TPSs may not cal-culate doses accurately.
Several possible strategies for sparing the skin dose in IMRT have been discussed, including the delineation of the skin as an organ at risk,5 the use of a hypothetical bolus applied in planning, but not in treatment,17 and the use of a PTV shrinkage margin from surface. With the use of a hypo-thetical bolus, some TPSs have to reoptimize the plan if there is any change in planning structures. For these TPSs, if the hypothetical bolus is not removed, the dosimetric condition will be different between the planned and delivered beams. Even with a TPS allowed to remove the bolus and recalculate the doses by using the same beam fluence, an increment in the effective thickness of the hypothetical bolus in a steeply inclined incidence while in optimization will make the dose distributions with a significant increment in the shallow re-gion when in recalculation.
PTV shrinkage margin from surface is one of the methods without the restrictions of TPS. When the surface is included in the PTV, the intensity increases significantly in the shal-low region in order to deliver sufficient doses to the PTV. In this study, if no constraint in maximum dose was used during the IMRT optimization, the maximum dose would be ⬎120% relative to Dp in the shallow region in order to
en-sure a sufficient dose to the near-surface PTV.
When the CTV is very close to or directly invades the skin共similar to the condition of PTV with 0 mm shrinkage兲, in this study, the mean measured dose for different positions at the surface was 106 cGy 共58.8% of Dp, TableI兲. These doses were significantly lower than the dose of Dp and the near-surface target was underdosed. In this situation, placing a bolus of adequate thickness on the skin is a better method to ensure a sufficient dose to the target. Additionally, based on the measurements in this study, in the situation of a PTV without shrinkage, the mean measured dose at 3.5 mm depth is 185 cGy共102.8% of Dp兲, which is nearly equal to the dose of Dp. This means that 3.5 mm is an adequate thickness of bolus to ensure a sufficient dose to the target on the surface for 6 MV photon beam.
However, when the CTV does not include the skin but the PTV does, an appropriate use of a shrinkage margin for the PTV is necessary to avoid the skin receiving an excessive dose and subsequent skin reaction. In this study, for a PTV with 3 mm shrinkage, the mean measured doses for different positions at depths of 0, 3.5, and 7.0 mm were 94 共52% of Dp兲, 183 共101% of Dp兲, and 191 cGy 共106% of Dp兲. For a PTV with 5 mm shrinkage, the mean measured doses at depths of 0, 3.5, and 7.0 mm were 86共48% of Dp兲, 173 共96% of Dp兲, and 187 cGy 共104% of Dp兲. Based on these measure-ments, an appropriate shrinkage margin can be selected de-pending on the region of CTV invaded. However, a PTV
At depth: 0 mm Shrinkage (mm): 0 , 3 , 5 At depth: 3.5 mm Shrinkage (mm): 0 , 3 , 5 At depth: 7.0 mm Shrinkage (mm): 0 , 3 , 5 (a) (b) (c)
FIG. 9. Dose comparisons between TPS calculations and TLD measure-ments for different positions and different PTV shrinkage margins.共a兲 Sur-face共0 mm depth兲. 共b兲 3.5 mm depth. 共c兲 7.0 mm depth.
margin is to accommodate setup error, thus the least shrink-age which will accomplish the purpose of skin sparing should be used.
The accuracy of the calculated doses in the buildup region should be evaluated for individual TPSs. From Fig.6, it can be seen that the differences between TPS and plane-parallel ion chamber are⫺10.2% and ⫺10.7% at depths of 0 and 1 mm, respectively. For points at depths⬎2 mm, the average difference is 0.7% 共maximum 2.2%兲. Additionally, IMRT planning for a head and neck cancer is very complicated. Multiple beams come from different angles around the pa-tient and more than ten critical structures that must be ac-counted for. The discrepancies found in a normal incidence should not be applied directly to the situation with a combi-nation of multiple beams. Comparisons between measure-ments and calculations in the buildup region can provide helpful information to understand the differences in different conditions for clinical evaluation when the target is close to the surface. However, it is difficult to identify the actual position of the skin on a CT image. In previous studies,18–20 an anthropomorphic phantom was used for planning and measurements. However, a small adjustment in the contrast and brightness of the CT image would result in a dramatic change in the display of the surface position. Ramsey et al.20 used the automatic detection tool in Pinnacle TPS with a threshold of 0.6 g/cm3 to identify the outer surface of the
phantom. However, in our experience, the parameters of the CT scan affect the display of images. Additionally, the steep dose gradient in the buildup region and the steep change in density at the superficial region were correlated in this study. Finally, we selected a ball phantom with a simple and accu-rate geometric shape to perform this study. Using the ball phantom, the surface position could be identified not only relying on the CT image but also on the physical size. In this situation, the dose comparison between calculations and measurements could be confirmed at the same position. Based on this study, the calculated doses in most of the po-sitions are lower than the measured doses.
Higgins et al.18and Quach et al.11indicated that skin dose increases with increasing surface curvature. For a seven-field head and neck IMRT plan, tangential fields would contribute higher doses to the measurement points in the superficial regions compared to a normal beam incidence on the surface. The surface and superficial doses will be lower for a simpler beam arrangement, e.g., bilateral static fields.
The application of the PTV shrinkage method should con-sider the calculation inaccuracy, tumor coverage, and pos-sible skin reactions. When the tumor does not invade the superficial region, an adequate shrinkage margin from body surface is helpful for reducing skin reactions. As the tumor invades the superficial region, to ensure a sufficient dose to the tumor, adding a bolus is a method better than only con-touring a PTV with skin inclusion. The accuracy of dose calculation in the superficial region for a TPS does not de-pend on different PTV shrinkage margins, but on the dose calculation algorithm. Differences ⬎10% between calcula-tions and measurements can be found at depths⬍3 mm. The accuracy of dose calculation is more reliable at a deeper
depth; the difference is⬍5.5% 共average 2.5%兲 at a depth of 7.0 mm. The results of dosimetry comparisons for deeper depths in this study are compatible with a report of dosime-try comparisons for IMRT planning, which expected an av-erage agreement between predicted and measured doses within 3%.21
Dosimetrically, the shrinkage amount is a consequence of calculation inaccuracy. Based on the results of this study, a shrinkage margin of 3 mm is used in our department for head and neck cancer patients with a CTV at least 3 mm away from the surface. In addition to the dosimetric analysis, treat-ment planning with a sharp dose gradient will also make it much more vulnerable to setup uncertainty. From Fig. 7 it can be seen that adequate shrinkage margins from the body surface for PTV can also avoid a sharp dose gradient and make the plan less vulnerable to setup error.
a兲Electronic mail: [email protected].
b兲Author to whom correspondence should be addressed. Telephone: 886-2-89667000 ext. 1042; Fax: 886-2-89664367.
1E. J. Hall and A. J. Giaccia, Radiobiology for the Radiologist共Mosby, St. Louis, 2004兲, pp. 843–874.
2G. M. Uschold, in Principles and Practice of Radiation Therapy, edited by M. Charles and T. Dennis共Mosby, St. Louis, 2004兲, pp. 843–874. 3B. J. Gerbi, A. S. Meigooni, and F. M. Khan, “Dose buildup for obliquely
incident photon beams,”Med. Phys.14, 393–399共1987兲.
4G. A. Ezzell, J. M. Galvin, D. Low, J. R. Palta, I. Rosen, M. B. Sharpe, P. Xia, Y. Xiao, L. Xing, and C. X. Yu, “Guidance document on delivery, treatment planning, and clinical implementation of IMRT: Report of the IMRT subcommittee of the AAPM radiation therapy committee,”Med. Phys.30, 2089–2115共2003兲.
5N. Lee, C. Chuang, J. M. Quivey, T. L. Phillips, P. Akazawa, L. J. Verhey, and P. Xia, “Skin toxicity due to intensity-modulated radiotherapy for head-and-neck carcinoma,”Int. J. Radiat. Oncol., Biol., Phys.53, 630–
637共2002兲.
6P. J. Biggs and C. C. Ling, “Electrons as the cause of the observed dmax shift with field size in high energy photon beams,”Med. Phys.6, 291–295
共1979兲.
7P. J. Biggs and M. D. Russel, “An investigation into the presence of secondary electrons in megavoltage photon beams,”Phys. Med. Biol.28,
1033–1043共1983兲.
8C. C. Ling, M. C. Schell, and S. N. Rustgi, “Magnetic analysis of the radiation components of a 10 MV photon beam,”Med. Phys.9, 20–26
共1982兲.
9P. L. Petti, M. S. Goodman, J. M. Sisterson, P. J. Biggs, T. A. Gabriel, and R. Mohan“Sources of electron contamination for the Clinac-35 25-MV photon beam,”Med. Phys.10, 856–861共1983兲.
10T. C. Zhu and J. R. Palta, “Electron contamination in 8 and 18 MV photon beams,”Med. Phys.25, 12–19共1998兲.
11K. Y. Quach, J. Morales, M. J. Butson, A. B. Rosenfeld, and P. E. Met-calfe, “Measurement of radiotherapy x-ray skin dose on a chest wall phantom,”Med. Phys.27, 1676–1680共2000兲.
12N. Dogan and G. P. Glasgow, “Surface and build-up region dosimetry for obliquely incident intensity modulated radiotherapy 6 MV x rays,”Med. Phys.30, 3091–3096共2003兲.
13H. Chung, H. Jin, J. F. Dempsey, C. Liu, J. Palta, T. S. Suh, and S. Kim, “Evaluation of surface and build-up region dose for intensity-modulated radiation therapy in head and neck cancer,”Med. Phys.32, 2682–2689
共2005兲.
14J. P. Lin, T. C. Chu, S. Y. Lin, and M. T. Liu, “Skin dose measurement by using ultra-thin TLDs,”Appl. Radiat. Isot.55, 383–391共2001兲.
15B. J. Gerbi and F. M. Khan, “Measurement of dose in the buildup region using fixed-separation,”Med. Phys.17, 17–26共1990兲.
16N. Lee, A. Kramer, and P. Xia, “A phase II study of intensity modulated radiation therapy共IMRT兲 +/− chemotherapy for nasopharyngeal cancer,” Radiation therapy oncology group RTOG 0225共Version Date: May 26, 2005兲.
dose in intensity modulated radiotherapy共IMRT兲,”Phys. Med. Biol.49,
4919–4928共2004兲.
18P. D. Higgins, E. Y. Han, J. L. Yuan, S. Hui, and C. K. Lee, “Evaluation of surface and superficial dose for head and neck treatments using con-ventional or intensity-modulated techniques,”Phys. Med. Biol.52, 1135–
1146共2007兲.
19N. Hardcastle, E. Soisson, P. Metcalfe, A. B. Rosenfeld, and W. A. Tomé, “Dosimetric verification of helical tomotherapy for total scalp irradia-tion,”Med. Phys.35, 5061–5068共2008兲.
20C. R. Ramsey, R. M. Seibert, B. Robison, and M. Mitchell, “Helical tomotherapy superficial dose measurements,”Med. Phys.34, 3286–3293
共2007兲.
21G. A. Ezzell, J. W. Burmeister, N. Dogan, T. J. LoSasso, J. G. Mechala-kos, D. Mihailidis, A. Molineu, J. R. Palta, C. R. Ramsey, B. J. Salter, J. Shi, P. Xia, N. J. Yue, and Y. Xiao, “IMRT commissioning: Multiple institution planning and dosimetry comparisons, a report from AAPM Task Group 119,”Med. Phys.36, 5359–5373共2009兲.