Cancer risks among patients with type 2 diabetes: A 10-year follow-up study of a nationwide population-based cohort in Taiwan
Cheng-Chieh Lin,1,2,3Jen-Huai Chiang,†4,5 Chia-Ing Li, 2,3 Chiu-Shong Liu, 1,2,3 Wen-Yuan Lin,1,2 Teng-Fu Hsieh,6,7,8 Tsai-Chung Li 4,9*
1. Department of Family Medicine, China Medical University Hospital, Taichung, Taiwan 2. School of Medicine, College of Medicine, China Medical University, Taichung, Taiwan 3. Department of Medical Research, China Medical University Hospital, Taichung, Taiwan 4. Graduate Institute of Biostatistics, College of Management, China Medical University,
Taichung, Taiwan
5. Research & Development, Bureau of Health Promotion, Department of Health, Taipei, Taiwan
6. Division of Urology, Department of Surgery, Buddhist Tzu Chi General Hospital, Taichung Branch, Taichung, Taiwan
7. School of Medicine, Buddhist Tzu Chi University, Hualien, Taiwan
8. Graduate Institute of Clinical Medical Science, College of Medicine, China Medical University, Taichung, Taiwan
9. Department of Healthcare Administration, College of Health Science, Asia University, Taichung, Taiwan
* Correspondence to: Tsai-Chung Li
China Medical University, 91 Hsueh-Shih Road, Taichung, 40421, Taiwan, Tel: 886-4-2205-3366 ext. 6605, Fax: 886-4-2207-8539, e-mail: [email protected]
†Equal contribution as the first author
Email addresses:
Cheng-Chieh Lin: [email protected] Jen-Huai Chiang: [email protected] Chia-Ing Li: [email protected] Chiu-Shong Liu: [email protected] Wen-Yuan Lin: [email protected] Teng-Fu Hsieh: [email protected] Tsai-Chung Li: [email protected]
Abstract
Background: This study aims to determine the cancer risks among patients with type 2
diabetes through a follow-up study on a nationwide population-based cohort that included
Chinese diabetic patients and the general population in Taiwan as well as to estimate the
population attributable fraction (PAF) of site-specific cancer risks that can be attributed to
type 2 diabetes in the Taiwanese population by using standardized incidence ratios (SIRs,
95% CI).
Methods: The subjects with type 2 diabetes consisted of 472,979 patients aged ≥20 years,
whereas the general population consisted of 9,411,249 individuals of the same age limit but
are not diabetic. The subjects were identified from 1997 to 1998 and followed up until
December 31, 2007 or until the first manifestation of any cancer.
Results: The cancer sites with increased risks in men, which were consistent with the main
and sensitivity analyses, included the pancreas (SIR = 1.62; 95% CI = 1.53 to 1.72), liver
(1.61; 1.57 to 1.64), kidney (1.32; 1.25 to 1.40), oral (1.16, 1.12 to 1.21), and colorectal (1.19, 1.15 to 1.22). The cancer sites with increased risks in women included the liver (1.55; 1.51 to
1.60), pancreas (1.44; 1.34 to 1.55), kidney (1.38; 1.30 to 1.46), endometrium (1.36; 1.26 to 1.47), bladder (1.19; 1.11 to 1.27), colorectal (1.16; 1.13 to 1.20), and breast (1.14; 1.09 to 1.18). Overall, the PAFs were highest for liver cancer in men (4.0%) and women (3.7%), followed by pancreas (3.4%) and kidney (1.6%) cancers in men, and then for endometrium (1.8%) and kidney (1.8%) cancers in women.
Conclusion: Our data suggested that increased cancer risks are associated with type 2
diabetes.
Key words: T2DM, cancer risks, liver cancer, colorectal cancer, pancreas cancer, breast cancer
Introduction
Diabetes is one of the major public health problems in the world. The prevalence of type 2 diabetes mellitus has rapidly increased in Asian populations because of Westernized
lifestyle behaviors [1]. Diabetes mellitus (DM) is also one of the health burdens in Taiwan, and it ranks fifth among the top 10 leading causes of deaths in 2009. According to the Taiwan National Health Insurance Research Database (NHIRD), the age-standardized prevalence rates of type 2 diabetes have increased from 5.7% to 8.6% for men and from 5.9% to 8.0% for women from 2000 to 2007 [2]. In addition, new type 2 diabetes cases in younger adult
population have increased [3]. The prevalence of diabetes is also indicated in the Taiwanese Survey on Hypertension, Hyperglycemia, and Hyperlipidemia, where diabetes incidence is 7.5% in male and 6.8% in female from 2002 to 2007 [4].
Epidemiological findings of cohort and case-control studies have reported the possible association between type 2 diabetes and several cancer types, which include colon [5, 6], liver [7, 8], pancreatic [9, 10], breast [11] and prostate cancers [12, 13]. DM and cancers have common risk factors, such as smoking, alcohol consumption, obesity, diet, physical inactivity, high calorie intake, and saturated fat intake [14]. Moreover, several possible biological mechanisms that are likely involved in the association between diabetes and cancer have been proposed [15-17].
Previous studies have reported on estimated standardized incidence ratios (SIRs) by adjusting the population structure for site-specific cancers in patients with DM, including those in Sweden [6 ,18], China [19], USA [5], and Denmark [20]. SIRs are useful for researchers, policy-makers, and health-care planners to describe the health status of a given population for planning necessary medical care services. However, studies on estimating SIRs for all site-specific cancers in Taiwanese have never been conducted. Several studies on the association of type 2 diabetes with cancers in Taiwan have focused on one specific cancer site, such as the prostate [21], colon [22], liver [23], and breast [24]. However, none of these
studies have considered all cancer types simultaneously. Thus, the present study specifically aims to estimate the cancer risks among patients with type 2 diabetes through a follow-up study on a national population-based cohort that include Chinese diabetic patients and the general population in Taiwan as well as to estimate the population attributable fractions (PAF) of site-specific cancer risks in Taiwan population that can be attributed to type 2 diabetes by using SIRs .
Methods Data Sources
A national health insurance program was implemented in March 1995 [25]. In 2007, 22.6 million individuals from a total population of 23.0 million in Taiwan were enrolled in this insurance program. The Bureau of National Health Insurance (BNHI) contracted with 97% of the hospitals and 92% of the clinics in Taiwan. The datasets of the study consisted of the registry for beneficiaries, ambulatory and inpatient care claims, and the registry for
catastrophic illness from 1996 to 2007 from NHIRD. BNHI performs quarterly expert reviews on random samples of every 50 to 100 ambulatory and inpatient claims in each hospital and clinic. False diagnosis reports entail a high penalty.
Every individual in Taiwan has a unique personal identification number (PIN) code. To protect the privacy, data on patient identities are scrambled cryptographically by NHIRD. All the datasets can be interlinked through each individual PIN. Ambulatory care claims contain the individual’s gender and birthday, the date of visit, and codes for the International
Classification of Diseases, Ninth Revision, Clinical Modification (ICD-9-CM) codes, or A-codes for three primary diagnoses. Inpatient claims contain ICD-9-CM A-codes for the principal diagnosis up to four secondary diagnoses. The catastrophic illness database contains data from insurers who suffer from major diseases and are granted exemption from co-payment. All the cancer cases registered in the catastrophic illness database should be confirmed by
We conducted a population-based cohort study of the two groups. Patients with type 2 diabetes (aged ≥ 20 years) were identified in 1997 to 1998 and followed up until December 31, 2007 or until the first manifestation of any cancer type. The population with type 2 diabetes should have at least three ambulatory claims or at least one inpatient claim with diagnosis of ICD-9-CM code 250 or A-code A181 from 1997 to 1998. We initially excluded subjects with type I diabetes (N = 3,750) and any cancer type (N = 135,060) at baseline from the 633,680 patients with type 2 diabetes aged < 20 years (N = 17,679) as well as those with incomplete information for gender and residential area (N = 4,212). The other group was the general population, which comprised all insured individuals of the same age without any diabetes. The baseline date or index date for the type 2 diabetes group was the date of the first outpatient visit or inpatient admission. For the general population, the index date was
randomly assigned between January 1, 1997 and December 31, 1998 according to the index date distribution of the type 2 diabetes group. A total of 21,680,686 subjects were obtained from the insured population in the data (Figure 1), and we excluded subjects with type I diabetes (N = 8,910), any cancer at baseline (N = 2,401,786) and any diabetes (N =
2,735,586) from 1996 to 2007. Individuals aged < 20 years (N = 7,055,840) and those with incomplete information for gender and residential area (N = 67,315) from 1997 to 1998 were also excluded. Thus, 472,979 patients with type 2 diabetes and 9,411,249 individuals without any diabetes from 1997 to 1998 were included in the final analysis.
Measurements
The sociodemographic factors include age, gender, insurance premium, and urbanization degree of the residential area. Age was divided into 17 groups with five-year intervals from 20 to >90 years. Gender was categorized into male and female. Insurance premium was categorized according to the median of the amounts of insurance premiums, in which the median value for these two studies was 19,200 NT dollars from 1997 to 1998. We used an urbanization indicator developed by Liu et al [26], who categorized 365 Taiwan towns into
seven degrees of urbanization as follows: high- and medium-density urban areas, newly developed area, general area, aging-society area, rural area, and non-developed area.24
Cancer cases were identified from ambulatory and inpatient care claims of NHIRD from 1999 to 2007. Incidence rates of lung cancer, liver cancer, colorectal cancer, breast cancer, gastric cancer, oral cancer, prostate cancer, esophageal cancer, pancreatic cancer, cervical cancer, nasopharyngeal cancer, small intestine, including duodenum cancer, gallbladder cancer, retroperitoneal and peritoneal cancers, laryngeal cancer, respiratory and intrathoracic organ cancers, bone cancer, connective and other soft tissue cancers, skin cancer, placenta cancer, endometrial cancer, ovarian cancer, testicular cancer, penile cancer, bladder cancer, kidney cancer, brain cancer, Hodgkin’s disease, leukemia, and carcinoma in situ were estimated for the type 2 diabetes group and the general population. The incidence rates of cancers were estimated using the number of new cancer cases identified by NHIRD from 1999 to 2007 as numerators and total person-years from individuals with type 2 diabetes and without any diabetes during the follow-up period as denominators.
Statistical analysis
The person-years of the two populations were calculated from the baseline to the occurrence of specific cancers or the closing date (December 31, 2007). SIRs and 95% confidence intervals (CI) were estimated for cancers by using Poisson regression analysis and gender, residential area, and age were adjusted. A sensitivity analysis was performed under two conditions. For the first condition, the same comparisons were made except in the excluded cancer cases identified in 1999. These cancer cases were excluded because the patients are very likely to have cancers at the baseline and have not been diagnosed, thereby ruling out the possibility of the effect–cause relationship between diabetes and cancer. The second condition included the use of the Registry of Catastrophic Illness Database to identify cancer cases confirmed by pathological reports to estimate the SIRs. The PAFs for site-specific cancer incidence caused by diabetes were calculated for each gender by using
previously published prevalence estimates of diabetes in Taiwan [2] using the same dataset of the current study with the following formula [27]:
PAF=diabetes prevalence (RR-1)/ [1+diabetes prevalence (RR-1)]. All statistical analyses were performed using the SAS version 9.2 software (SAS Institute, Inc., Cary, NC).
Results
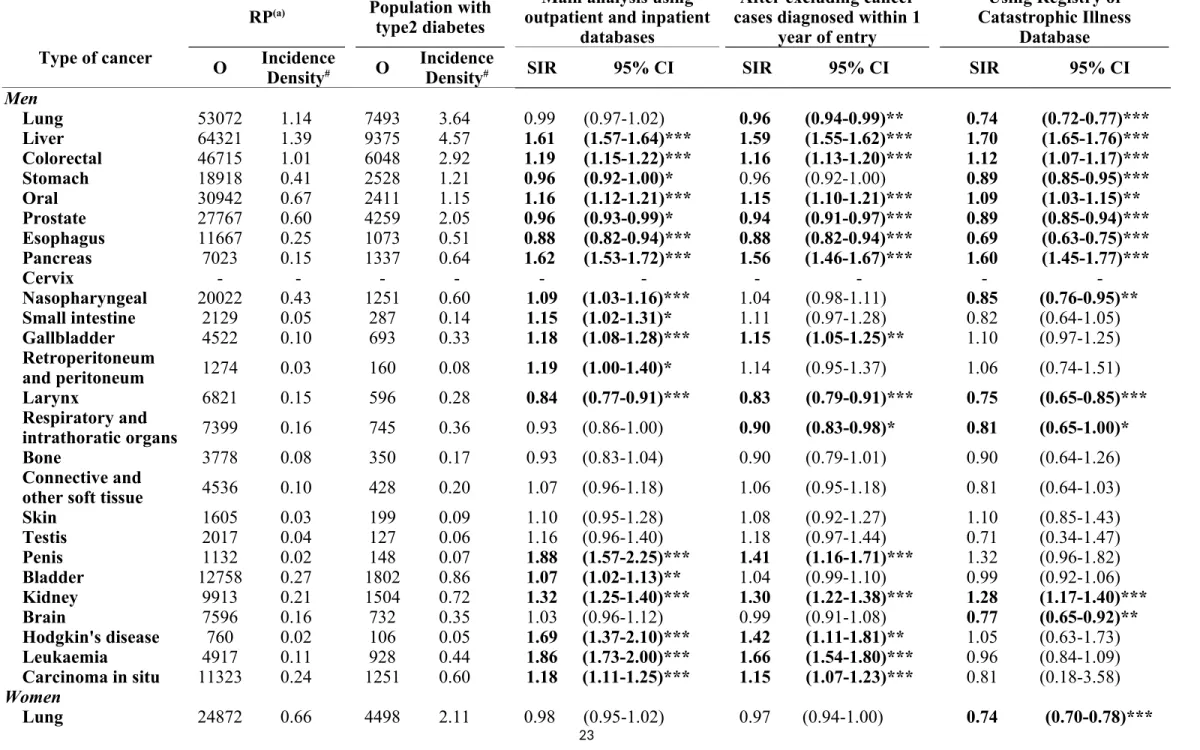
Table 1 shows the baseline characteristics of individuals according to type 2 diabetes status stratified by gender in Taiwan. Sex-specific incidence density rates and SIRs for cancer sites from the main and sensitivity analyses are shown in Table 2. The cancer sites with increased risks, which were consistent with the main and sensitivity analyses, included the liver (SIR = 1.61; 95% CI = 1.57 to 1.64 for the main analysis), colorectal (SIR = 1.19; 95% CI = 1.15 to 1.22), oral (SIR = 1.16; 95% CI = 1.12 to 1.21), pancreas (SIR = 1.62; 95% CI = 1.53 to 1.72), and kidney (SIR = 1.32; 95% CI = 1.25 to 1.40) for men. A significant decrease was observed in prostate (SIR = 0.96; 95% CI = 0.93 to 0.99), esophageal (SIR = 0.88; 95% CI = 0.82 to 0.94), and laryngeal (SIR = 0.84; 95% CI = 0.77 to 0.91) cancer incidences for men. For women, the cancer sites with increased risks include the liver (SIR = 1.55; 95% CI = 1.51 to 1.60 for the main analysis), colorectal (SIR = 1.16; 95% CI = 1.13 to 1.20), breast (SIR = 1.14; 95% CI = 1.09 to 1.18), pancreas (SIR = 1.44; 95% CI = 1.34 to 1.55), endometrium (SIR = 1.36; 95% CI = 1.26 to 1.47), bladder (SIR = 1.19; 95% CI = 1.11 to 1.27), and kidney (SIR = 1.38; 95% CI = 1.30 to 1.46). A significant decrease was observed in the cervix (SIR = 0.94; 95% CI = 0.91 to 0.99) and connective and other soft tissue (SIR = 0.86; 95% CI = 0.76 to 0.97) cancer incidences. Using the Registry of Catastrophic Illness database to identify the cancer cases, the SIRs that were not significant, but were significant in the main analysis and the sensitivity analysis that excluding cancer cases diagnosed within one year of entry included: 1) gallbladder and penile cancers, as well as Hodgkin’s disease, leukemia, and carcinoma in situ in men; and 2) stomach, oral, and placenta cancers,
Figure 2 shows the PAF of site-specific cancer risks that were consistent with the main and sensitivity analyses and seemed to have notable associations with diabetes in the
population, such as liver, colorectal, oral, pancreas, and kidney for men, and liver, colorectal, breast, pancreas, endometrium, bladder, and kidney for women. These PAFs differed
substantially across cancer sites (Figure 2). Overall, the PAFs were highest for liver cancer in
men (4.0%) and women (3.7%), followed by pancreas (3.4%) and kidney (1.6%) cancers in men, and endometrium (1.8%) and kidney (1.8%) cancers in women.
Discussion
To the best of our knowledge, this report is the largest study to examine the SIRs and PAFs of diabetes on site-specific cancer incidence for the Chinese population. This nationwide population-based cohort study included 474,686 patients with type 2 diabetes whose ages were ≥ 20 years from the baseline. The general population consists of
approximately 10 million individuals who enrolled in the NHI program with the same age limits but with no diabetes. All individuals in this study have been followed up for 10 to 11 years. In this retrospective nationwide population study, a diagnosis of DM was associated with 60%, 19%, 17%, 62%, and 33% increases in the risks of liver, colorectal, oral,
pancreatic, and kidney cancer incidences in Chinese men, respectively. A similar result was also observed in women, in which 55%, 16%, 14%, 45%, 36%, 19%, and 38% increases in liver, colorectal, breast, pancreas, endometrium, bladder, and kidney cancers were observed, respectively. This study showed similarity in the magnitude of risks between men and women. Our study provided estimates for site-specific cancer risks for Chinese with type 2 diabetes by adjusting for population structure. In particular, the association between diabetes and oral cancer has never been reported. Furthermore, the proportions of the total risks for site-specific cancers in the Taiwanese population that can be attributed to type 2 diabetes were estimated using the entire populations with and without type 2 diabetes.
diabetes has an increased risk of liver [6], colon [5, 6, 19], pancreas [6], esophagus [6], stomach [6], and lung [6], cancers, whereas the risk of prostate cancer is lower [6]. Diabetes is also associated with higher risk of breast cancer according to several studies [6]. By contrast, other studies have shown that diabetes is associated with lower risk for breast cancer [18]. At each cancer site, the increased risk of liver, colorectal, pancreatic, and kidney cancers are consistent with those in previous studies [28-34]. We also observed higher risk of breast, bladder, and endometrium cancers in women, which is consistent with the findings from previous studies [20]. A significant inverse association between diabetes and prostate cancer has been observed in men, which is also consistent with previous epidemiological studies [20, 35-38], but inconsistent with those that show no associations [30-34, 39].At the other sites, we found a negative association for esophageal and laryngeal cancers in males, as well as for cervical and connective and other soft tissue cancers in females. However, previous
epidemiological studies [30-34, 40, 41] have found no evidence for an association with these cancers, although several studies have shown negative associations [20].
Our study, along with previous studies, indicated that diabetes is a risk factor for cancers. Many possible biological mechanisms are involved in the association between DM and the overall or a specific cancer. Diabetes may influence cancer by hyperinsulinemia, hyperglycemia, or inflammation as a result of metabolic and hormonal aberrations [17]. Diabetic individuals normally have hyperinsulinemia and are associated with reduced insulin sensitivity and compensatory hyperinsulinemia as well as increased insulin-like growth factor (IGF)-1 levels, which may stimulate cell proliferation in the liver, pancreas, colon, ovary, breast, and other areas. Insulin and IGFs may promote tumor cell growth, which increases the risk of cancers. Among the cancers that we have studied, liver and pancreatic cancers were the two types that exhibited the highest SIRs associated with type 2 diabetes. Insulin is produced by pancreatic β cells through the hepatic portal vein to the liver, which, along with the pancreas, is exposed to high insulin concentrations [17]. Considering the inflammatory
function of insulin, previous studies have shown a strong association between obesity and diabetes [15]. Obesity may increase the risk of cancers because obese individuals have higher levels of leptin and lower levels of serum adiponectin [16], which is associated with chronic inflammation [42]. The association between DM and cancer can also be associated with the changes in sex hormone levels that occur in several types of cancer, such as prostate cancer. Testosterone affects the growth of the prostate gland [43]; in particular, a high testosterone level is associated with prostate cancer [44]. Previous studies have also indicated that diabetic men have lower testosterone levels [45], which suggests a decreased risk in prostate cancer. Thus, the decreased risk observed in this study is biologically plausible.
Our sensitivity analysis showed that the estimated SIRs of many major cancers were similar to those from the analysis, in which cancer cases identified in 1999 were excluded as well as the cancer cases obtained from the Registry of Catastrophic Illness database, except for stomach cancer. These consistent findings showed that the results of our study were robust. For several cancers with lower incidence rates, such as nasopharyngeal, small intestine, and brain cancers, the SIR estimates based on the Registry of Catastrophic Illness database are not consistent with those in the other two methods. The possible explanation for this inconsistency is that the Registry of Catastrophic Illness database does not include a large proportion of cases because applying for the Catastrophic Illness status is not compulsory. For example, several patients with an early cancer stage may not want to apply for the
Catastrophic Illness status because they do not want to be labeled as cancer patients or they do not have a chance to apply because of short survival. Thus, we considered the most acceptable definition of cancer cases in clinical practice in this study. For cancer cases with three or more outpatient visits with cancer codes, the cancer status is always confirmed by pathological reports on the third visit. Similarly, for cancer cases with one or more inpatient admissions with cancer codes, the cancer status is always confirmed by pathological reports before
discharge. To be conservative, we only discussed the cancer types with SIRs that are consistent with the main and sensitivity analyses.
Strengths and limitations
This study has several merits. First, this study is considered a large study that involved the estimation of SIRs for cancer patients with type 2 diabetes. Thus, this study has sufficient capability to detect the effect of type 2 diabetes and to adjust according to several risk factors, such as age, gender, and residential area through standardization. Although the Asia Pacific Cohort Studies Collaboration (APCSC) has examined the associations between diabetes and cancer mortality with a large sample size (Lam et al, 2011), our study has two advantages. One is that the participants of APCSC are from thirty-six cohort Asian and Australasian studies with various ethnic origins, which may modify the association between diabetes and cancer incidence. The other is that APCSC has focused on cancer mortality and cancer
incidence has not been considered. Second, the NHIRD included all of the diagnosed records. Thus, we can accurately determine the cancer incidence and minimize the number of subjects in the cohort who were lost during the follow-up period. Third, the data were one-year left-censored with a negligible effect on the original estimates to explore the possibility of reverse causality. In addition, most of the estimated SIRs are similar to those obtained from the analysis, in which cancer incidences obtained from the Registry of Catastrophic Illness database were used. The consistent findings from our sensitivity analysis indicated that our results are robust.
Several limitations of the study were also observed. First, we cannot obtain the data of behavioral factors, such as smoking, alcohol consumption, obesity, body mass index, and physical activity. In addition, we cannot determine the familial risks for diabetes to explain the effects of genetic and environmental factors. Thus, the independent effect of type 2 diabetes and cancer cannot be established. However, our study allows for rate comparison by adjusting for population structure of age, gender, and residential area, which can be performed
as the first step of this line of research. Second, diabetic patients may have taken medicine that affected the cancer risks. Previous studies have also indicated that glucose-lowering medicines, such as metformin, may reduce the risk of cancers in diabetic patients. On the contrary, sulfonylurea drugs or insulin are associated with increased cancer risk [46]. Thus the strength of association between type 2 diabetes and cancer estimated for different populations depend on the prevalence of anti-diabetes medication in population with diabetes. Although we did not have information regarding glucose-lowering medications, it won’t confound our estimation for the association between type 2 diabetes and cancer.
Conclusion
Our data suggested that unusual risks of cancer are associated with T2DM. Significant increased risks were observed in liver, colorectal, oral, pancreatic, and kidney cancers in men, and in liver, colorectal, breast, pancreatic, endometrium, bladder, and kidney cancers in women. Reduced risks were observed in prostate, esophageal, and laryngeal cancers in men. Reduced risks were also found in cervical and connective and other soft tissue cancers in women.
Competing interests None to declare. Authors’ contributions
TCL, JHC and CCL contributed equally to the design of the study and the direction of its implementation, including supervision of the field activities, quality assurance and control. CIL, CSL, and WYL supervised the field activities. CSL, CCL, TFH and CIL helped conduct the
literature review and prepare the Methods and the Discussion sections of the text. TCL and JHC
designed the study’s analytic strategy and conducted the data analysis. All authors read and approved the final manuscript.
Acknowledgements
Research Center for Excellence (DOH102-TD-B-111-004) and Taiwan Department of Health,
China Medical University Hospital Cancer Research Center of Excellence
References
1. World Health Organization (WHO). The world health report 2004: changing history, 2004. Available: http://www.who.int/whr/2004/en/
2. Lin CC, Li CI, Hsiao CY, Liu CS, Yang SY, Lee CC, Li TC. Time trend analysis of the prevalence and incidence of diagnosed type 2 diabetes among adults in Taiwan from 2000 to 2007: a population-based study. BMC Public Health. 2013;13:318.
3. Chang CH, Shau WY, Jiang YD, Li HY, Chang TJ, Sheu WH, Kwok CF, Ho LT, Chuang LM. T2DM prevalence and incidence among adults in Taiwan during 1999-2004: a national health insurance data set study. Diabet Med. 2010;27:636-643.
4. Health Promotion Administration, Ministry of Health and Welfare. Available: http://www.bhp.doh.gov.tw/BHpnet/Portal/PressShow.aspx?No=200907170001.
5. Limburg PJ, Vierkant RA, Fredericksen ZS, Leibson CL, Rizza RA, Gupta AK, Ahlquist DA, Melton LJ 3rd, Sellers TA, Cerhan JR. Clinically confirmed T2DM mellitus and colorectal cancer risk: a population-based, retrospective cohort study. The American journal of gastroenterology 2006;101:1872-1879.
6. Hemminki K, Li X, Sundquist J, Sundquist K. Risk of cancer following hospitalization for T2DM . The oncologist 2010;15:548-555.
7. El-Serag HB, Tran T, Everhart JE. Diabetes Increases the Risk of Chronic Liver Disease and Hepatocellular Carcinoma. Gastroenterology 2004;126:460-468.
8. Fujino Y, Mizoue T, Tokui N, Yoshimura T. Prospective study of diabetes mellitus and liver cancer in Japan. Diabetes Metab Res Rev 2001;17:374-9.
9. Wang J, Webb G, Cao Y, Steiner DF. Contrasting patterns of expression of
transcription factors in pancreatic alpha and beta cells. Proc Natl Acad Sci U S A. 2003;100:12660-12665.
10. Gullo L, Pezzilli R, Morselli-Labate AM; Italian Pancreatic Cancer Study Group. Diabetes and the risk of pancreatic cancer. N Engl J Med. 1994;331:81-84.
11. Michels KB, Solomon CG, Hu FB, Rosner BA, Hankinson SE, Colditz GA, Manson JE; Nurses' Health Study.T2DM and Subsequent Incidence of Breast Cancer in the Nurses’ Health Study. Diabetes Care 2003;26:1752-1758.
12. Waters KM, Henderson BE, Stram DO, Wan P, Kolonel LN, Haiman CA. Association of diabetes with prostate cancer risk in the multiethnic cohort. Am J Epidemiol.
2009;169 :937-945.
13. Li D, Yeung SC, Hassan MM, Konopleva M, Abbruzzese JL. Antidiabetic therapies affect risk of pancreatic cancer. Gastroenterology 2009;137:482-488.
14. World Cancer Research Fund/American Institute for Cancer Research (WCRF/AICR) 1997 Food, Nutrition and the Prevention of Cancer: A Global Perspective. Washington, DC, WCRF/AICR.
15. Schienkiewitz A, Schulze MB, Hoffmann K, Kroke A, Boeing H. Body mass index history and risk of T2DM : results from the European Prospective Investigation into Cancer and Nutrition (EPIC)-Potsdam Study. Am J Clin Nutr 2006;84:427-433.
16. Considine RV, Premkumar A, Reynolds JC, Sebring NG, Ricks M, Sumner AE. Adiponectin and leptin in African Americans. Obesity (Silver Spring) 2008;16:428-434.
17. Giovannucci E, Harlan DM, Archer MC, Bergenstal RM, Gapstur SM, Habel LA, Pollak M, Regensteiner JG, Yee D. Diabetes and cancer: a consensus report. CA Cancer J Clin 2010;60:207-221.
18. Stephansson O, Granath F, Ekbom A, Michels KB. Risk of breast cancer among daughters of mothers with diabetes: a population-based cohort study. Breast Cancer Res 2010;12:R14.
19. Ren X, Zhang X, Zhang X, Gu W, Chen K, Le Y, Lai M, Zhu Y. T2DM mellitus associated with increased risk for colorectal cancer: evidence from an international ecological study and population-based risk analysis in China. Public Health
2009;123:540-544.
20. Wideroff L, Gridley G, Mellemkjaer L, Chow WH, Linet M, Keehn S, Borch-Johnsen K, Olsen JH. Cancer incidence in a population-based cohort of patients hospitalized with diabetes mellitus in Denmark. J Natl Cancer Inst 1997;89:1360-1365.
21. Tseng CH. Diabetes and risk of prostate cancer: a study using the National Health Insurance. Diabetes Care 2011;34:616-621.
22. Huang YC, Lin JK, Chen WS, Lin TC, Yang SH, Jiang JK, Chang SC, Lan YT, Wang HS, Liu CY, Yang YW, Teng HW. Diabetes mellitus negatively impacts survival of patients with colon cancer, particularly in stage II disease. J Cancer Res Clin Oncol 2011;137:211-220.
23. Chen HF, Chen P, Li CY. Risk of malignant neoplasms of liver and biliary tract in diabetic patients with different age and sex stratifications. Hepatology (Baltimore, Md ) 2010;52:155-163.
24. Tseng CH, Chong CK, Tai TY. Secular trend for mortality from breast cancer and the association between diabetes and breast cancer in Taiwan between 1995 and 2006. Diabetologia 2009;52:240-246.
25. Lu JF, Hsiao WC. Does Universal health insurance make health care unaffordable? Lessons from Taiwan. Health Aff (Millwood) 2003;22:77-88.
26. Liu CY, Hung YT, Chuang YL, Chen YJ, Weng WS, Liu JS, Liang KY. Incorporating Development Stratification of Taiwan Townships into Sampling Design of Large Scale Health Interview Survey. Journal of Health Management 2006;4:1-22
27. Rockhill B, Newman B, Weinberg C. Use and misuse of population attributable fractions. Am J Public Health. 1998;88(1):15-19.
28. Lam EK, Batty GD, Huxley RR, Martiniuk AL, Barzi F, Lam TH, Lawes CM, Giles GG, Welborn T, Ueshima H, Tamakoshi A, Woo J, Kim HC, Fang X, Czernichow S,
Woodward M; Asia Pacific Cohort Studies Collaboration. Associations of diabetes mellitus with site-specific cancer mortality in the Asia-Pacific region. Ann Oncol. 2011;22(3):730-738.
29. Balkau B, Kahn HS, Courbon D, Eschwège E, Ducimetière P; Paris Prospective Study. Hyperinsulinemia predicts fatal liver cancer but is inversely associated with fatal cancer at some other sites: the Paris Prospective Study. Diabetes Care 2001;24:843-849.
30. Rousseau MC, Parent ME, Pollak MN, Siemiatycki J. Diabetes mellitus and cancer risk in a population-based case-control study among men from Montreal, Canada. Int J Cancer 2006;118:2105-2109.
31. Coughlin SS, Calle EE, Teras LR, Petrelli J, Thun MJ. Diabetes mellitus as a predictor of cancer mortality in a large cohort of US adults. Am J Epidemiol. 2004;159:1160-1167.
32. Jee SH, Ohrr H, Sull JW, Yun JE, Ji M, Samet JM. Fasting serum glucose level and cancer risk in Korean men and women. JAMA. 2005;293:194-202.
33. Michaud DS, Liu S, Giovannucci E, Willett WC, Colditz GA, Fuchs CS. Dietary sugar, glycemic load, and pancreatic cancer risk in a prospective study. J Natl Cancer Inst. 2002;94:1293-1300.
34. Chari ST, Leibson CL, Rabe KG, Ransom J, de Andrade M, Petersen GM. Probability of pancreatic cancer following diabetes: a population-based study. Gastroenterology 2005;129:504-511.
35. Rodriguez C, Patel AV, Mondul AM, Jacobs EJ, Thun MJ, Calle EE. Diabetes and risk of prostate cancer in a prospective cohort of US men. Am J Epidemiol. 2005;161:147-152.
36. Coker AL, Sanderson M, Zheng W, Fadden MK. Diabetes mellitus and prostate cancer risk among older men: population-based case-control study. Br J Cancer.
2004;90:2171-2175.
37. Bonovas S, Filioussi K, Tsantes A. Diabetes mellitus and risk of prostate cancer: a meta-analysis. Diabetologia. 2004;47:1071-1078.
38. Gonzalez-Perez A, Garcia Rodriguez LA. Prostate cancer risk among men with diabetes mellitus (Spain). Cancer Causes Control. 2005;16:1055-1058.
39. Tavani A, Gallus S, Bertuzzi M, Dal Maso L, Zucchetto A, Negri E, Franceschi S, Ramazzotti V, Montella M, La Vecchia C. Diabetes mellitus and the risk of prostate cancer in Italy. Eur Urol. 2005;47:313-317.
40. Batty GD, Shipley MJ, Marmot M, Smith GD. Diabetes status and post-load plasma glucose concentration in relation to site-specific cancer mortality: findings from the original Whitehall study. Cancer Causes Control. 2004;15:873-881.
41. Weiderpass E, Ye W, Vainio H, Kaaks R, Adami HO. Diabetes mellitus and ovarian cancer (Sweden). Cancer Causes Control. 2002;13:759-764.
42. Park EJ, Lee JH, Yu GY, He G, Ali SR, Holzer RG, Osterreicher CH, Takahashi H, Karin M. Dietary and genetic obesity promote liver inflammation and tumorigenesis by enhancing IL-6 and TNF expression. Cell 2010;140:197-208.
43. Coffey DS. Physiological control of prostatic growth: an overview. In: Prostate Cancer. Geneva, Switzerland: International Union Against Cancer 1979;48:4-23. 44. Gann PH, Hennekens CH, Ma J, Longcope C, Stampfer MJ. Prospective study of sex
hormone levels and risk of prostate cancer. J Natl Cancer Inst. 1996;88:1118-1126. 45. Haffner SM, Shaten J, Stern MP, Smith GD, Kuller L. Low levels of sex hormone–
binding globulin and testosterone predict the development of non–insulin-dependent diabetes mellitus in men: Multiple Risk Factor Intervention Trial. Am J Epidemiol. 1996;143:889-897.
46. Donadon V, Balbi M, Ghersetti M, Grazioli S, Perciaccante A, Della Valentina G, Gardenal R, Dal Mas M, Casarin P, Zanette G, Miranda C. Antidiabetic therapy and increased risk of hepatocellular carcinoma in chronic liver disease. World J Gastroenterol 2009;15:2506-11.
Figure Legends:
Figure 1: Flowchart of recruitment procedures for the current study
Figure 2. Estimated population attributable fractions (%) for liver, colorectal, oral, pancreas, kidney, breast and endometrium cancer incidence due to type 2 diabetes
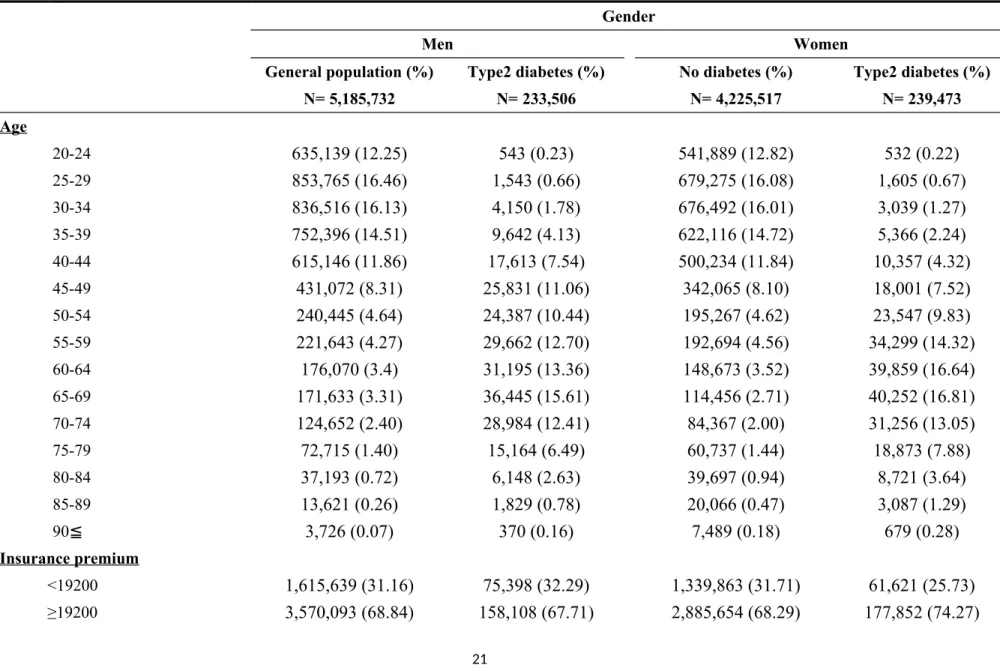
Table 1. Baseline characteristics of individuals according to T2DM status stratified by genderin Taiwan in 1997-1998. Gender Men Women General population (%) N=5,185,732 Type2 diabetes (%) N=233,506 No diabetes (%) N=4,225,517 Type2 diabetes (%) N=239,473 Age 20-24 635,139 (12.25) 543 (0.23) 541,889 (12.82) 532 (0.22) 25-29 853,765 (16.46) 1,543 (0.66) 679,275 (16.08) 1,605 (0.67) 30-34 836,516 (16.13) 4,150 (1.78) 676,492 (16.01) 3,039 (1.27) 35-39 752,396 (14.51) 9,642 (4.13) 622,116 (14.72) 5,366 (2.24) 40-44 615,146 (11.86) 17,613 (7.54) 500,234 (11.84) 10,357 (4.32) 45-49 431,072 (8.31) 25,831 (11.06) 342,065 (8.10) 18,001 (7.52) 50-54 240,445 (4.64) 24,387 (10.44) 195,267 (4.62) 23,547 (9.83) 55-59 221,643 (4.27) 29,662 (12.70) 192,694 (4.56) 34,299 (14.32) 60-64 176,070 (3.4) 31,195 (13.36) 148,673 (3.52) 39,859 (16.64) 65-69 171,633 (3.31) 36,445 (15.61) 114,456 (2.71) 40,252 (16.81) 70-74 124,652 (2.40) 28,984 (12.41) 84,367 (2.00) 31,256 (13.05) 75-79 72,715 (1.40) 15,164 (6.49) 60,737 (1.44) 18,873 (7.88) 80-84 37,193 (0.72) 6,148 (2.63) 39,697 (0.94) 8,721 (3.64) 85-89 13,621 (0.26) 1,829 (0.78) 20,066 (0.47) 3,087 (1.29) 90≦ 3,726 (0.07) 370 (0.16) 7,489 (0.18) 679 (0.28) Insurance premium <19200 1,615,639 (31.16) 75,398 (32.29) 1,339,863 (31.71) 61,621 (25.73) ≥19200 3,570,093 (68.84) 158,108 (67.71) 2,885,654 (68.29) 177,852 (74.27)
Urbanization degree
High density urban area 1,551,499 (30.28) 63,914 (27.64) 1,398,129 (33.52) 61,109 (25.82)
Medium density urban area 1,433,981 (27.99) 67,054 (29.00) 1,183,288 (28.37) 64,685 (27.33)
Newly developed area 985,111 (19.23) 39,778 (17.20) 719,525 (17.25) 38,390 (16.22)
General area 697,202 (13.61) 35,137 (15.20) 534,267 (12.81) 40,501 (17.11)
Aging society area 90,159 (1.76) 6,204 (2.68) 69,560 (1.67) 7,877 (3.33)
Rural area 187,136 (3.65) 10,345 (4.47) 138,781 (3.33) 13,034 (5.51)
Table 2 Gender-specific incidence density rates and SIRs for cancer sites.
RP(a) Population withtype2 diabetes
Main analysis using outpatient and inpatient
databases
After excluding cancer cases diagnosed within 1
year of entry
Using Registry of Catastrophic Illness
Database Type of cancer O Incidence
Density# O IncidenceDensity# SIR 95% CI SIR 95% CI SIR 95% CI
Men Lung 53072 1.14 7493 3.64 0.99 (0.97-1.02) 0.96 (0.94-0.99)** 0.74 (0.72-0.77)*** Liver 64321 1.39 9375 4.57 1.61 (1.57-1.64)*** 1.59 (1.55-1.62)*** 1.70 (1.65-1.76)*** Colorectal 46715 1.01 6048 2.92 1.19 (1.15-1.22)*** 1.16 (1.13-1.20)*** 1.12 (1.07-1.17)*** Stomach 18918 0.41 2528 1.21 0.96 (0.92-1.00)* 0.96 (0.92-1.00) 0.89 (0.85-0.95)*** Oral 30942 0.67 2411 1.15 1.16 (1.12-1.21)*** 1.15 (1.10-1.21)*** 1.09 (1.03-1.15)** Prostate 27767 0.60 4259 2.05 0.96 (0.93-0.99)* 0.94 (0.91-0.97)*** 0.89 (0.85-0.94)*** Esophagus 11667 0.25 1073 0.51 0.88 (0.82-0.94)*** 0.88 (0.82-0.94)*** 0.69 (0.63-0.75)*** Pancreas 7023 0.15 1337 0.64 1.62 (1.53-1.72)*** 1.56 (1.46-1.67)*** 1.60 (1.45-1.77)*** Cervix - - - -Nasopharyngeal 20022 0.43 1251 0.60 1.09 (1.03-1.16)*** 1.04 (0.98-1.11) 0.85 (0.76-0.95)** Small intestine 2129 0.05 287 0.14 1.15 (1.02-1.31)* 1.11 (0.97-1.28) 0.82 (0.64-1.05) Gallbladder 4522 0.10 693 0.33 1.18 (1.08-1.28)*** 1.15 (1.05-1.25)** 1.10 (0.97-1.25) Retroperitoneum and peritoneum 1274 0.03 160 0.08 1.19 (1.00-1.40)* 1.14 (0.95-1.37) 1.06 (0.74-1.51) Larynx 6821 0.15 596 0.28 0.84 (0.77-0.91)*** 0.83 (0.79-0.91)*** 0.75 (0.65-0.85)*** Respiratory and intrathoratic organs 7399 0.16 745 0.36 0.93 (0.86-1.00) 0.90 (0.83-0.98)* 0.81 (0.65-1.00)* Bone 3778 0.08 350 0.17 0.93 (0.83-1.04) 0.90 (0.79-1.01) 0.90 (0.64-1.26) Connective and
other soft tissue 4536 0.10 428 0.20 1.07 (0.96-1.18) 1.06 (0.95-1.18) 0.81 (0.64-1.03)
Skin 1605 0.03 199 0.09 1.10 (0.95-1.28) 1.08 (0.92-1.27) 1.10 (0.85-1.43) Testis 2017 0.04 127 0.06 1.16 (0.96-1.40) 1.18 (0.97-1.44) 0.71 (0.34-1.47) Penis 1132 0.02 148 0.07 1.88 (1.57-2.25)*** 1.41 (1.16-1.71)*** 1.32 (0.96-1.82) Bladder 12758 0.27 1802 0.86 1.07 (1.02-1.13)** 1.04 (0.99-1.10) 0.99 (0.92-1.06) Kidney 9913 0.21 1504 0.72 1.32 (1.25-1.40)*** 1.30 (1.22-1.38)*** 1.28 (1.17-1.40)*** Brain 7596 0.16 732 0.35 1.03 (0.96-1.12) 0.99 (0.91-1.08) 0.77 (0.65-0.92)** Hodgkin's disease 760 0.02 106 0.05 1.69 (1.37-2.10)*** 1.42 (1.11-1.81)** 1.05 (0.63-1.73) Leukaemia 4917 0.11 928 0.44 1.86 (1.73-2.00)*** 1.66 (1.54-1.80)*** 0.96 (0.84-1.09) Carcinoma in situ 11323 0.24 1251 0.60 1.18 (1.11-1.25)*** 1.15 (1.07-1.23)*** 0.81 (0.18-3.58) Women Lung 24872 0.66 4498 2.11 0.98 (0.95-1.02) 0.97 (0.94-1.00) 0.74 (0.70-0.78)***
Liver 28577 0.75 6061 2.85 1.55 (1.51-1.60)*** 1.54 (1.49-1.58)*** 1.67 (1.60-1.75)*** Colorectal 33469 0.88 5502 2.59 1.16 (1.13-1.20)*** 1.15 (1.11-1.18)*** 1.07 (1.01-1.12)*** Breast 42441 1.12 2934 1.37 1.14 (1.09-1.18)*** 1.13 (1.09-1.18)*** 1.09 (1.04-1.14)*** Stomach 9632 0.25 1830 0.85 1.11 (1.05-1.17)*** 1.12 (1.06-1.18)*** 1.05 (0.98-1.13) Oral 4970 0.13 733 0.34 1.30 (1.20-1.42)*** 1.27 (1.16-1.39)*** 1.08 (0.94-1.25) Esophagus 7500 0.20 648 0.30 1.08 (0.99-1.18) 1.06 (0.97-1.16) 0.70 (0.54-0.90)** Pancreas 4700 0.12 1071 0.50 1.44 (1.34-1.55)*** 1.42 (1.32-1.53)*** 1.31 (1.17-1.46)*** Cervix 27472 0.73 2579 1.21 0.94 (0.90-0.99)** 0.93 (0.89-0.98)** 0.84 (0.79-0.90)*** Nasopharyngeal 8789 0.23 690 0.32 1.14 (1.05-1.24)** 1.09 (0.99-1.19) 0.98 (0.82-1.18) Small intestine 1248 0.03 222 0.10 1.11 (0.96-1.29) 1.04 (0.88-1.22) 1.04 (0.81-1.34) Gallbladder 3278 0.09 697 0.32 1.10 (1.01-1.20)* 1.08 (0.99-1.19) 1.08 (0.96-1.22) Retroperitoneum and peritoneum 1358 0.04 201 0.09 1.16 (0.99-1.35) 1.13 (0.95-1.33) 1.16 (0.89-1.52) Larynx 1272 0.03 137 0.06 1.30 (1.07-1.57)** 1.35 (1.10-1.66)** 1.41 (0.87-2.27) Respiratory and intrathoratic organs 3889 0.10 495 0.23 0.94 (0.85-1.04) 0.92 (0.83-1.02) 0.66 (0.50-0.88)** Bone 2555 0.07 333 0.15 1.03 (0.91-1.16) 1.00 (0.88-1.14) 0.78 (0.52-1.18) Connective and
other soft tissue 3284 0.09 309 0.14 0.86 (0.76-0.97)* 0.84 (0.73-0.95)** 0.76 (0.58-0.99)*
Skin 1265 0.03 189 0.09 1.10 (0.94-1.29) 0.99 (0.83-1.18) 0.93 (0.71-1.22) Placenta 450 0.01 385 0.18 19.90 (16.40-24.16)*** 8.74 (6.65-11.48)*** 1.59 (0.44-5.74) Endometrium 8094 0.21 835 0.39 1.36 (1.26-1.47)*** 1.28 (1.18-1.39)*** 1.32 (1.17-1.49)*** Ovary 13406 0.35 873 0.41 1.02 (0.95-1.10) 1.02 (0.94-1.10) 0.85 (0.75-0.96)** Bladder 6043 0.16 1151 0.54 1.19 (1.11-1.27)*** 1.17 (1.09-1.25)*** 1.13 (1.03-1.25)* Kidney 6943 0.18 1471 0.68 1.38 (1.30-1.46)*** 1.36 (1.28-1.45)*** 1.32 (1.21-1.45)*** Brain 6370 0.17 791 0.37 1.15 (1.06-1.25)*** 1.10 (1.01-1.20)* 0.80 (0.66-0.97)* Hodgkin's disease 543 0.01 91 0.04 1.84 (1.44-2.35)*** 1.82 (1.38-2.39)*** 1.35 (0.64-2.87) Leukaemia 3353 0.09 830 0.39 2.11 (1.94-2.29)*** 1.84 (1.68-2.03)*** 0.96 (0.83-1.12) Carcinoma in situ 49189 1.30 3142 1.47 0.93 (0.90-0.97)*** 0.92 (0.88-0.96)*** 1.05 (0.36-3.06)
(a) The SIR for reference population is 1.00.
(b) Observed number of cancer cases for population with type2 diabetes after exclusion of cancers diagnosed within 1 year of cohort entry.
(c) Observed number of cancer cases for population with type2 diabetes using Registry of Catastrophic Illness Database
The SIRs were adjusted for a core group of covariates (residential area, age). Bold type indicates that the 95% CI does not include 1.00.
Abbreviations: CI, confidence interval; O, observed number of cancer cases; SIR standardized incidence ratio; RP, reference population. #per 1000 person-years; *: p<0.05; **: p<0.01; ***: p<0.001