Accuracy of the EasyTouch blood glucose self-monitoring system:
a study of 516 cases
Ken-Shwo Dai
a,b,*, Der-Yan Tai
c, Ping Ho
c, Chien-Chih Chen
c, Wen-Chung Peng
c,
Shih-Te Chen
c, Chun-Chieh Hsu
a, Yu-Ping Liu
a, Hsiu-Ching Hsieh
a,
Chin-Chang Yang
a, Ming-Chuan Tsai
d, Simon J.T. Mao
ba
Bioptik Technology Inc., 1F, No. 9 Industry E. Rd. IV, Science-Based Industrial Park Hsinchu, Hsinchu 300, Taiwan
b
Department of Biological Science and Technology, National Chiao Tung University, Hsinchu, Taiwan
c
Wei-Gong Memorial Hospital, Miaoli, Taiwan
d
School of Medical Technology, Taipei Medical University, Taipei, Taiwan Received 29 April 2004; received in revised form 10 June 2004; accepted 15 June 2004
Abstract
Background: Self-monitoring blood glucose device is an important tool for diabetes patients to efficiently control their blood glucose concentrations. We evaluated the accuracy of EasyTouch glucose monitoring system.
Methods: Capillary blood glucose concentrations measured using EasyTouch and the reference values obtained from Yellow Springs Instruments (YSI) 2300 STAT were performed in the Department of Laboratory Medicine, Wei-Gong Memorial Hospital. Results were evaluated using (1) linear regression analysis, (2) Clarke Error Grid analysis, (3) percentage of readings within a defined range of deviation from the reference value, (4) bias plots, and (5) coefficients of variation (CVs) calculated from 60 measurements in series.
Results: The window of the 516 EasyTouch readings covered a range from 42 to 555 mg/dl. Linear regression analysis yielded a regression slope 0.9972, intercept 1.899 mg/dl, r20.9571, and Syx 14.89 mg/dl. A Clarke Error Grid analysis showed 100% of the EasyTouch readings in clinically acceptable zones A and B. Of the EasyTouch readings, 98.3%, 91.9%, 78.3% and 46.9% were found within F20%, F15%, F10%, and F5%, respectively, of the reference values. Further analysis showed that the percentage of EasyTouch readings within the defined intervals was similar in three glucose ranges (V100, 101–200, and z201 mg/dl). The CVs for the four lots of strips (lot 1 to lot 4) ranged from 3.5 to 5.5%, 2.1 to 4.8%, 1.8 to 3.6%, and 3.0 to 5.7%, respectively. Conclusions: EasyTouch provides high accurate and precise glucose readings over a wide range of glucose concentrations. D 2004 Elsevier B.V. All rights reserved.
Keywords: Diabetes mellitus; Glucose self-monitoring system; Clarke Error Grid analysis; Home testing; Point-of-care testing
0009-8981/$ - see front matterD 2004 Elsevier B.V. All rights reserved. doi:10.1016/j.cccn.2004.06.010
* Corresponding author. Bioptik Technology Inc., 1F, No. 9 Industry E. Rd. IV, Science-Based Industrial Park Hsinchu, Hsinchu 300, Taiwan. Tel.: +886 3 578 2999x200; fax: +886 3 578 7276.
E-mail address: [email protected] (K.-S. Dai).
1. Introduction
Diabetes mellitus (DM) and its related complica-tions have been known to be the major health problems worldwide. The annual deaths associated with DM was estimated to be approximately 4 million
[1]. The cost burden for DM in the US was estimated to be 132 billion in 2002 [2]. Considerable efforts regarding diabetes have been focused on the improve-ment of clinical outcome and on the reduction of economic burden. It has been reported that the maintenance of near-normal blood glucose level was important in reducing the risk or slowing the progress of diabetes-related complications/deaths [1,3]. Thus, self-monitoring blood glucose device was recommen-ded as one of the important tools for diabetic patients to control their blood glucose levels[4–8].
Over the past few years, many handheld glucose meters have been developed and introduced into the self-monitoring diagnostic market. The clinical
accu-racy of many of them has been evaluated [9–16].
Recently, EasyTouch, a new handheld capillary blood glucose/uric acid monitoring system (Bioptik Tech-nology, Hsinchu, Taiwan), has been introduced into the diagnostic market. The objective of the present study was designed to determine the clinical accuracy of EasyTouch glucose monitoring system.
2. Materials and methods
2.1. Subjects and blood glucose measurements Patients with diabetes attending the outpatient clinic of Wei-Gong Memorial Hospital were invited to enroll in the study. Using EasyTouch glucose monitoring system, capillary blood glucose measure-ments (finger stick) was performed in the Department of Laboratory Medicine of Wei-Gong Memorial Hospital by a trained technician according to the manufacturer’s instructions to avoid errors made by patients. Four lots of EasyTouch test strips were used. Immediately after finger stick measurement, venous blood sample of diabetic patient was drawn by a nurse. Plasma glucose from this sample was deter-mined using the Yellow Springs Instruments (YSI) 2300 STAT blood glucose analyzer, which served as the reference method. According to the
manufac-turers’ claims, patient’s hematocrit, a selection crite-rion of the present study, was also determined. Measurements from patients with hematocrit of b30% or N55% were analyzed but excluded from the present clinical accuracy study. To evaluate the precision of the EasyTouch monitoring system, 60 measurements for each of the six clinically relevant blood glucose ranges (43–56, 83–90, 148–158, 245– 264, 354–371, and 422–470 mg/dl) were performed for the four lots of test strips using 20 EasyTouch meters. Four of these meters were used at the Wei-Gong Memorial Hospital.
2.2. Data analysis
The clinical accuracy of EasyTouch was assessed by comparing the EasyTouch readings with the YSI reference values using (1) linear regression analysis,
(2) Clarke Error Grid analysis [17,18], and (3) the
percentage of readings within a defined range of deviation from the reference value. The x-axis and the y-axis of the Error Grid analysis were defined as the reference values and the EasyTouch readings, respec-tively. The resulting graphic display of the Clarke Error Grid analysis was divided into different zones: (1) zone A: clinically accurate; (2) zone B: error NF20% but would lead to benign or no treatment; (3) zone C: overcorrection of the true glucose value; (4) zone D: dangerous failure to detect and treat; (5) zone E: erroneous treatment. The percentage of readings within a defined deviation range (b5%, 5–10%, 10– 15%, 15–20%, and N20%) of the reference values was analyzed for each of the glucose range (V100, 101– 200, and z201 mg/dl). Precision of the EasyTouch monitoring system was determined from the 60 measurements of each glucose range.
3. Results
A total of 516 patients, met the criterion of hematocrit concentrations (30–55%), were eligible for the study. Of these participants, 246 (47.7%) were males and 270 (52.3%) were females (age range 16 to 83 y). The 516 EasyTouch readings covered a wide range of glucose concentrations from 42 to 555 mg/dl (65 readings (12.6%) V100 mg/dl, 314 readings (60.8%) 101–200 mg/dl, 112 readings (21.7%) 201–
300 mg/dl, 19 readings (3.7%) 301–400 mg/dl, 5 readings (0.9%) 401–500 mg/dl, and 1 reading (0.19%) z501 mg/dl). Over the range of glucose readings, EasyTouch correlated well with the YSI
values (slope 0.9972, intercept 1.899 mg/dl, r2
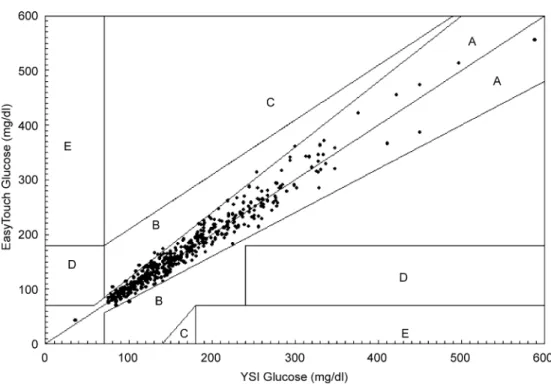
0.9571, Syx 14.89 mg/dl). A Clarke Error Grid analysis showed that 507 readings (98.3%) fell within zone A and 9 readings (1.7%) fell within zone B (Fig. 1). All readings falling on zone B were near the A/B border. There were no readings in the C, D, or E zones. Of the EasyTouch readings, 98.3%, 91.9%, 78.3% and 46.9% were within F20%, F15%, F10%, and F5%, respectively, of the reference values. The total readings were separated into three glucose ranges (V100, 101–200, and z201 mg/dl) for further analysis
(Table 1). The percentage of the readings deviating from the reference values within the defined interval was similar in the three glucose ranges: (1) nearly half of the readings (41.5–49.6%) were within 5% interval; (2) around one-third (30.6–35.4%) of the readings were within 5–10% interval; (3) about one-eighth (11.7–14.3%) of the readings were within 10–15% interval; (4) approximately one-fifteenth (5.8–7.7%) of the readings were within 15–20% interval; and (5) b2% (1.5–1.9%) of the readings were N20% of the reference values.
The manufacturer has indicated that the safe range of hematocrit for the measurement of blood glucose concentrations with EasyTouch was between 30% and 55%. According to this claim, 86 patients were not
Fig. 1. Error grid analysis of the EasyTouch monitoring system. EasyTouch readings were plotted against the YSI reference method.
Table 1
Number and percentage of EasyTouch readings within a defined interval according to the different glucose concentration ranges Percentage deviation from the reference value
Glycemic ranges b5% 5–10% 10–15% 15–20% N20% Total b100 mg/dl 27(41.5%) 23(35.4%) 9(13.8%) 5(7.7%) 1(1.5%) 65 101–200 mg/dl 147(46.8%) 96(30.6%) 45(14.3%) 20(6.4%) 6(1.9%) 314 N201 mg/dl 68(49.6%) 43(31.4%) 16(11.7%) 8(5.8%) 2(1.5%) 137
Total 242 162 70 33 9 516
Fig. 2. Bias plots showing the effect of hematocrit on the EasyTouch glucose readings: (a) low hematocrit (b30%); (b) normal hematocrit (30–55%); (c) high hematocrit (N55%).
eligible for the study. Of these patients, 65 had low hematocrit (b30%) and 21 had high hematocrit (N55%). The effect of hematocrit on glucose readings
was demonstrated using bias plots (Fig. 2). The
EasyTouch readings relative to the YSI reference values under the conditions of hematocrit b30% showed unacceptable results (approximately 26% of the EasyTouch readings N20% of the reference values) with a pronounced (92.3%) positive bias (Fig. 2a).
Under the conditions of normal (30–55%; Fig. 2b)
and high (N55%; Fig. 2c) hematocrits, respectively, 98.3% and 95.2% of the EasyTouch readings were within F20% interval of the reference values. The precision of the EasyTouch monitoring system is
shown in Table 2. At the six test glucose ranges,
coefficients of variation (CVs) for lot 1 to lot 4 ranged from 3.48% to 5.52%, from 2.10% to 4.80%, from 1.82% to 3.56%, and from 2.97%to 5.75%.
4. Discussion
EasyTouch is a bifunctional handheld device containing glucose and uric acid monitoring systems. It was recently introduced into the self-monitoring diagnostic market. Using electrochemical detection technique, EasyTouch glucose monitoring system was developed for rapid determination (b25 s) of glucose concentrations over a wide range of glucose concen-trations (20–600 mg/dl) from a small amount of capillary whole blood samples (approximately 4 Al). In order to determine if EasyTouch is a clinically acceptable device for measuring blood glucose con-centrations, we evaluated the clinical accuracy of the EasyTouch. The 516 EasyTouch readings covered a wide range of glucose concentrations (42 to 555 mg/ dl) suggesting that this study population was sufficient to represent a larger population of diabetic patients. Linear regression analysis showed that the EasyTouch readings correlated very well with the YSI reference
values over the range of glucose concentrations measured. The error grid analysis showed that Easy-Touch glucose monitoring system had 100% of measurements in zones A and B suggesting that EasyTouch is a clinically acceptable device for blood glucose measurements.
Other analysis in determining the accuracy of self-monitoring system was expressed by the percentage of deviation from the reference value. One standard for accuracy evaluation was proposed by the International Organization for Standardization (ISO), which rec-ommended that 95% of the measurements should be within F20% of the reference values for glucose concentrations N100 mg/dl and within F20 mg/dl for
glucose values b100 mg/dl [19]. Our results showed
that 98.3% of the EasyTouch readings were within
F20% interval indicating that EasyTouch met the
accuracy criteria proposed by ISO. The other standard for accuracy evaluation was proposed by the Amer-ican Diabetes Association (ADA), which recommen-ded that 100% of readings should be within F5% of
the reference values [20]. However, none of the
glucose meters can reach this stringent goal[21–23]. The accuracy of self-monitoring glucose meters reported previously showed: (1) 56% and 74% of the readings were within F10% and F15%, respec-tively, of the reference values [24]; (2) 45.6%, 25%, 14% of readings deviated from the reference values by N10%, 15%, and 20%, respectively[25]; (3) only 15– 25% of the readings reached the criteria of within
F5% of the reference method[13]. An improvement
on the newer generation of self-monitoring meters was evident on a previous study, which indicated an increase from about 33% (older meters) to approx-imately 50% (newer meters) of readings within F5%
of the reference values [22]. The present study
showed that about 50% of the EasyTouch readings met the ADA stringent goal (F5%) suggesting that EasyTouch is an improved monitoring system. In addition, self-monitoring glucose meters have been
Table 2
The CVs (%) for measurements in series for six different glucose concentration ranges
Lots of strips 43–56 mg/dl 83–90 mg/dl 148–158 mg/dl 245–264 mg/dl 354–371 mg/dl 422–470 mg/dl
1 5.33 4.73 4.04 4.50 5.52 3.48
2 4.80 4.18 3.07 2.28 2.10 2.96
3 3.09 3.17 2.06 3.64 1.82 3.56
classified into groups of good, acceptable, and unacceptable for clinical use[26]. The bgoodQ meters was defined if N60% of the readings within F10% of the reference value. Thus, EasyTouch should be classified as a bgoodQ meter based on the result that EasyTouch had 78% of the readings within F10% interval. Besides, the percentage of readings within the defined interval was similar in three glucose concen-tration ranges (low, medium and high) suggesting that the system performance of EasyTouch was consistent over a wide range of glucose concentrations.
It should be noted that the manufacturer has limited a hematocrit range (30–55%) for the best performance of EasyTouch glucose monitoring system. With respect to the reference values, low hematocrit was associated with overestimation of glucose concentra-tions. No observable influence on the EasyTouch measurement was evident at the high hematocrit. The CVs between the EasyTouch measurements and the YSI reference values were within the satisfactory interval (b6%) suggesting that EasyTouch monitoring system provided precise measurements. In conclusion, we demonstrated that EasyTouch is a device providing high accurate and precise glucose readings and should be rated as bimproved meterQ or bgood meterQ.
References
[1] World Health Organization. The global strategy on diet, physical activity and health: fact sheet—diabetes (2003). [2] American Diabetes Association. Economic costs of diabetes in
the U.S. in 2002. Diabetes Care 2003;26:917 – 32.
[3] The Diabetes Control and Complications Trial Research Group. The effect of intensive treatment of diabetes on the development and progression of long-term complications in insulin-dependent diabetes mellitus. N Engl J Med 1993;329:977 – 86.
[4] Sonksen PH, Judd SL, Lowy C. Home monitoring of blood-glucose. Method for improving diabetic control. Lancet 1978;1:729 – 32.
[5] Walford S, Gale EA, Allison SP, Tattersall RB. Self-monitor-ing of blood-glucose. Improvement of diabetic control. Lancet 1978;1:732 – 5.
[6] Ikeda Y, Tsuruoka A. Self-monitoring of blood glucose, as a means of self-management. Diabetes Res Clin Pract 1994;S269 – 71 [Suppl].
[7] Evans JM, Newton RW, Ruta DA, MacDonald TM, Stevenson RJ, Morris AD. Frequency of blood glucose monitoring in relation to glycaemic control: observational study with diabetes database. BMJ 1999;319:83 – 6.
[8] Franciosi M, Pellegrini F, De Berardis G, Belfiglio M, Cavaliere D, Di Nardo B, et al. The impact of blood glucose self-monitoring on metabolic control and quality of life in type 2 diabetic patients: an urgent need for better educational strategies. Diabetes Care 2001;24:1870 – 7.
[9] Tate PF, Clements CA, Walters JE. Accuracy of home blood glucose monitors. Diabetes Care 1992;15:536 – 8.
[10] Kilpatrick ES, McLeod MJ, Rumley AG, Small M. A ward comparison between the One Touch II and Glucometer II blood glucose meters. Diabet Med 1994;11:214 – 7. [11] Trajanoski Z, Brunner GA, Gfrerer RJ, Wach P, Pieber TR.
Accuracy of home blood glucose meters during hypoglycemia. Diabetes Care 1996;19:1412 – 5.
[12] Arens S, Moons V, Meuleman P, Struyf F, Zaman Z. Evaluation of glucocard memory 2 and Accutrend sensor blood glucose meters. Clin Chem Lab Med 1998;36:47 – 52. [13] Rheney CC, Kirk JK. Performance of three blood glucose
meters. Ann Pharmacother 2000;34:317 – 21.
[14] Solnica B, Naskalski JW, Sieradzki J. The evaluation of analytical performance of the Precision G point-of-care glucometer. Clin Chem Lab Med 2001;39:1283 – 6. [15] Alto WA, Meyer D, Schneid J, Bryson P, Kindig J. Assuring
the accuracy of home glucose monitoring. J Am Board Fam Pract 2002;15:1 – 6.
[16] Demers J, Kane MP, Bakst G, Busch RS, Hamilton RA. Accuracy of home blood glucose monitors using forearm blood samples: FreeStyle versus One Touch Ultra. Am J Health-Syst Pharm 2003;60:1130 – 5.
[17] Cox DJ, Clarke WL, Gonder-Frederick L, Pohl S, Hoover C, Snyder A, et al. Accuracy of perceiving blood glucose in IDDM. Diabetes Care 1985;8:529 – 36.
[18] Clarke WL, Cox D, Gonder-Frederick LA, Carter W, Pohl SL. Evaluating clinical accuracy of systems for self-monitoring of blood glucose. Diabetes Care 1987;10:622 – 8.
[19] ISO/CD 15197: Determination of performance criteria for in vitro blood glucose monitoring systems for management of human diabetes mellitus. Geneva7 ISO Central Secretariat; 2001.
[20] American Diabetes Association. Self-monitoring of blood glucose (consensus statement). Diabetes Care 1996;19(Suppl 1):S62 – 6.
[21] Brunner GA, Ellmerer M, Sendlhofer G, Wutte A, Trajanoski Z, Schaupp L, et al. Validation of home blood glucose meters with respect to clinical and analytical approaches. Diabetes Care 1998;21:585 – 90.
[22] Weitgasser R, Gappmayer B, Pichler M. Newer portable glucose meters—analytical improvement compared with pre-vious generation devices? Clin Chem 1999;45:1821 – 5. [23] Sacks DB, Bruns DE, Goldstein DE, Maclaren NK, McDonald
JM, Parrott M. Guidelines and recommendations for labora-tory analysis in the diagnosis and management of diabetes mellitus. Clin Chem 2002;48:436 – 72.
[24] Jones BA, Howanitz PJ. Bedside glucose monitoring quality control practices. A College of American Pathologists Q-Probes study of program quality control documentation, program characteristics, and accuracy performance in 544 institutions. Arch Pathol Lab Med 1996;120:339 – 45.
[25] Novis DA, Jones BA. Interinstitutional comparison of bedside blood glucose monitoring program characteristics, accuracy performance, and quality control documentation: a College of American Pathologists Q-Probes study of bedside blood glucose monitoring performed in 226 small hospitals. Arch Pathol Lab Med 1998;122:495 – 502.
[26] Poirier JY, Le Prieur N, Campion L, Guilhem I, Allannic H, Maugendre D. Clinical and statistical evaluation of self-monitoring blood glucose meters. Diabetes Care 1998;21: 1919 – 24.