行政院國家科學委員會專題研究計畫 成果報告
知覺群聚的神經生理基礎 : 整合神經造影與行為資料
(3/3)
研究成果報告(完整版)
計 畫 類 別 : 個別型 計 畫 編 號 : NSC 95-2413-H-002-001- 執 行 期 間 : 95 年 08 月 01 日至 96 年 07 月 31 日 執 行 單 位 : 國立臺灣大學心理學系暨研究所 計 畫 主 持 人 : 陳建中 共 同 主 持 人 : 王堯弘 計畫參與人員: 學士級-專任助理:張宛雯 博士班研究生-兼任助理:高千惠 博士後研究:簡惠玲 處 理 方 式 : 本計畫可公開查詢中 華 民 國 96 年 10 月 26 日
1
Final report
The Neurophysiological Foundation of Perceptual Grouping
95-2413-H-002-001
Chien-Chung Chen
Department of Psychology, National Taiwan University
1. Narrative of research outcome Background
Perceptual grouping refers to the phenomenon that a human observer integrates image components together to form a percept of a new object. This phenomenon reflects the synthesis processes in the visual system that combine the image elements extracted by V1 neurons to a coherent percept of objects.
Early studies of perceptual grouping, under the influence of Gestalt Psychology, focused on so called perceptual grouping laws which supposedly dictate how an observer perceives a set of line-drawing figures as separate groups. For instance, the Law of Similarity states that figures that are similar
to each tend to each are often perceived as belonging to the same group and the Law of Proximity states that figures that are close to each other tend to be perceived as belonging to the same group while figures far away does not. Gregory (1966) and Kanizsa (1979) thoroughly reviewed the early works.
The purpose of this project is to probe the neurophysiological basis of perceptual grouping in the context of a hierarchical processing model. A
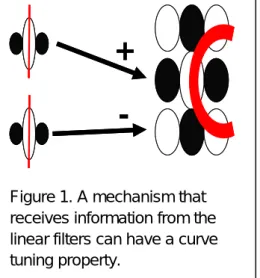
+
-+
-Figure 1. A mechanism that receives information from the linear filters can have a curve tuning property.
2 hierarchical processing model
suggests that (1) the visual system contains several stages of visual information processing; (2) each stage of visual processing tunes to specific visual features; (3) each stage of visual processing integrates information from the preceding stage;
and (4) in turn tunes to more complicate features than the preceding stage. For instance, Simple cells in the primary visual cortex have a receptive field with elongated excitatory and inhibitory regions. A complex cell with an end-stopping property can be modeled as receiving inputs from simple cells whose receptive fields were collinear and lateral to each other and tuned to opposite sign of luminance modulation (Figure 1). Such complex cells have a receptive field with several excitatory regions with certain spatial offset from each other. As a result, such cell can signal not only line segments but also curve fragments (Wilson, 1985; Wilson & Richards, 1989, 1992). The perceptual
grouping is such combination of neural activation expressed at the behavioral level. The hierarchical processing is important in higher level object processing. There is evidence that the object recognition performance is based on object components and their
relations. The famous geon theory (Biederman, 1987) and cylinder model (Marr, 1982) of object perception are just two examples.
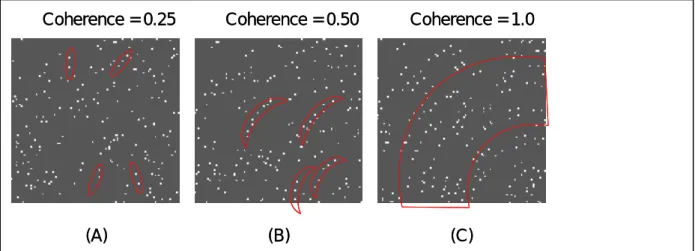
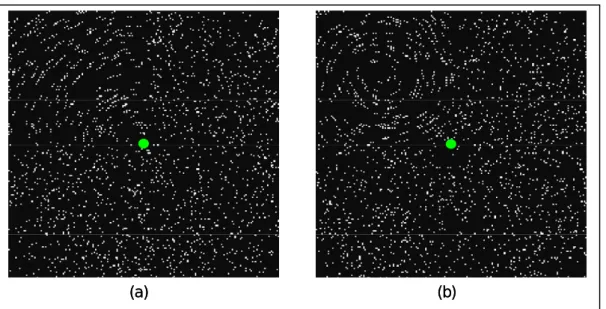
In this project, we probe this hierarchical perceptual grouping process with Glass patterns (Glass, 1969). Figure 2 shows examples of Glass patterns. A Glass pattern consists of randomly distributed dot pairs (dipole) with their orientation determined by a geometric transform. To perceive the structure in a Glass pattern, the visual system has to first link neighboring dots to form dipoles and then link dipoles to form the global structure. These two grouping processes seem to have different properties as the first stage mostly depends on the distance between neighboring dots (Dakin, 1997) while the second stage depends on the relative orientations among dipoles (Dakin, 1997; Wilson et al.,1997; Cardinal & Kiper, 2003). In addition, these two stages of grouping may be separable. As shown in Figure 3(b), in a Glass pattern with low coherence
3
(coherence is defined as the proportion of dipoles that conforms the predesignated mathematic transforms) it is quite difficult for an observer to detect the global structure. However, the observer should have little difficult to perceive dipoles in such low
coherent pattern. Hence, the first grouping stage is separable from the second stage. In addition, since the second stage of grouping is impossible without the first stage, there seem to be a hierarchical arrangement among different grouping stages.
Different stages of perceptual grouping may be revealed by functional magnetic resonance imaging (fMRI). An fMRI experiment measured blood oxygenation level dependent (BOLD) signal change in the brain. The localized BOLD signal is correlated with the neural activity in that particular area (Logothesis et al. 2001). If we require an observer to perform a task that requires perceptual grouping, the BOLD signal should increase in the brain areas that are responsible for grouping.
We tested the hypothesis that perceptual grouping involves multiple stages in a sequence and different stages may be processed by different areas. One of our
strategies is to measure the BOLD activation as a function of the visibility of Glass patterns. The visibility of a Glass pattern may be affected by several factors, including coherence, luminance contrast and orientation jitter of the dipoles. If a brain area is related to the global form perception, its activation should change with the visibility of the global structure of the Glass patterns when the visibility of local elements is kept
Coherence = 0.25 Coherence = 0.50 Coherence = 1.0
(A) (B) (C)
Coherence = 0.25 Coherence = 0.50 Coherence = 1.0
(A) (B) (C)
Figure 3. Glass patterns at different coherence levels activated different feature detectors. See text for detail
4
constant. On the other hand, a brain area responsible for the local grouping should has its response correlated with the visibility of local dipoles regardless what the
predesignated global structure is.
Study 1: The effect of coherence
The coherent level is defined as the proportion of dipoles with orientation determined by a geometric rules that required by the Glass pattern. For instance, a concentric Glass pattern with a coherent level of 75% will have 75% of dipoles with orientation tangent to a circle while 25% of dipoles are randomly orientated. A Glass pattern at a low coherent level, as shown in panel (A) of Figure 3, can only activate oriented filters that respond to the dipoles. As the coherent level increases, the pattern may contain enough curve fragments to activate local curvature detectors (Fig 3 (B)). However, only Glass patterns with very high coherent levels have sufficient information to activate the global shape detector. Hence, different brain areas should have different dynamic range in coherence. An area for line detection should have the same activation regardless the coherent level and therefore should saturate even at very low coherent levels. Areas for curve processing should begin to respond and saturate at moderate coherent levels where the Glass patterns contain sufficient amount of curve fragments. Finally, areas with global form detectors saturate only when the global is good enough. Therefore, the dynamic range of the coherence response function indicates the stage of perceptual grouping.
Method.
Stimuli. A Glass pattern consisted of 1’x1’ random dots. The size of the image
was 10o x 10o or 600x600 possible dots. The density of dots was 0.04. Half of dots of the Glass pattern was generated with a random number generator and distributed evenly in space. The other half is a shifted copy of the first half. The direction and the size of the shift were determined by the desired global structure. For a concentric pattern, the shift was achieved by rotating the first dot set about the center of the image by 7’. Hence, the orientation of each dipole was tangent to an imagery circle. For a
5
radial Glass pattern, the shift was achieved by moving the first dot sets away from the center of the image by 7’. The zero coherence patterns had each dot in the second dot set shifted away from the corresponding dots in the first set in a random direction. The coherence of a Glass pattern was defined as the proportion of dipoles oriented tangent to a concentric global form. We used five coherent levels, 1.0, 0.87, 0.75, 0.63, and 0.5 in the test conditions and 0 coherence (completely random) in the control condition.
Data acquisition. BOLD activation was collected on a Bruker 30/90 Medspec 3T
scanner (Bruker Medical, Ettlingen, Germany) with a cylindrical head coil. The scanner is located in National Taiwan University. The functional scan (T2*-weighted, BOLD) and anatomical (T1-weighted, 256 x 256) was acquired in identical planes. The images were collected in 15 or 18 transverse planes parallel to the AC-PC (anterior commissure-posterior commissure) line with a 30cm FOV and an image matrix of 128 x 128. An Echo-planar imaging sequence (Stehling, Turner & Mansfield, 1991) will be used to acquire the functional data (TR = 3000ms, TE = 60ms, flip angle = 90o, voxel resolution = 2.34 x 2.34 x 3mm).
Procedure. Each of the six block design run had one Glass pattern at one of the six
coherences alternated with their zero coherence counterparts in a 36s period. There were six periods in each run. There were nine second (3TR) burning scans ahead of each run that were not included in data analysis. Totally, there were 252s in each run.
Data analysis. We used SPM99 software (Friston et al., 1995) to correct for head
movement for each functional scan session. The corrected functional images were then coregistered with the T1-weighted images of the same observer. Both functional and T1-weighted images were normalized to the standard template. The normalized functional images from the same conditions were then averaged across observers.
The analysis of functional data was based on a spectral correlation algorithm (Engel et al., 1997). Since our experiments were block designs with six periods, the correlation coefficient of one voxel is essentially the amplitude of the sixth harmonic of the Fourier spectrum normalized by the total Fourier amplitude of that voxel time series. If the spectral correlation of a voxel is greater than 0.475 (t(70)=5.132, uncorrected α ~
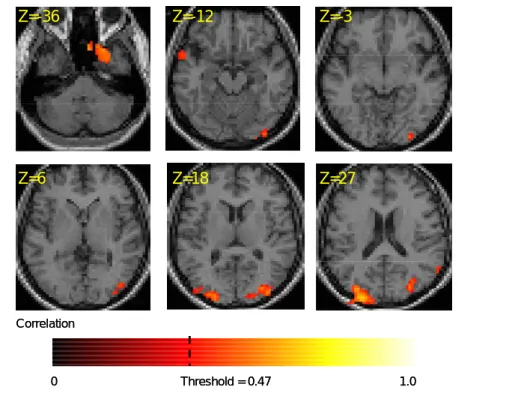
6 Z=-36 Z=-12 Z=-3 Z=6 Z=18 Z=27 Correlation 0 Threshold = 0.47 1.0 Z=-36 Z=-12 Z=-3 Z=6 Z=18 Z=27 Correlation 0 Threshold = 0.47 1.0
Figure 4. Brain activation map for Glass patterns. The pseudo-color denotes the correlation level. The z values denote elevation from the anterior commissure
1x10⁻⁶), the activation of this voxel was considered as driven by the experimental condition. The activated voxels were marked with pseudo-color and overlaid on T1 weighted images and a 3D rendering of the averaged brain. The 3D rendering is made with Vista software (Wandell et al., 2000) provided by Stanford University.
Result and discussion.
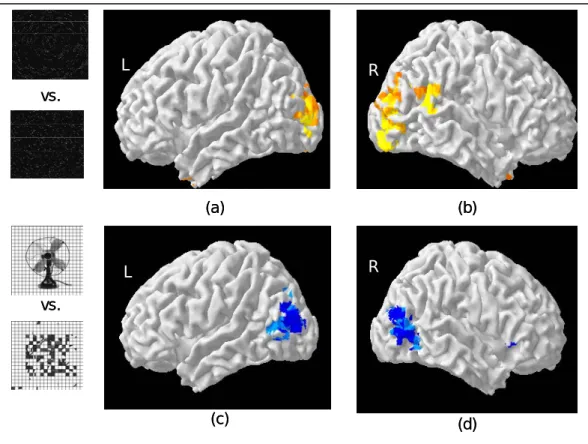
Figure 4 shows activation map for Glass patterns. The pseudocolored patches denote the voxels showing significant (|r| > 0.45) differential activation between Glass patterns and the zero coherence controls. Compared with the zero coherence control, the Glass pattern activated the middle occipital gyrus, the inferior temporal gyrus and the supramarginal gyrus. Panel a and b of Figure 5 shows this activation pattern on a 3D rendered cortical surface. We compared this activation pattern to the known function area of the lateral occipital complex (LOC). The LOC was mapped with the image of common objects and their scrambled versions. The LOC is shown as bluish patches in
7
Figure 5 c and d. There were a lot overlap between the activation pattern for the Glass pattern and the LOC. However, the center of activation for the Glass pattern is posterior to that of the LOC. This activation pattern for Glass pattern would be used as a reference for the subsequent experiments.
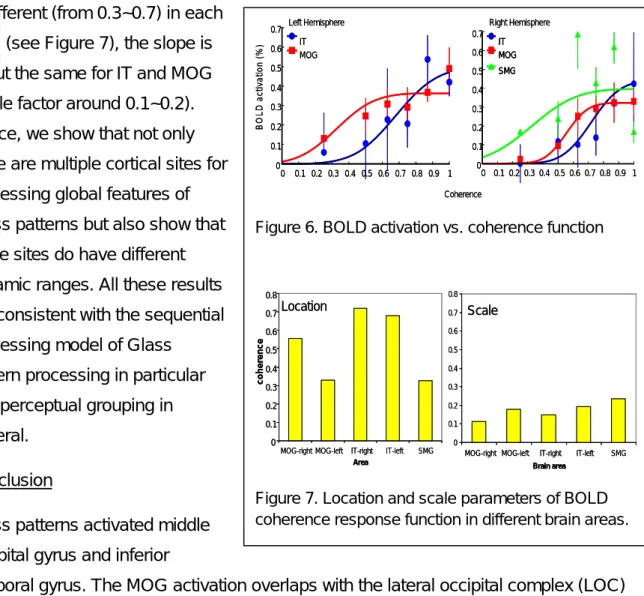
The activation time series in each area was fitted with a sinusoidal function. The amplitude of the sinusoidal function is then taken as the response strength in that area. Figure 6 shows the averaged coherence response function for six observers. The error bars in Figure 6 denote the inter-observer standard deviation. The response functions were fitted by a cumulated Gaussian functions with the mean representing the location and the scale (“standard deviation”) representing the slope of the response functions (lager scale factor means shallower slope). While the location of the response function
R L L R vs. vs. (a) (b) (c) (d) R L L R vs. vs. (a) (b) (c) (d)
Figure5. A comparison between activation pattern for Glass patterns (panel a and b) and the lateral occipital complex as mapped by differential activation between pictures of objects and there scrambled versions.
8 is different (from 0.3~0.7) in each
area (see Figure 7), the slope is about the same for IT and MOG (scale factor around 0.1~0.2). Hence, we show that not only there are multiple cortical sites for processing global features of Glass patterns but also show that these sites do have different dynamic ranges. All these results are consistent with the sequential processing model of Glass
pattern processing in particular and perceptual grouping in general.
Conclusion
Glass patterns activated middle occipital gyrus and inferior
temporal gyrus. The MOG activation overlaps with the lateral occipital complex (LOC) as identified by the activation to pictures of objects. The LOC activation increased with the coherence of the Glass pattern. The slopes of the response functions were similar in different brain areas. This suggested that the position uncertainty is not important in perceiving Glass patterns. Overall, we demonstrated here that the LOC is related to the processing of the global structure in a Glass pattern.
Study 2. Separating local and global grouping processes
After identifying the brain areas for global structure of Glass patterns, we then made an effort to separate different levels of global processing as well as to identify the areas for local grouping. As shown earlier, there are at least three stages of processing
0 0.1 0.2 0.3 0.4 0.5 0.6 0.7 0.8 0.9 1 0 0.1 0.2 0.3 0.4 0.5 0.6 0.7 B O LD ac ti v a ti o n ( % ) IT MOG Left Hemisphere 0 0.1 0.2 0.3 0.4 0.5 0.6 0.7 0.8 0.9 1 0 0.1 0.2 0.3 0.4 0.5 0.6 0.7 Coherence IT MOG SMG Right Hemisphere 0 0.1 0.2 0.3 0.4 0.5 0.6 0.7 0.8 0.9 1 0 0.1 0.2 0.3 0.4 0.5 0.6 0.7 B O LD ac ti v a ti o n ( % ) IT MOG Left Hemisphere 0 0.1 0.2 0.3 0.4 0.5 0.6 0.7 0.8 0.9 1 0 0.1 0.2 0.3 0.4 0.5 0.6 0.7 Coherence IT MOG SMG IT MOG SMG Right Hemisphere
Figure 6. BOLD activation vs. coherence function
0 0.1 0.2 0.3 0.4 0.5 0.6 0.7 0.8
MOG-right MOG-left IT-right IT-left SMG
Area coher e nc e 0 0.1 0.2 0.3 0.4 0.5 0.6 0.7 0.8
MOG-right MOG-left IT-right IT-left SMG
Brain area Location Scale 0 0.1 0.2 0.3 0.4 0.5 0.6 0.7 0.8
MOG-right MOG-left IT-right IT-left SMG
Area coher e nc e 0 0.1 0.2 0.3 0.4 0.5 0.6 0.7 0.8
MOG-right MOG-left IT-right IT-left SMG
Brain area
Location Scale
Figure 7. Location and scale parameters of BOLD coherence response function in different brain areas.
9
for Glass patterns: dipole, curve and global shape. The purpose of this study was to identify the brain areas for each of the stage.
Experiment 2.1&2: Activation to curves and forms
Method
The data acquisition and analysis were the same as the study 1. The way to create Glass patterns is the same as that in the study 1. In addition, In the curve condition, the stimuli were consisted of a quarter of the concentric Glass pattern in one quadrant and zero-coherence pattern in the other three quadrants (Fig 8a). The quadrant showing Glass curves rotated 90o clockwise every nine seconds (3TR). It took 36 s for the Glass curves to rotate a full cycle and there were six cycles in one experimental run. For a fair comparison, the shape condition has the same spatio-temporal configuration as the curve condition except that there is a concentric Glass pattern in place of Glass curve in the designated quadrant (Fig 8b).
(a) (b)
(a) (b)
10 Result and discussion
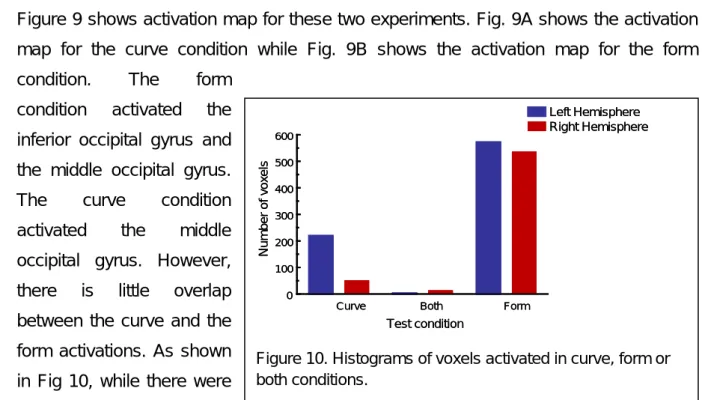
Figure 9 shows activation map for these two experiments. Fig. 9A shows the activation map for the curve condition while Fig. 9B shows the activation map for the form condition. The form
condition activated the inferior occipital gyrus and the middle occipital gyrus. The curve condition activated the middle occipital gyrus. However, there is little overlap between the curve and the form activations. As shown in Fig 10, while there were
Curve Both Form
0 100 200 300 400 500 600 Test condition Num b er of v o x e ls Left Hemisphere Right Hemisphere
Curve Both Form
0 100 200 300 400 500 600 Test condition Num b er of v o x e ls Left Hemisphere Right Hemisphere
Figure 10. Histograms of voxels activated in curve, form or both conditions. Correlation 0 1.0 Threshold = 0.4 (a) (b) Correlation 0 1.0 Threshold = 0.4 (a) (b)
11
hundreds of voxels activated in either the curve or the form condition, there were only about 20 voxels showing activation in both conditions. In general, areas activated by the form condition were anterior and ventral to those activated by the curve condition.
vs.
(a)
(b)
(c)
(d)
vs.
(a)
(b)
(c)
(d)
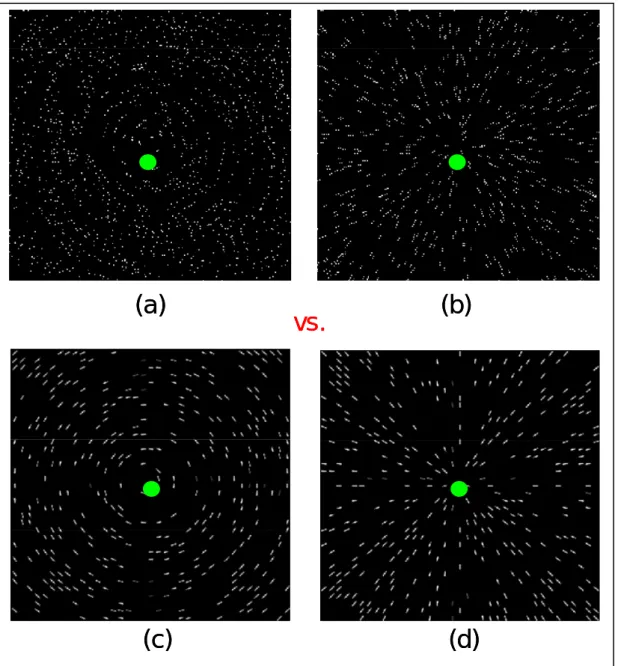
Figure 11. Examples of stimuli used in the dipole summation experiments. (a) & (b): Glass patterns. (c) & (d): texture patterns.
12
Experiment 2.3 Brain areas for local grouping
In order to perceive a Glass pattern, an observer has to first integrate neighboring dots to form dipoles. The experiment reported here is to investigate the activation pattern for this stage.
Method
This experiment contrasted the brain activation to Glass patterns and texture patterns. As shown in Figure 11, the Glass patterns were concentric and radial Glass patterns as described in the method section. The texture patterns has the same global structure as the Glass pattern, however, there were Gaussian bars in place of dot dipoles. The half height full width of a Gaussian bar was 5’ wide and 25’ long. By using Gaussian bars, we eliminated the need for local grouping at the dipole level. Hence, the
(a) (c) (b) (a) (c) (b)
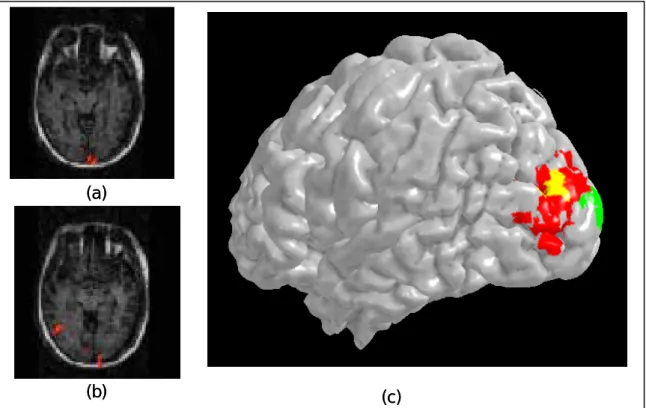
Figure 12. (a) & (b) psudo-color patches show the areas with differential activation in the dipole summation. (c) Comparison between the dipole activation and global Glass pattern activation. The Green patches denote the areas showing differential in dipole condition; the red patches, the area for the Glass patterns; and the yellow patches, the areas showing activation in both experiments.
13
brain areas showing differential activation for these two conditions should be responsible for local grouping.
Result and discussion
The differential activation occurred both at the medial and the lateral occipital surfaces (Fig 12a and b). The medial surface activation was at the primary visual cortex. This activation is not surprising given that the local difference between the Glass pattern and the texture pattern conditions matches the localization properties of the neurons in the primary visual cortex. The activated area at the lateral surface overlapped with that for the Glass pattern itself. The Green patches in Fig 12c denote the areas showing differential activation between the Glass pattern and the texture patterns. The red patches denote the area showing differential activation between the Glass pattern and its zero coherence control. The yellow patches are the areas showing activation in both experiments. The overlapped area is at the dorsal proportion of the Glass pattern
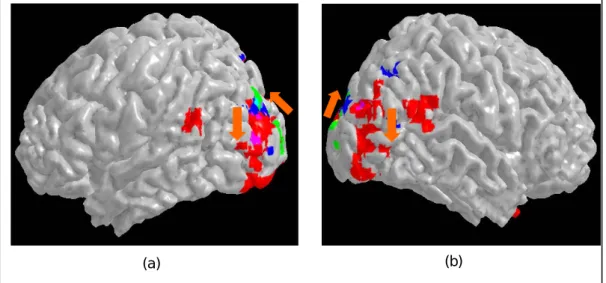
(a) (b)
Figure 13. Summary of the three experiments. The green patches denote the voxels showing differential activation between the Glass pattern and the texture patterns. The blue patches denote voxels showing significant activation in the curve condition and the red denotes voxels activated in the form condition.
14
activation. The significance of the dorsal activation will be discussed below.
Conclusion for Study 2: Evidence for Hierarchical Processing in Form Perception
Figure 13 sums up the result of the three experiments reported here. The green patches denote the voxels showing differential activation between the Glass pattern and the texture patterns. Hence, those are voxels responsible for local dipole grouping. The blue patches denote voxels showing significant activation in the curve condition and the red denotes voxels activated in the form condition. It is obvious that the voxels activated by the dipole condition are either posterior or dorsal to those activated by the curve and the form conditions. The voxels activated by the curve conditions are either posterior or dorsal to those activated by the form condition. Given that the dipole, curve and form condition each targets a stage, from local to global, in form perception processing, we can conclude that the flow of the ventral stream, from local to global, goes from posterior to anterior and from ventral to dorsal on the lateral occipital surface.
Study 3: A computational model for local grouping
The motivation of this model is two folds. The first motivation was from the single
L M S L M S L M S Cone
contrast Linear filter
E1’= Se1,LCL+ Se1,MCM+ Se1,SCL Σ Normalization pool CL CM CS Pooling linear excitation across orientation and chromatic channels E2’ E3’ Filter excitation as cone contrast weighted by filter sensitivity Ij=Σi(wiEij)q wsEs woEo woEo Divisive inhibition Rj= Ejp/(I+z) Decision factor D=(ΣjRj4)0.25 Halfwave rectification E1=max(E1’,0) E2 E3 Coherence threshold 1/D 4-th power pooling law
Assume that all global factors are constants L M S L L M M S S L M S L L M M S S L M S L L M M S S Cone
contrast Linear filter
E1’= Se1,LCL+ Se1,MCM+ Se1,SCL Σ Normalization pool CL CM CS Pooling linear excitation across orientation and chromatic channels E2’ E3’ Filter excitation as cone contrast weighted by filter sensitivity Ij=Σi(wiEij)q wsEs woEo woEo Divisive inhibition Rj= Ejp/(I+z) Decision factor D=(ΣjRj4)0.25 Halfwave rectification E1=max(E1’,0) E2 E3 Coherence threshold 1/D 4-th power pooling law
Assume that all global factors are constants
15
cell recording study. (Smith et al., 2002) measured the responses of V1 cell to Glass patterns. They found that the V1 cells responded to the Glass patterns only when their receptive field overlapped with one of the dipoles in a Glass pattern. In addition, the respond amplitude was independent of the global form of the Glass pattern. Hence, their result implies that V1 cells may be underlying local grouping in a Glass pattern. V1 neurons have long been considered as underlying contrasts detection and
discrimination (Heeger, 1992). If V1 neurons are underlying both contrasts
discrimination and local grouping, we should expect that the same computational model should be able to fit data from both kinds of experiment. The second motivation was recent experiment on the luminance contrast effect on local grouping. Wilson, Switke & De Valois (2004) changed the contrast ratio of two dots in a dipole of a Glass pattern. They then measured the coherence level at which an observer could tell the difference between a Glass pattern and display of random dots (coherence threshold). They showed that the coherence threshold was lowest when the contrast ratio between the two dots was 1:1 regardless their absolute contrast. This result implied that a contrast gain control mechanism was involved in local grouping and hence should be taken into account.
Figure 14 shows a diagram of this model. The first stage of this model is the retinal mechanisms that analyze the luminance contrast in an image. There are three types of cones on the retina each with a different spectral sensitivity, called L (long wavelength), M (medium wavelength), and S (short wavelength) cones. As a result, they were able to signal the chromaticity modulation in an image. Mathematically, it is
equivalent to represent the chromaticity and contrast of each dot in terms of cone contrast CL, CM, and CS of L, M and S cones. The cortical simple cells take input from
retinal mechanisms. Their receptive property represents a localized linear filter operated on the image. As shown before (Chen, Foley & Brainard, 2000), the excitation of the filters is equivalent to a linear combination of cone contrast. That is, the excitation of the i-th linear filter to a dot a in a Glass pattern is
16
where SeL,j is the sensitivity of the j-th mechanism to L-cone contrast and CL,a is the
L-cone contrast of the dot a. SeM,j, SeS,j,CM,a, and CS,a are defined in a similar way for M-
and S-cone respectively. If the receptive field covered both dots in a dipole, say, dot and dot b, the excitation becomes
Ej’ = Ej,a’ + Ej,b’ (2)
Since the cortical neurons do not have maintaining discharge, the excitation was rectified. That is, the rectified excitation is
Ej = max(Ej’,0) (3)
The response of the j-th mechanisms is the linear excitation divided by a divisive inhibition signal plus a constant. That is, the response of the j-th mechanism is
Rj = Ejp/Ij+σ (4)
where p is an exponent for the excitation, Ij is the divisive inhibition to the j-th
mechanism and σ is an additive constant.
The divisive inhibition, also called normalization signal (Heeger, 1992) comes from the excitation of other linear filters. There are many filters in the visual system. Let us consider the linear filters whose receptive overlapped with one dipole. There is one filter that matches the orientation of that dipole and hence overlaps with both dots. Its
excitation is as defined by Eq. (2). There are many filters with a orientation that does not match the orientation of the dipole. As a result, they may only overlap only one dot in the dipole. Their excitations are defined by Eq (1). Those non-optimal filters do not have as strong excitation as the optimal filter. However, they do contribute to a normalization pool. The normalization pool to the j-th mechanism is
Ij = wj (Ej,aq + Ej,bq) + wkΣk(Ek,aq + Ek,bq) (5)
where Ej,a and Ej,b is the rectified excitation of the j-th cone contrast mechanism to dot a
and b in a dipole, Ek,a and Ek,b are the rectified excitation of the k-th mechanisms, and wj
and wk are the weighs of the contribution of the j-th and k-th mechanisms to the
17
Here, we kept all the global factors constant. Hence, the decision factor can be modeled as a pooled of local mechanism response. That is, with Quick’s pooling rule, the decision factor is
D = Σj (Rj4)1/4 (6)
The coherence threshold is inversely proportional to the decision factor D.
The fit of the model is shown as smooth curves in Figure 15 and pseudo-color surfaces in Figure 16.
Experiment 3.1: Chromaticity and contrast effect on local grouping
Method
Stimuli. A Glass pattern consisted of 1’x1’ random dots. The size of the image was 10o x
10o or 600x600 possible dots. The density of dots was 0.04. Half of dots of the Glass pattern was generated with a random number generator and distributed evenly in space. The other half is a shifted copy of the first half. The direction and the size of the shift were determined by the desired global structure. The distance of the shift was 7’. The shift was tangent to a spiral function r=mθ with m =+/-0.1. The spiral with a positive m gave a clockwise spiral while a negative m a counterclockwise spiral. The coherence was defined as the proportion of the dipole obeying this transform. The chromaticity of the dipole is defined in MB-DKL color space (DKL) with elevation represented
luminance modulation and the azimuth represented chromaticity modulation. The contrast is defined by a Euclidean distance of individual one contrast. That is C=(CL+
CM+ CS)1/2.
Procedure. In each condition, we fixed the chromaticity and contrast of one dot
(reference) in the dipole and change the chromaticity and contrast of another dot (test). We then measured the coherence threshold for each pair. We used a two-alternative forced-choice design. In each trial, the observer was asked to determine whether a Glass presented was clockwise or counterclockwise.
18 Result and discussion
Figure 15 shows how contrast ratio affecting coherence threshold for discriminating Glass patterns. Basically, when both the reference and the test are isochromatic (elevation=0o in the MBDKL color space), the coherence threshold is lowest when both dots are of the same contrast. However, when both dots are isoluminance (elevation=0o in the MBDKL color space), the threshold decreased monotonically as contrast increased. The smooth curves are fits of the model discussed above. This result can be readily explained by the model. As the test contrast increased, it contributed not only to the excitation of the optimal filter, but also to the divisive inhibition pools. When the test contrast is low, the denominator of the response function is dominated by the additive constant and the excitation to the reference. Hence, the contribution of the test contrast is mainly in nominator, i.e., the excitation of the linear filter. Hence, the threshold decreased with test contrast. However, when the test contrast was greater than the reference contrast, the test contrast played an important role in the response function through the divisive inhibition. Hence, with the test contrast increased, the divisive inhibition also increased. As a result, the threshold increased with test contrast. The difference between the isochromatic and the isoluminance conditions are readily explained by the fact that a human observer is much less to the luminance contrast than chromatic contrast (Wyszecki & Stiles, 1982). As a result, compared to the additive
Test contrast (dB) -25 -20 -15 -10 -5 0 0 0.2 0.4 0.6 0.8 1 C ohe re n c e th re shol d -6dB -10dB -14dB -18dB CCC Reference: (0o, 90o) Test: (0o, 90o) -30 -25 -20 -15 -10 -5 0 0.2 0.4 0.6 0.8 1 Test Contrast (dB) CCC Reference: (0o, 0o) Test: (0o, 0o) Test contrast (dB) -25 -20 -15 -10 -5 0 0 0.2 0.4 0.6 0.8 1 C ohe re n c e th re shol d -25 -20 -15 -10 -5 0 0 0.2 0.4 0.6 0.8 1 C ohe re n c e th re shol d -6dB -10dB -14dB -18dB -6dB -10dB -14dB -18dB CCC Reference: (0o, 90o) Test: (0o, 90o) CCC Reference: (0o, 90o) Test: (0o, 90o) -30 -25 -20 -15 -10 -5 0 0.2 0.4 0.6 0.8 1 Test Contrast (dB) -30 -25 -20 -15 -10 -5 0 0.2 0.4 0.6 0.8 1 Test Contrast (dB) CCC Reference: (0o, 0o) Test: (0o, 0o) CCC Reference: (0o, 0o) Test: (0o, 0o)
19
constant, the divisive inhibition never contributed much to the response function. Hence, the threshold always decreased with test contrast.
Figure 16 shows the effect of chromaticity tuning on the isoluminance plane. It is obvious that there are two distinct channels on the isoluminance plane with different tuning function (Fig 6a). The tuning function was contrast dependent Fig 6 b, c). The
RYT RYT CCC CCC Azimuth (o) 0 23 45 67 90 Azimuth (o) 0 23 45 67 90 Azimuth (o) 0 23 45 67 90 Azimuth (o) 0 23 45 67 90 Test con tr a s t (d B ) -10 -30 -20 -15 -25 -10 -30 -20 -15 -25 Squared: measurements
-16dB reference contrast -24dB reference contrast
0 102030 40 5060 7080 90 0 0.1 0.2 0.3 0.4 0.5 0.6 0.7 0.8 0.91 Azimuth (o) C o h e renc e t h re s h o ld 90o (S cone) 0o (M-L cone) Reference color RYT
Threshold equated contrast (10xthreshold)
Fitted color tuning map for (0,0) reference color
Coherence threshold 1.0 0 0.5
(a)
(b)
RYT RYT CCC CCC Azimuth (o) 0 23 45 67 90 Azimuth (o) 0 23 45 67 90 Azimuth (o) 0 23 45 67 90 Azimuth (o) 0 23 45 67 90 Azimuth (o) 0 23 45 67 90 Azimuth (o) 0 23 45 67 90 Azimuth (o) 0 23 45 67 90 Azimuth (o) 0 23 45 67 90 Test con tr a s t (d B ) -10 -30 -20 -15 -25 -10 -30 -20 -15 -25 -10 -30 -20 -15 -25 -10 -30 -20 -15 -25 Squared: measurements-16dB reference contrast -24dB reference contrast
0 102030 40 5060 7080 90 0 0.1 0.2 0.3 0.4 0.5 0.6 0.7 0.8 0.91 Azimuth (o) C o h e renc e t h re s h o ld 90o (S cone) 0o (M-L cone) Reference color RYT
Threshold equated contrast (10xthreshold)
Fitted color tuning map for (0,0) reference color
Coherence threshold 1.0
0 0.5
(a)
(b)
20
pseudo-colored are fits of the model while the squares are the measured data. The model fits the data well. The RMSE was about 0.10 across observers and was about the same as the measurement error.
Conclusion for Study 3
Contrast effect is chromatic dependent: When both dots were isochromatic, the lowest coherence threshold occurs when two dots agreed with each other in contrast. However, When both dots were isochromatic, the coherence threshold decreased with test contrast for all reference contrasts. On the other hand, chromatic effect is contrast dependent. The color tuning functions changes with both reference and test contrasts. We showed that An extension of a model for chromatic pattern detection (Chen, Foley & Brainard, 2000) can fit the data reasonably well. The RMSE was 0.089 and 0.012 for two observers, similar to measurement errors. Hence, local grouping in Glass patterns and pattern detection may be mediated by similar mechanisms.
General conclusion
In this series of studies, we used Glass patterns to explore the perceptual grouping processes. We first demonstrated that the lateral occipital complex is essential for perceptual grouping. Then, in Study 2, given the result from the three experiments which each targets t the dipole, curve and form stage, we can conclude that the flow of information in the LOC, from local to global, goes from posterior to anterior and from ventral to dorsal on the lateral occipital surface. Finally, using the psychophysical technique, we obtained empirical evidence helps us to determine the computational properties of perceptual grouping at dipole level. Based on these finding, this project makes significant contribution to our understanding of perceptual grouping and made a solid foundation for future studies.
2. Publication within the funding period Articles
21
Chen, C. C., Kao, K. C. & Tyler, C. W. (2007). Face configuration processing in the human brain: the role of symmetry. Cerebral Cortex, 17, 1423-1432.
Chen, C. C. & Tyler, C. W. (2006). Evidence for elongated receptive field structure for mechanisms subserving stereopsis. Vision Research, 46, 2691-2702.
Chen, C. C. Lin, S. Y., Han, H. Y. Kuo, S. T. & Huang K. C. (2006). Local luminance effect on spatial summation in the foveal vision and its implication on image artifact classification. SPIE Proceedings, 6507, 605703-1 -605703-9.
Liu, C. L., Hue, C. W., Chen, C. C., Chuang, K. H., Liang, K.C., Wang, Y.H., Wu, C.W., Chen, J.H.. (2006). Dissociated roles of the middle frontal gyri in the processing of Chinese characters. Neuroreport. 17:1397-1401
Tyler, C. W. & Chen, C. C. (2006). Spatial Summation of Face Information. Journal of
Vision, 6, 1117-1125.
Chen, C. C., Tyler, C. W., Liu, C. L. & Wang, Y. H. (2005). Lateral modulation of BOLD activation in unstimulated regions of the human visual cortex. Neuroimage, 24, 802-9.
Tyler, C. W., Likova, L. T., Chen, C. C., Kontsevich, L. L. Schira, M. M. & Wade, A. R. (2005). Extended Concepts of Occipital Retinotopy. Current Medical Imaging
Reviews, 1, 319-330.
Chen, C. C. & Foley, J. M. (2004). Pattern detection: Interactions between oriented and concentric patterns. Vision Research, 42, 915-24.
Conference presentation
Chen, C. C. & Kao, K. C. (2006). Visually evoked potentials correlate with global form processing. Program No. 604.7. 2006 Neuroscience Meeting. Atlanta, GA: Society for Neuroscience.
Chen, C. C. (2006). Local grouping in glass patterns: Chromatic and luminance tuning [Abstract]. Journal of Vision, 6(6), 759a.
Chen, C. C. & Han, H. Y. (2006). Retinotopic Responses to Glass Patterns in the Lateral Occipital Cortex. The 4-th Asian Conference on Vision.
Chen, K.-P., & Chen, C.-C. (2006). Cortical activation for 3D shapes constructed from different depth cues [Abstract]. Journal of Vision, 6(6), 253a.
22
Kao, C., Chen, D., Hue, C., Chen, J., & Chen C. C. (2006). Character inversion effect in the human occipitotemporal regions: An fMRI study Program No. 262.14. 2006 Neuroscience Meeting. Atlanta, GA: Society for Neuroscience.
Tseng, R. & Chen, C. C. (2006). Cortical activation to contour integration: The role of local element configuration. Program No. 640.13. 2006 Neuroscience Meeting. Atlanta, GA: Society for Neuroscience.
Chen, C. C. & Norcia. A.M. (2005). Temporal dynamics of lateral masking revealed with reverse correlation VEP. Program No. 820.5. 2005 Abstract Viewer/Itinerary Planner. Washington, DC: Society for Neuroscience, 2005.
Chen, C. C. & Han, H. Y. (2005). Local and global features in Glass patterns are processed in different brain areas. Journal of Vision, 5, 497a.
Chen, K., Chen. C. C. (2005) Cortical activation for shape-in-depth from different depth cues Program No. 768.8. 2005 Abstract Viewer/Itinerary Planner. Washington, DC: Society for Neuroscience, 2005.
Kao, C., Chen, C. C., Chen, D., Hue, C. & Chen. J. (2005). The retinotopic
representation for Chinese characters processing on the ventrolateral occipital surface. Program No. 768.13. 2005 Abstract Viewer/Itinerary Planner.
Washington, DC: Society for Neuroscience, 2005.
Kao, K. L., Chen, C. C. & Tyler, C. W. (2005). The role of symmetry in face perception. Program No. 46.15. 2005 Abstract Viewer/Itinerary Planner. Washington, DC: Society for Neuroscience, 2005
Lin, Y. C. & Chen, C. C. (2005). Spatial summation of chromatic information. Journal of
Vision, 5, 1020a.
Chen, C. C., Chang, H. C., Han, H. Y., Liu C. L., Chen, J. (2004). Global and local processing in Glass patterns: An fMRI study. Abstract of Society for
Neuroscience.
Chen, C. C., Chang, H. C., Liu, C. L., Chen, C. F., & Han, H. Y. (2004). The human brain responses to Glass patterns: The effects of signal to noise ratio. Journal of
Vision, 4(8), 714a
Kao, C., Hue, C., Chen, C., Chen, D., Liang, K., Chen, J. (2004). The role of the left fusiform gyrus in the processing of chinese characters. Program No. 137.6. 2004
23
Abstract Viewer/Itinerary Planner. Washington, DC: Society for Neuroscience,
2004.
3. Training
This grant provided financial support for two graduate students in the master degree program of the Department of Psychology, NTU and one student in the Ph. D. degree program. The two master degree students finished their studies in 2006 and 2007 respectively. This grant also supported a post-doc in the last funding year. The research result of this post-doc will be submitted separately.
24
References
Biederman I. (1987). Recognition-by-components: a theory of human image understanding. Psychol Rev. 94:115-47.
Cardinal KS, Kiper DC. (2003). The detection of colored Glass patterns. J Vis. 3: 199-208.
Dakin SC. (1997). The detection of structure in glass patterns: psychophysics and computational models. Vision Res. 37: 2227-46.
Engel SA, Glover GH, Wandell BA. (1997). Retinotopic organization in human visual cortex and the spatial precision of functional MRI. Cereb Cortex 7: 181-192. Friston, K.J. Holmes, A.P., Worsley, K.J., Poline, J.P., Frith, C.D., and Frackowiak,
R.S.J. (1995).Statistical parametric maps in functional imaging: a general linear approach. Human Brain Mapping 2:189-210.
Glass L. (1969). Moire effect from random dots. Nature 223: 578-580.
Gregory, R. L. (1966). Eye and Brain: The Psychology of Seeing. London: Weidenfeld and Nicolson.
Heeger DJ. (1992). Normalization of cell responses in cat striate cortex. Vis Neurosci.
9:181-97.
Kanizsa, G. (1979). Organization in Vision: Essays on Gestalt Perception. Oxford: Praeger.
Logothetis, N. K., Pauls, J. Augath, M. trinath, T. and Oeltermann, A. (2001).
Neurophysiological investigation of the basis of the fMRI signal. Nature 412: 150-157.
25
Smith MA, Bair W, Movshon JA. (2002). Signals in Macaque striate cortical neurons that support the perception of glass patterns. J Neurosci 22: 8334-8345.
Stehling, M. K., Turner, R. and Mansfield, P. (1991). Echo-planar imaging: magnetic resonance imaging in a fraction of a second. Science 254: 43-50.
Wandell, B.A., Chial, S. and Backus, B.T. (2000) Visualization and measurement of the cortical surface. Journal of Cognitive Neuroscience 12: 739-52.
Wilson H. R. (1985). Discrimination of contour curvature: data and theory. Journal of the
Optical Society of America A 2: 1191-1199.
Wilson HR, Wilkinson F, Asaad W. (1997). Concentric orientation summation in human form vision. Vision Res. 37: 2325-30.
Wilson JA, Switkes E, De Valois RL. (2004). Glass pattern studies of local and global processing of contrast variations. Vision Res. 44:2629-41.
Wilson, H. R. & Richards, W. (1992). Curvature and separartion discrimination at texture boundaries. Journal of the Optical Society of America A 9: 1653-1662.