Title: The effects of comorbidities on the trajectory of depressive symptoms among older adults in Taiwan
Running title: Comorbidity and depressive symptoms
Authors: Wei-Chung Hsua,b, M.D., Hui-ChuanHsub,c, PhD.
aDepartment of Radiation Oncology, Chung-Kang Branch, Cheng-Ching General
Hospital
bDepartment of Health Care Administration, Center for Health Policy and
Management Research, Asia University
c China Medical University
Correspondence:
Hui-Chun Hsu, Ph.D. Professor. Department of Health Care Administration, Asia University.
Address: 500, Lioufeng Road, Wufeng, Taichung, 41354, Taiwan, R.O.C. TEL: 886-4-23323456#1827, FAX: 886-4-23332970,
The effects of comorbiditieson the trajectory of depressive symptoms among older adults in Taiwan
Abstract
Objective: This study aimed to identify depressive symptoms among older Taiwanese
adults and to explore the relationships between different comorbidities and depressive symptoms. Methods: The data used herein were obtained from four waves of a longitudinal nationwide survey of the older Taiwanese population conducted from 1996 to 2007. Two-level hierarchical linear modeling was employed to identify the trajectory of depressive symptomspredicted by comorbidities when controlling for time-constant and time-varying covariates. Results: The time slope had an increasing tendency of depressive symptoms across time. The older adultswith cardiovascular disease (CVD), gastrointestinal disease, chronic respiratory disease (CRD), and the combination of two of these three diseases had a higher effect on the intercept of depressive symptoms. Only the older adultswith CRD combined with CVD or with GI disease had a significant negative effect on the slope of depressive symptoms over time. Participants with higher emotional-social support had lower depressive symptoms, and the effect of this support could reduce depressive symptoms even more over time. Conclusions: Different patterns of comorbidities might have
anadditive or modifying effect on depressive symptoms. Emotionalsocial support had a buffering or moderating effect on the prevention of depressive symptoms. This information is helpful for further studies that would address the relationships between different comorbidities and depressive symptoms.
Key words: comorbidity, depressive symptoms, hierarchical linear modeling, social
Introduction
Depression is a critically important issue forolder adults and a major disease burden for the healthcare system [1]. Compared with young adults, depressive older adults often suffer from multiple coexisting chronic medical conditions. Moreover, the combination of depression and chronic diseases causes additive adverse effects on functioning and increased healthcare costs [2-4]. The association between depression and chronic diseases is reciprocal because the depressive symptoms increase the risk of some chronic diseases,whereas chronic diseases are also risk factors for
simultaneous depression [5, 6]. Forolder adults suffering from multiple chronic diseases, coping withand managing their disease consequences may be even more challenging because of depressive symptoms.
In previous studies, the impacts of chronic medical conditions on depressive symptoms were mainly studied in cross-sectional studies and focused on a specific chronic disease or a number of chronic diseases [4, 7]. A variety of medical illnesses, such as cardiovascular disease, hypertension, stroke, diabetes, lung disease, and cancer, have been demonstrated to have a significant relationship with depressive symptoms [4, 6, 8]. However, the effects of comorbidities on depressive symptoms over time have rarely been examined. Furthermore, the effect of comorbidities on depressive symptoms may be additive, multiplicative, or modifying [9], although this fact has yet to be examined.
In this present study, we used the chronic disease patterns according to the pathophysiologic features to analyze the trajectory of depressive symptoms in a longitudinal national sample of older Taiwanese adults for 11 years. We tried to categorize multiple chronic diseases into disease patterns and to examine the effects of disease patterns on depressive symptoms over time by hierarchical linear modeling.
Such information would be useful for further research on the relationships between chronic medical conditions and depressive symptoms.
Methods Data
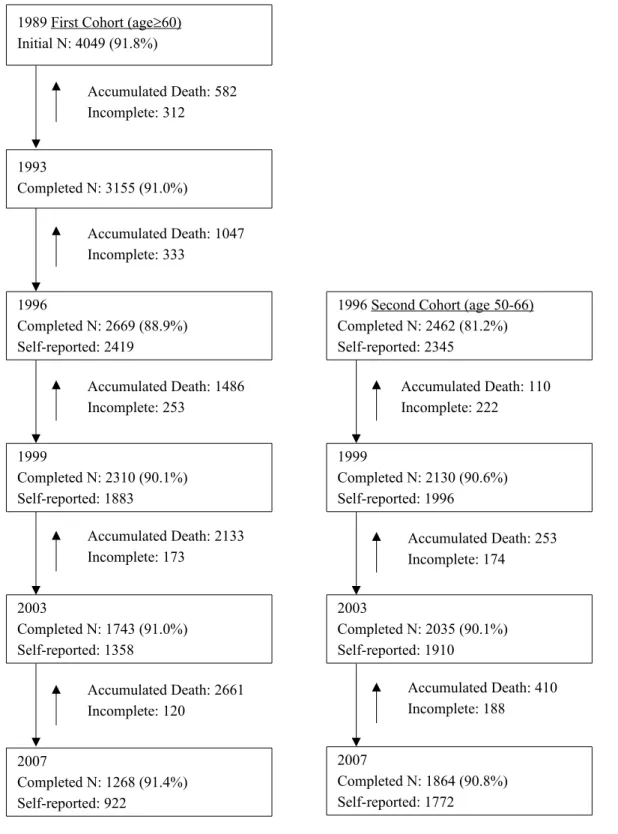
Data were analyzed from the Survey of Health and Living Status of the Elderly in Taiwan (later renamed the “Taiwan Longitudinal Survey on Aging” [TLSA]). A three-stage equal proportional-to-size probability sampling technique was employed, and the sampling frame was based on the household registration data. Face-to-face interviews were conducted. The first wave of data was initially collected in 1989, with samples consisting of 4049 respondents with a response rate of 92%. The surveys were conducted in 1993, 1996, 1999, 2003, and 2007. In 1996, an additional 2462 people aged 50-66 years old were added. In the present study, the data were from 1996 to 2007. The lost of follow-ups and the death cases attrited along with the follow-ups (Figure 1). Because the depressive symptoms were self-reported by each subject, only those who responded themselves were included in this study; 3879 respondents in 1999 (a total of 9791 observations) were included in the analysis.
Measures
The outcome variable
Depressive symptoms were measured as the outcome variable using the 10-item short form of the Center for Epidemiologic Studies Depression Scale (CES-D), which was shown to preserve the same sensitivity and specificity as the 20-item original scale [10, 11]. The scale has performed well in older Chinese individuals [12, 13]. Each item was scored from 0 to 3, and the total 10-item scale ranged from 0 to 30.
The missing data for depressive symptoms were imputed based on the mean score of the rest of the completed items if the participants answered 6 items or moreto reduce
the exclusion of cases. If there were more than 4 missing CES-D items, then the cases were excludedfrom the analysis. Because of the lagged variables in our analysis, depressive symptoms were used from 1999 to 2007 in the present study.
Time-varying covariates
Chronic disease was self-reported in each wave based on whether a physician had ever told the respondents that he/she had such disease. Ten chronic diseases were used for the analysis, including hypertension, heart disease, stroke, diabetes mellitus, gastrointestinal (GI) disease, hepatobiliary disease, arthritis, renal disease, cancer, and chronic respiratory disease (CRD) such as bronchitis, emphysema,
pneumonia,asthma, and other lung diseases. First, all ten chronic diseases were put in the model to examine their effects on depressive symptoms. Six of them were
significantly related to depressive symptoms. Then, these six chronic diseases were categorized into four groups based on their pathophysiologic characteristics:
cardiovascular disease (CVD) including heart disease, stroke, and diabetes mellitus; GI disease; CRD; and cancer. The disease patterns were based on these four types of diseases and were used in the following analysis. Later, the lagged (time=t-1) chronic diseases were used to predict the next wave (time=t) of depressive symptoms. For example, the chronic diseases in 1996 were used to predict the depressive symptoms in 1999.
Physical functional difficulties were assessed according to activities of daily living (ADLs) and instrumental activities of daily living (IADLs) scores. ADLs included six items: bathing, dressing, feeding oneself, functional transferring,
ambulation, and toileting [14]. IADLs included shopping, handling finances, traveling alone by car or train, housekeeping, doing heavy housework, and using the telephone [15]. Each ADL and IADL item was scored from 0 (no difficulty) to 3 (unable to do at
all), with the total score ranging from 0 to 36. The lagged (t-1) physical function difficulties were used for analysis.
Marital status and emotionalsocial support were used for controlling variables, and both were measured concurrently (t) to depressive symptoms. Marital status, which was originally classified as one of six types, was categorized into two groups: having a spouse (married or living with a partner) and without spouse (being
separated, divorced, widowed, or never married).
The measures of emotionalsocial support included the items of receiving and providing support. The respondents answered questions on whether and how much they received satisfactory support, were cared about, and were listened to by their family, relatives, and friends. To measure the provided support, the respondents answered questions about how much their family, relatives, and friends consult with them and about how the respondents feel regarding the extent of how they can help their family or friends. Each item scored from 0 to 2. The total score ranged from 0 to 10. A higher score indicated greater emotional social support.
Time-constant covariates
Demographic data, including age in 1996, gender, and years of formal education, were analyzed as time-constant variables.
Statistical Analysis
In this study, two-level hierarchical linear modeling (HLM) was employed to analyze the trajectory of depression. The first level of the model focuses on
intrapersonal differences that explain the change of each person as a function of time plus random error:
YiT = β0i + β1iTime + βkiXkiT + eiT, where
depressive symptoms for individual i; β1i is the rate of change (slope) in depressive
symptoms for individual i over time; XkiT are the time-varying variables, such as
concurrent marital status or lagged physical functional difficulties; βki is the effect of
Xk on depressive symptoms for individual i; and eiT is the random error in depressive
symptoms for individuali at time T. Time was defined as the number of years since the baseline of 1996.
The second level of the model is the interpersonal level,which mainly describes the individual coefficients as a function of person-specific random effects. The equation is as follows:
βpi = γp0 + γpqXqi+ upi, where
βpi is the pth growth parameter for individual i; γp0 is the intercept; Xqi is the qth
time-constant covariate, such as age, gender, and educational years, associated with individual i in the slope of time; γpq is the effect of Xqi on the pth growth parameter;
and upi is the random error.
In this study, we hypothesized a time-linear model, because the repeated
measures of the dependent variables for the participants included 3 time-points, and at least 2 points are required to make a linear model. Thus, the intercepts and the slope on time of the covariates were also included in the models. The estimated parameters of the intercepts indicate the covariate’s initial effect on depressive symptoms, and the estimated slopes show the covariate’s effect on the change of depressive symptoms over time as a linear function. The continuous variables such as age, educational years, physical functional difficulties, and emotional social support were centered to the grand means, and thus, the estimated coefficients were standardized. The
hierarchical linear modeling (HLM) was conducted using SPSS version 17.0 (SPSS, Chicago, IL, USA). Statistical significance was accepted at α = 0.05.
Results
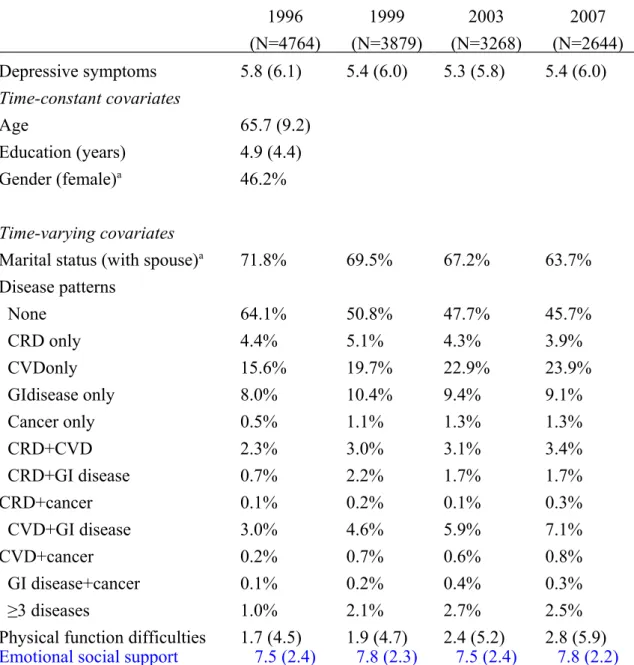
Table 1 shows the characteristics of the participants in the four waves.
Depressive symptoms maintained a stable score ranging from 5.3 to 5.8 during the period from 1996 to 2007. The disease patterns were categorized into 12 groups. Nearly two-thirds (64.1%) of the individuals had no chronic diseases at baseline; however, only half (45.7%) remained free of chronic disease during the 11-year period. The highest prevalence of the morbidity patterns was the CVD group. From 1996 to 2007, the prevalence of CVD only, CVD combined with GI disease, or CRD and cancer alone increased. The trends of all other chronic diseases, either alone or in combination, were inconsistent.
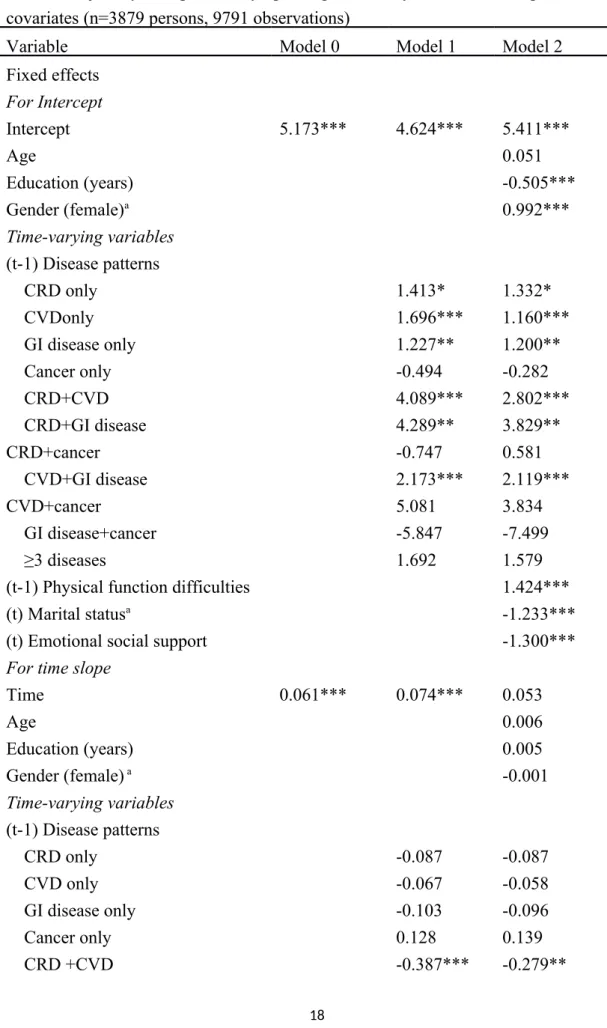
Table 2 shows the trajectory of depressive symptoms with lagged chronic diseases and other covariates by hierarchical linear modeling. Model 0 showed an unconditional model with only the intercept and time slope. Model 1 indicated the growth over time of the chronic disease variables. Model 2 added the demographic variables and the time-varying covariates. The effects of all of the independent variables on the intercepts and the time slope on depressive symptoms were estimated.
For the trajectory of depressive symptoms, the time slope in Model 0 showed an increasing trend of depressive symptoms over time (β=0.061, p<0.001). After
controlling for chronic diseases and other covariates in Models 1 and 2, the time slope still showed an increasing tendency of depressive symptoms across time. The
coefficient of time slope was significant in Model 1 (β=0.074, p<0.001) but not in Model 2 (p=0.053, p>0.05).
In Model 1, the intercepts of all lagged chronic disease patterns showed a significantly positive effect on the intercept of depressive symptoms except cancer
only, cancer combined with GI disease, or cancer with CRD. On the time slope, the effect of having CRD and CVD (β=-0.387, p<0.001) and having CRD and GI disease (β=-0.453, p<0.01) reduced depressive symptoms over time.
Interpersonal (time-constant) characteristics and time-varying covariates were included in Model 2. When other covariates were added to Model 2, some of the lagged chronic disease patterns still showed a positive effect on the intercept of depressive symptoms. The older adultswith CRD only (β = 1.332, p < 0.05), CVD only (β=1.160, p<0.001), GI disease only (β=1.200, p<0.01), CRD and CVD (β = 2.802, p < 0.001), CRD and GI disease (β = 3.829, p < 0.01), and CVD combined with GI disease (β=2.119, p<0.001) demonstrated a higher effect of the comorbidities on the intercept of depressive symptoms. However, on the time slope, only the group of CRD combined with CVD (β=-0.279, p<0.01) or with GI disease (β=-0.386, p<0.05) demonstrated a significant negative effect on the slope of depressive
symptoms over time. The results suggest that the lagged chronic diseases would cause higher depressive symptoms than would be experienced in those who were free from morbidity, but the effect was slightly offset for the group of individuals with CRD combined with CVD or GI disease. The effect of morbidity on depressive symptoms remained stable in other patterns.
For the time-varying covariates, having a spouse had a negative effect at the intercepts (β=-1.233, p<0.001) but a positive effect on the time slope (β=0.131, p<0.001), indicating that the older adults having a spouse would have lower
depressive symptoms on the intercept but that depressive symptoms would increase over time. Emotionalsocial support having both negative coefficients at the intercepts (β=-1.300, p<0.001) and on the time slope (β=-0.064, p<0.001) indicatesthat
that the effect would reduce depressive symptoms even more over time. The coefficient of lagged physical functional difficulties was positive at the intercepts (β=1.424, p<0.001) but negative on the time slope (β=-0.071, p<0.001), indicating that lagged physical functional difficulties were associated with more depressive symptoms, but the effect declined over time.
For time-constant variables, the coefficient of educational years with negative values and gender with positive values showed significant effects at the intercepts but not on the time slope. These results indicate that higher educational levels and male subjects had a lower intercept of depressive symptoms.
Discussion
This study examined the effects of chronic disease patterns on the trajectory of depressive symptoms among older adults in Taiwan over an 11-year period. We found that the changes in the trajectory of depressive symptoms increased over time. The chronic disease patterns, such as CRD only, CVD only, GI disease only, CRD and CVD, CRD and GI disease, and CVD combined with GI disease, were related to higher depressive symptoms. Although the participants with any of the
above-mentioned diseases exhibited decreased depressive symptoms across time, only CRD combined with CVD or GI disease had an offset effect on the depressive symptoms over time. Better emotionalsocial support would lower depressive symptoms at the intercept and also decrease depressive symptoms over time.
Different diseases had different courses over time. Our results show that the participants with CRD, CVD, or GI disease alone or combined with one another had significantly higher depressive symptoms than those with no chronic diseases. These findings were consistent with those ofprevious studies [8, 16-18]. CRD such as chronic bronchitis, emphysema, and lung disease is often irreversible and tends to
worsen over time. CRD also restricts physical daily activity and social contact because of dyspnea and limited mobility[17]. Nevertheless, most CVDs can be controlled as a stable condition across time due to medication or rehabilitation. GI disease affects nutritional intake, but these diseases can improve after medication and the implementation of a healthy lifestyle. The participants with CRD could
accommodate or cope with their situation over time [19]. Therefore, CRD-related comorbidities exhibited a declining trend ofdepressive symptoms over time,
particularly when CRD was comorbid with CVD or GI disease. These results indicate that CRD combined with CVD or GI disease would have an additive effect at
intercepts and in the slope of depressive symptoms because the coefficient of CRD combined with CVD or GI disease was strongly higher than CRD plus CVD or GI disease alone. Past studies have found associations between CRD and depressive symptoms [17, 18], and the dose-response additive effect of multimorbidities was also reported[20]. Our results suggest that older patients with CRD, particularly those who have CRD combinedwith CVD or GI, require careful monitoring of their emotional health.
We also found that those who have more emotionalsocial support had lower depressive symptoms at the beginning of the study period, whichcontinuously reduced over time. These results indicate that emotionalsocial support is an important buffer or moderator for the prevention of depressive symptoms. In addition, the participants that suffered from one or more diseases might need more emotionalsocial supportto lower the depressive symptoms. Taylor and Lynch [21] reported that the trajectories of perceived social support rather than actual received support could mediate the relationship between disability and depressive symptom trajectories. Social support was also the most powerful predictor for a change in depressive symptoms [22] and
was the moderator of the treatment response to antidepressant therapies [23]. Because social support is a key changeable factor that enhances health, health promotion strategies and policies should be designed and implemented to decrease depressive symptoms for those older adults with chronic comorbidities or multimorbidities. In addition, having a spouse would lower depressive symptoms at the intercept more than those who did not have a spouse, but this protective effect would be reduced at the time slope, i.e., the depressive symptoms would increase over time for those having a spouse. Although a spouse may provide social support to buffer life stress and reduce depressive symptoms for older adults, the spouses of the older adults also get older as time goes by and their health may also deteriorate over time, or life events (such as financial strain or family matters) relating to their spouse may cause stress for the older adults having a spouse compared to those with no spouse.
There are also several limitations of this study. First, selection bias of the
samples exists in longitudinal studies because only self-reported survivors could be
included in the analysis. However, all of the eligible waves of data were included in
the analysis by using the HLM, and the missing depressive symptoms data for the
participants were imputed to reduce the exclusion of cases. Survivors should have
better health than those who had died or were lost to follow-up, and the readers are
reminded that such a bias could impact the study results.Second, the chronic diseases
were self-reported, and the severities of the described diseases and others, such as arthritis and renal disease, were not evaluated in the present study. Because the severity of different diseases might have an impact on depressive symptoms, the
severity of comorbidities would be more complex. Third, only 4 types of chronic disease patterns were included in the analysis. Other types ofchronic diseases or conditions were not considered. In addition, the possibility that taking antidepressants or receiving antidepressive interventions might be a confounder could not be
determined in this study as these factors were not included in the analysis.Fourth,
thepossibility that lagged variables such as physical function difficulties might impact
current depressive symptoms was not analyzed in this study.Future studies are
necessary to investigate these issues. Finally, we hypothesized a time-linear model by
applying HLM modeling to estimate the intercept and slope parameter. However, it
might be the case that a nonlinear curve better fits the data.Thus, the generalizability
of the study results should be interpreted with caution. Conclusion
In conclusion, older adults with CRD, CVD, or GI disease had higher depressive symptoms than those with no chronic diseases. CRD combined with CVD or GI disease had an additive effect on depressive symptoms over time. Although
depressive symptoms had an increasing tendency in older adults across time, better emotionalsocial support might effectively decrease the depressive symptoms. Conflict of Interest
All authors have completed the Unified Competing Interest form and declare that all authors have no competing interests to report.
The research was supported by grants from the National Science Council, Taiwan, Republic of China (NSC 101-2410-H-468-008-MY2). The data was provided by the Population and Health Research Center, Bureau of Health Promotion, Department of Health, Taiwan, Republic of China. The interpretation and conclusions contained herein do not represent those of Bureau of Health Promotion. This studyhad obtained approval of Research Ethics Committee of Central Regional Research Ethics Center.
References
[1] Luppa M, Heinrich S, Matschinger H, Sandholzer H, Angermeyer MC, Konig HH, et al. Direct costs associated with depression in old age in Germany. J Affect Disord. 2008;105:195-204.
[2] Wells KB, Stewart A, Hays RD, Burnam MA, Rogers W, Daniels M, et al. The functioning and well-being of depressed patients. Results from the Medical Outcomes Study. JAMA. 1989;262:914-9.
[3] Kim H, Park SM, Jang SN, Kwon S. Depressive symptoms, chronic medical illness, and health care utilization: findings from the Korean Longitudinal Study of Ageing (KLoSA). Int Psychogeriatr. 2011;23:1285-93.
[4] Katon W, Lin EH, Kroenke K. The association of depression and anxiety with medical symptom burden in patients with chronic medical illness. General hospital psychiatry. 2007;29:147-55.
[5] Chapman DP, Perry GS, Strine TW. The vital link between chronic disease and depressive disorders. Preventing chronic disease. 2005;2:A14.
[6] Taylor WD, McQuoid DR, Krishnan KR. Medical comorbidity in late-life depression. Int J Geriatr Psychiatry. 2004;19:935-43.
depression: the modifying role of psychosocial resources. Soc Sci Med. 2004;59:721-33.
[8] Huang CQ, Dong BR, Lu ZC, Yue JR, Liu QX. Chronic diseases and risk for depression in old age: a meta-analysis of published literature. Ageing Res Rev. 2010;9:131-41.
[9] Basford L, Poon LW, Dowzer C, Booth A. Coping with specific chronic health conditions. In: Poon LW, Gueldner SH, Sprouse BM, editors. Successful aging and adaptation with chronic diseases. New York: Springer Publishing Co; 2003. p. 261. [10] Shrout PE, Yager TJ. Reliability and validity of screening scales: effect of reducing scale length. J Clin Epidemiol. 1989;42:69-78.
[11] Kohout FJ, Berkman LF, Evans DA, Cornoni-Huntley J. Two shorter forms of the CES-D (Center for Epidemiological Studies Depression) depression symptoms index. J Aging Health. 1993;5:179-93.
[12] Boey KW. Cross-validation of a short form of the CES-D in Chinese elderly. Int J Geriatr Psychiatry. 1999;14:608-17.
[13] Lue BH, Chen LJ, Wu SC. Health, financial stresses, and life satisfaction
affecting late-life depression among older adults: a nationwide, longitudinal survey in Taiwan. Arch Gerontol Geriatr. 2010;50 Suppl 1:S34-8.
[14] Katz S, Ford AB, Moskowitz RW, Jackson BA, Jaffe MW. Studies of Illness in the Aged. The Index of ADLs: A Standardized Measure of Biological and
Psychosocial Function. JAMA. 1963;185:914-9.
[15] Lawton MP, Brody EM. Assessment of older people: self-maintaining and instrumental activities of daily living. Gerontologist. 1969;9:179-86.
[16] Wong SY, Woo J, Lynn HS, Leung J, Tang YN, Leung PC. Risk of depression in patients with chronic respiratory diseases: results from two large cohort studies in
Chinese elderly from Hong Kong. Int J Geriatr Psychiatry. 2006;21:233-8.
[17] Kim SH, Kim JS, Choi JY, Lee KY, Park TJ, Lee JH. Factors associated with depressive symptom in chronic obstructive pulmonary disease based on the third (2005) and fourth (2008) Korea National Health and Nutritional Examination Survey (KNHANES III, IV). Korean journal of family medicine. 2011;32:234-42.
[18] Tsai YF, Yeh SH, Tsai HH. Prevalence and risk factors for depressive symptoms among community-dwelling elders in Taiwan. Int J Geriatr Psychiatry. 2005;20:1097-102.
[19] Yuet LM, Alexander M, Chun CJ. Coping and adjustment in Chinese patients with chronic obstructive pulmonary disease. International journal of nursing studies. 2002;39:383-95.
[20] Gunn JM, Ayton DR, Densley K, Pallant JF, Chondros P, Herrman HE, et al. The association between chronic illness, multimorbidity and depressive symptoms in an Australian primary care cohort. Soc Psychiatry Psychiatr Epidemiol. 2012;47:175-84. [21] Taylor MG, Lynch SM. Trajectories of impairment, social support, and
depressive symptoms in later life. J Gerontol B Psychol Sci Soc Sci. 2004;59:S238-46.
[22] Fauth EB, Gerstorf D, Ram N, Malmberg B. Changes in depressive symptoms in the context of disablement processes: role of demographic characteristics, cognitive function, health, and social support. J Gerontol B Psychol Sci Soc Sci. 2012;67:167-77.
[23] Blazer DG. Depression and social support in late life: a clear but not obvious relationship. Aging Ment Health. 2005;9:497-9.
Table 1. Descriptive statistics of depressive symptoms and covariates in 11 years (Mean & SD or %) 1996 (N=4764) 1999 (N=3879) 2003 (N=3268) 2007 (N=2644) Depressive symptoms 5.8 (6.1) 5.4 (6.0) 5.3 (5.8) 5.4 (6.0) Time-constant covariates Age 65.7 (9.2) Education (years) 4.9 (4.4) Gender (female)a 46.2% Time-varying covariates
Marital status (with spouse)a 71.8% 69.5% 67.2% 63.7%
Disease patterns None 64.1% 50.8% 47.7% 45.7% CRD only 4.4% 5.1% 4.3% 3.9% CVDonly 15.6% 19.7% 22.9% 23.9% GIdisease only 8.0% 10.4% 9.4% 9.1% Cancer only 0.5% 1.1% 1.3% 1.3% CRD+CVD 2.3% 3.0% 3.1% 3.4% CRD+GI disease 0.7% 2.2% 1.7% 1.7% CRD+cancer 0.1% 0.2% 0.1% 0.3% CVD+GI disease 3.0% 4.6% 5.9% 7.1% CVD+cancer 0.2% 0.7% 0.6% 0.8% GI disease+cancer 0.1% 0.2% 0.4% 0.3% ≥3 diseases 1.0% 2.1% 2.7% 2.5%
Physical function difficulties 1.7 (4.5) 1.9 (4.7) 2.4 (5.2) 2.8 (5.9)
Emotional social support 7.5 (2.4) 7.8 (2.3) 7.5 (2.4) 7.8 (2.2)
CRD = chronic respiratory disease; CVD = cardiovascular disease (including heart disease, stroke, and diabetes mellitus); GI = gastrointestinal.
Table 2 Trajectory of depressive symptoms predicted by chronic disease patterns and covariates (n=3879 persons, 9791 observations)
Variable Model 0 Model 1 Model 2
Fixed effects For Intercept Intercept 5.173*** 4.624*** 5.411*** Age 0.051 Education (years) -0.505*** Gender (female)a 0.992*** Time-varying variables (t-1) Disease patterns CRD only 1.413* 1.332* CVDonly 1.696*** 1.160*** GI disease only 1.227** 1.200** Cancer only -0.494 -0.282 CRD+CVD 4.089*** 2.802*** CRD+GI disease 4.289** 3.829** CRD+cancer -0.747 0.581 CVD+GI disease 2.173*** 2.119*** CVD+cancer 5.081 3.834 GI disease+cancer -5.847 -7.499 ≥3 diseases 1.692 1.579
(t-1) Physical function difficulties 1.424***
(t) Marital statusa -1.233***
(t) Emotional social support -1.300***
For time slope
Time 0.061*** 0.074*** 0.053 Age 0.006 Education (years) 0.005 Gender (female) a -0.001 Time-varying variables (t-1) Disease patterns CRD only -0.087 -0.087 CVD only -0.067 -0.058 GI disease only -0.103 -0.096 Cancer only 0.128 0.139 CRD +CVD -0.387*** -0.279**
CRD+GI disease -0.453** -0.386* CRD+cancer -0.042 -0.123 CVD+GI disease -0.118 -0.171 CVD+cancer -0.489 -0.406 GI disease+cancer 0.740 0.957 ≥3 diseases 0.068 -0.007
(t-1) Physical function difficulties -0.071***
(t) Marital statusa 0.131***
(t) Emotional social support -0.064***
Random effects Residual 18.247*** 18.396*** 18.095*** Intercept 16.450*** 15.247*** 8.959*** Time 0.038*** 0.040*** 0.020* -2LL 61236.810 58912.268 57293.517 AIC 61242.810 58918.268 57299.517 BIC 61264.377 58939.718 57320.955 *p<0.05, **p<0.01, ***p<0.001.
-2LL = -2 restricted log likelihood; AIC =Akaike’s Information Criterion; BIC = Schwarz’s Bayesian criterion;CRD = chronic respiratory disease; CVD =
cardiovascular disease (including heart disease, stroke, and diabetes mellitus); GI = gastrointestinal.
Figure 1 TLSA surveys and respondents in this study
Accumulated Death: 582 Incomplete: 312
1989 First Cohort (age 60) Initial N: 4049 (91.8%) 1993 Completed N: 3155 (91.0%) 2007 Completed N: 1268 (91.4%) Self-reported: 922 2003 Completed N: 1743 (91.0%) Self-reported: 1358 1999 Completed N: 2310 (90.1%) Self-reported: 1883 Accumulated Death: 110 Incomplete: 222 2007 Completed N: 1864 (90.8%) Self-reported: 1772 2003 Completed N: 2035 (90.1%) Self-reported: 1910 1999 Completed N: 2130 (90.6%) Self-reported: 1996 Accumulated Death: 253 Incomplete: 174 Accumulated Death: 410 Incomplete: 188
1996 Second Cohort (age 50-66) Completed N: 2462 (81.2%) Self-reported: 2345 : Accumulated Death: 2661 Incomplete: 120 Accumulated Death: 2133 Incomplete: 173 Accumulated Death: 1486 Incomplete: 253 Accumulated Death: 1047 Incomplete: 333 1996 Completed N: 2669 (88.9%) Self-reported: 2419