Image Coding Using Adaptive Wavelet Zerotree
8
0
0
全文
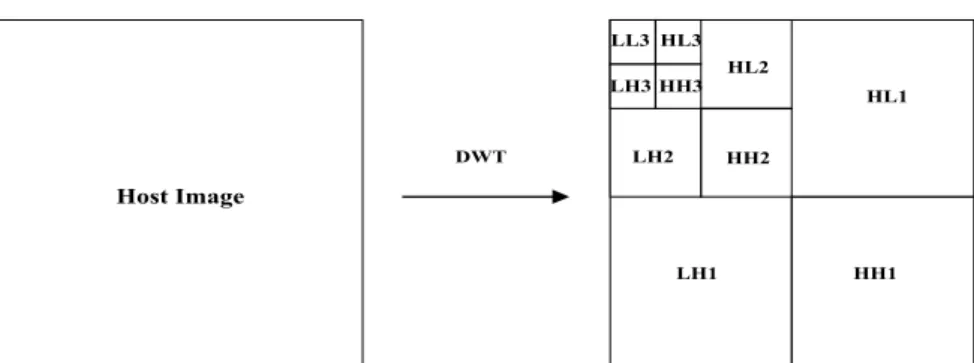
(2) are logarithmically spaced in frequency. The basic idea in the DWT for a two dimensional image is as follows. An image is first decomposed into four parts of high, middle, and low frequencies, i.e., LL1, HL1, LH1, HH1 subbands, by cascading horizontal and vertical two channel critically subsampled filter banks. The subbands labeled HL1, LH1, and HH1 represent the finest scale wavelet coefficients. To obtain the next coarser scale of wavelet coefficients, the subband LL1 is further decomposed and critically subsampled. This process is continued an arbitrary number of times, which is determined by the application at hand. Fig. 1 shows an image is decomposed into ten subbands for three levels (scales). Each level has various band-information such as low-low frequency band, low-high frequency band, high-low frequency band, and high-high frequency band. Furthermore, from these DWT coefficients, the original image can be reconstructed. This reconstruction process is called the inverse DWT (IDWT). Let I [m, n] represent an image. The DWT and IDWT for I [m, n] can be similarly defined by implementing the DWT and IDWT for each dimension m and n separately: DWTn [DWTm I [m, n]]. Fig. 2 shows the original and DWT decomposition of 512¯512 Lena image. The coarsest subband is a low-pass approximation of the original image, and the other subbands are finer-scale refinements. A parent-child relationship can be defined between wavelet coefficients at different scales corresponding to the same location. Excepting the highest frequency subbands, i.e., HL1, LH1, and HH1, every coefficient at a given scale can be related to a set of coefficients at the next finer scale of similar orientation. The coefficient at the coarse scale is called the parent, and all coefficients corresponding to the same spatial location at the next finer scale of similar orientation are called children. For a given parent, the set of all coefficients at all finer scales of similar orientation corresponding to the same location are called descendants. A wavelet tree that descending from a coefficient in the subband LH3 is shown in Fig. 3. Definition 1: A wavelet coefficient xn (i, j) ∈ D is a parent of xn-1 (p, q), where D is a subband labeled HLn, LHn, HHn, p = i*2-1| i*2, q = j*2-1| j*2, n>1, i>1, and j>1. Definition 2: If a wavelet coefficient xn (i, j) at the coarsest scale and its descendants xn-k (p, q) satisfy |xn (i, j)| < T, | xn-k (p, q)| < T for a given threshold T, then they are called wavelet zerotrees. Definition 3: If a wavelet coefficient xn (i, j) at the coarsest scale satisfy |xn (i, j)| > T for a given. threshold T, then xn (i, j) is called a significant coefficient [2]. The zerotree is defined as follows. Given an amplitude threshold T, if a wavelet coefficient |x (i, j)| satisfies |x (i, j)| < T, then the |x (i, j)| is said to be insignificant over a given threshold T. If a coefficient and all of its descendants are insignificant over T, then we call the set of these wavelet coefficients zerotree for the threshold T. An element of a zerotree for threshold T is a zerotree root if it is not the descendant of a previously found zerotree root for the threshold T. The zerotree is based on the hypothesis that if a wavelet coefficient at a coarse scale is insignificant with respect to a given threshold T, then all wavelet coefficients of the same orientation in the same spatial location at finer scales are likely to be insignificant with respect to T. In [2], Shapiro represented the EZW algorithm for image compression using the zerotree of wavelet coefficients. B. Embedded Zerotree Wavelet Coding [2] EZW coding is based on discrete wavelet transform (DWT). The DWT decomposed the input image into several varying resolutions of subbands. EZW scans wavelet coefficients subband by subband. Parents are scanned before any of their children, but only after all neighboring parents have been scanned. There are two types of passes performed: 1) a dominant pass, 2) and a subordinate pass [2]. The dominant pass finds significant coefficients to a given threshold, and the subordinate pass refines all significant coefficients found in all previous dominant passes. Four symbols are used to tell a dominant pass to a decoder. Two symbols are used for a significant according to its sign—POS (positive significant) or NEG (negative significant). A ZTR (zerotree root) symbol is used to signify a coefficient below the threshold T, with all its children in the zerotree data structure are also insignificant. An IZ (isolated zero) symbol signs a coefficient is insignificant but has at least one significant child. The use of ZTR and IZ symbols is to inform locations of significant coefficients as efficiently as possible. After a dominant pass, EZW further encodes coefficients using a successive approximation quantization (SAQ) scheme. Coding is done bit-plane by bit-plane. The successive approximation approach to quantization of the wavelet coefficient leads to the embedded nature of an EZW coded bitstream [8]. These two passes are entropy-coded with an adaptive arithmetic coder [6]. C. Adaptive Zerotree Entropy (AZE) Coding.
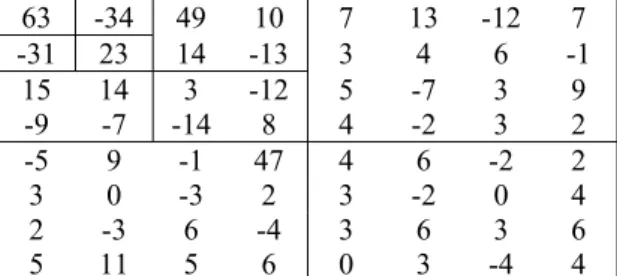
(3) The proposed coding method, AZE coding, is an efficient technique for coding wavelet transform coefficient. Like EZW, this new AZE exploits the self-similarity inherent in the wavelet transform of images to predict the location of information across wavelet scales. AZE introduced a data structure called a P-zerotree, also built on the parent-child relationship. The P-zerotree structure takes advantage of the principle that if a wavelet coefficient x at a coarse scale is insignificant with respect to a given threshold T, then all wavelet coefficients of the same orientation at the same spatial location at finer wavelet scales are also likely to be insignificant with respect to T [2], [8]. In such situation, x is a P-zerotree root, and will be quantized to zero. AZE coding organizes quantized wavelet coefficients into wavelet trees and then uses adaptive entropy coding to reduce the number of bits required representing those trees. Subjectively, AZE differs from EZW in four major ways. 1) P-zerotree model: The P-zerotree model consists of a tree structure that crosses multiple resolutions of the wavelet-decomposed image. A P-zerotree structure data group is formed using units that have the same location inside each subband along the horizontal, vertical, and diagonal directions. Thus, each tree node has 2¯2 children, and each child has its own 2¯2 children, and so on until the highest frequency subbands are reached. If all of the elements inside a tree structure data group are tested to be insignificant, then the data group is labeled as the P-zerotree. The definition of P-zerotree is as follows: Pk is a P-zerotree root for a given threshold T, if. Λ (P < T ). k ≥i ≥ 2. Λ. k = 2≥i ≥1. i. , or. ( Pi < T ). , where Pk is a parent of Pk-1, k ≥ 2. P-zerotree model is based on one assumption: The symbol ZTR is used to signify a coefficient xk, k>2, at a k-scale coarser subband below T, with all its children in the zerotree data structure, except the finest scale, also below T. The potential reason is that if xk, xk-1, …, x2 are all below T, the descendant x1 of xk has a higher possibility below T. 2) Quantization at the coarsest subband is performed distinctly from the P-zerotree growing process, thereby making it possible to reduce image distortion. 3) EZW takes advantage of successive-approximation quantization. (SAQ) to perform the embedded coding. The SAQ sequentially applies a sequence of thresholds T0, ., Tn-1 to determine significance, where the thresholds are chosen so that Ti = Ti /2. While in the proposed AZE coding, as will be seen in next section, the coding length of significant coefficients at a subband is adaptively dependent on the weight through significant coefficients at such scale. 4) Being the variation of coefficients among different scale, significant coefficients at different scale are further encoded independently for enhancing the image quality.. III. Proposed Framework Fig. 4 shows a block diagram of the encoding/decoding structure of the proposed framework. The corresponding image coding algorithms consist of two major stages: 1) a pyramid wavelet decomposition/reconstruction stage, and 2) a quantization/coding stage. The pyramid decomposition stage achieves efficient spatial decorrelation using P-zerotree data type, and usually concentrates most of the subjectively important information in the coarsest frequency subband. In this section, a simple example will be used to illustrate the order of operations used in the AZE algorithm. Consider the simple 3-scale wavelet transform of an 8¯8 image. The array of value is shown in Fig. 5. The AZE coding steps are as follows: A. P-zerotree scanning 1) We can choose our threshold T, to evaluate whether a coefficient is significant or insignificant. Let T= 32. 2) The threshold T is taken to generate P-zerotree. AZE coding reserves all (1) coefficients at the coarsest subband, LL3 in Fig. 5, to be significant. 3) AZE scans wavelet coefficients subband by subband. Parents are scanned before any of their children. In Fig. 5, coefficients at subband HL3, -34, is first scanned, and its amplitude is greater than T, coefficient –34 is significant. The rest of coefficients at subband HL3 are then scanned and evaluated. After that, coefficient at LH3, i.e., -31 is evaluated to be smaller than T, and each child at LH2 is also small than T. The target coefficient –31 is replaced with ‘0’ to signify P-zerotree root of its children at subband HL2 and HL1. The scan result is.
(4) listed in Fig. 6. 4) Note that coefficient at HH3 and its children at HH2 are all small than T, thus coefficient at HH3 is replaced with ‘0’ to be P-zerotree root. It indicates that its children at HH2 and HH1 are all replaced with ‘0’ to signify insignificant. 5) After all of coefficients at 3-scale bands are scanned complete. AZE will scan non-zero coefficient part of 2-scale bands. 6) The magnitude 49 at subband HL2 is significant with respect to T. 7) The magnitude 10 at HL2 and all of its children at HL1 are lower than T, thus, magnitude 10 is replaced with ‘0’ to signify P-zerotree root, and its children are replaced with ‘0’ to signify insignificant with respect T. 8) The magnitudes (7, 13, 3, 4) at subband HL1 remains to be significant because its parent, i.e., 49, at HL2 is significant. 9) The scan results are listed in Fig. 6.. the largest/smallest significant coefficient at the l-scale resolution. It is clearly that the value of Coefl’ is at the range of 0 and nl. IV. Experimental Results We have implemented an image coder using the adaptive P-zerotree entropy coding to generate actual compressed bit streams. We use in our experiments popular 512¯512 gray scale image. Our subband image coder employs a four-scale p-zerotree decomposition except the coarsest subband. We apply our adaptive entropy quantization to the significant coefficients to shrink down the variances among different scale subbands. Fig. 9 includes the compressed Lena image at various rates. The bit rate is based on AZE coding. We compare the peak signal-to-noise ratio (PSNR) PSNR =. B.. Construct coefficient map. significant/insignificant. 1) We can construct significant/insignificant map from the results of Fig. 6. The map is generated with the sequence of subbands at 3-scale, 2-scale, and 1-scale, i.e., HL3, LH3, HH3, HL2, LH2, …. 2) In Fig. 7, A significant coefficient is encoded using the symbol “01” (negative significant) or “10” (positive significant). Only P-zerotree root is encoded using the symbol “00”. C. Adaptive entropy coding 1) Next, adaptive coding is applied to significant coefficients. Significant coefficients at each scale are quantized to n intervals, where B = Round(( NCl / TCl ) / (1/3)) + 3, l = 1, 2, 3 n = 2B-1, where B denotes representation bits for each significant coefficient, NCl represents the number of significant coefficients at the lth-scale image data, and TCl represents the number of coefficients at the lth-scale image data. The relationship between NCl / TCl and coding length for each coefficient is shown in Fig. 8. 2) Each significant coefficient Coefl at the lth-scale resolution is then encoded to Coefl’ as follows. Dl = ( MAX_Coefl – MIN_Coefl ) / nl, Coefl’ = (Coefl – MIN_Coefl) / Dl, l = 1, 2, 3 where MAX_Coefl/MIN_CoeflB denotes. 10 log10. 2552 , MSE. where MSE is the mean square error for each compressed image. We can see that the reconstructed images offer good quality at a very low rate of 0.125 b/pixel. Fig. 10 shows the results PSNR versus bit rate performance of proposed coder for Lena. We also summarize the PSNR results of AZE in Table I, for Lena.. V.. Conclusion. We have proposed a novel subband image coder that produces a fully embedded bit stream. By modeling the image subbands except the lowest one using the parametric P-zerotree decomposition model, we were able to provide a conceptual framework to develop the image coder as well as simple implementation. In this work, adaptive entropy quantization is exploited to balance the coefficients’ variation(2) of each subband among different scale. We showed that a symbol stream is coded with less entropy using the P-zerotree relation. We used a modified zerotree data structure for subband decomposition and adaptive entropy coding but still achieved a very good image coder. The experimental results show that our AZE is competitive with other image coder in the literature. Experimentally, our AZE subband coder has 0.27~0.85 dB better performance than the EZW’s. ACKNOWLEDGMENT The authors thank Mr. Y.-H. Huang (3) for providing partial program codes for the.
(5) experiments and many fruitful discussions.. References [1] J. W. Woods and S. D. O’Neil, “Subband coding of images,” IEEE Trans. Acoust., Speech, Signal Processing, vol. ASSP-34, pp. 1278-1288, Oct. 1986. [2] Jerome M. Shapiro, “Embedded image coding using zerotrees of wavelet coefficients,” IEEE Trans. Signal Processing, vol. 41, no. 12, pp. 3445-3462, 1993. [3] Z. Xiong, K. Ramchandran, and M.Orchard, “Space-frequency quantization for wavelet image coding,” IEEE Trans. Image Processing, vol. 6, pp. 677-693, May, 1997. [4] A Said and W. A. Pearlman, “A new, fast, and efficient image codec based on set partitioning of hierarchical trees,” IEEE Trans. Circuits Syst. Video Technol., vol. 6, pp. 243-250, June, 1996. [5] Y. Yoo, A. Ortega, and B. Yu, ”Image subband coding using context-based classification and adaptive quantization,” 1998.. [6] [7]. [8]. [9]. [10]. IEEE Trans. Image Processing, vol. 8, No. 12, pp. 1702-1715, 1999. M. Vetterli and J. Kovacevic, Wavelet and Subband Coding. Engle-wood Cliffs, NJ: Prentice-Hall, 1995. Y.-Q. Zhang and S. Zafar, “Motion-compensated wavelet transform coding for color compression,” IEEE Trans. Circuits Syst. Video Technol., vol. 2, Sept., 1992. I. Sodagar, H.-J. Lee, P. Hatrack, and Y.-Q. Zhang, “Scalable wavelet coding for synthetic/natural hybrid images,” IEEE Trans. Circuits Syst. Video Technol., vol. 9, no. 2, pp. 244-254, Mar., 1999. H. Man, F. Kossentini, and M. J. T. Smith, “A family of efficient and channel error resilient wavelet/subband and image coders,” IEEE Trans. Circuits Syst. Video Technol., vol. 9, no. 1, pp. 95-108, Feb., 1999. S.-H. , “A family of efficient and channel error resilient wavelet/subband and image coders,” in proc. IEEE Int. Conf. Acoust., Speech, Signal Processing, pp. 2685-2688,. LL3 HL3 LH3 HH3. DWT. LH2. HL2 HL1 HH2. Host Image. LH1. HH1. Fig. 1. DWT decomposition of an image: Note that the lowest frequency subband is the top left, and the highest frequency subband is at the bottom right..
(6) DWT. (a) (b) Fig. 2. (a) The original and (b) DWT decomposition of 512¯512 Lena image.. LL3 HL3 LH3 HH3. DWT. LH2. HL2 HL1 HH2. Host Image. LH1. HH1. Fig. 3. DWT decomposition of an image: Note that the arrow points from the subband of the parents to the subband of the children. The lowest frequency subband is the top left, and the highest frequency subband is at the bottom right. Also shown is a wavelet tree consisting of all the descendants of a single coefficient in the subband LH3. The coefficient in LH3 is a zerotree root if it is insignificant and all of its descendants are insignificant.. original image. DWT. P-zerotree scanning. significant / insignificant coefficient map. Huffman coding. significant coefficient sequence. adaptive coding. combine. compressed file. lowest subband. Encoding structure compressed file. Huffman decoding. significant / insignificant coefficient map. adaptive decoding. significant coefficient sequence IDWT combine lowest subband. Decoding structure Fig. 4. Encoding/decoding structure of proposed framework.. reconstructed image.
(7) 63 -34 49 10 7 13 -12 7 -31 23 14 -13 3 4 6 -1 15 14 3 -12 5 -7 3 9 -9 -7 -14 8 4 -2 3 2 -5 9 -1 47 4 6 -2 2 3 0 -3 2 3 -2 0 4 2 -3 6 -4 3 6 3 6 5 11 5 6 0 3 -4 4 Fig. 5. Example of 3-scale wavelet transform of an 8¯8 image. 63 0 0 0 0 0 0 0. -34 0 0 0 0 0 0 0. 49 0 0 0 0 0 0 0. 0 0 0 0 0 0 0 0. 7 3 0 0 0 0 0 0. 13 4 0 0 0 0 0 0. 0 0 0 0 0 0 0 0. 0 0 0 0 0 0 0 0. Fig. 6. Scanned results.. 01 -34 HL3. 00. 00. 10 49. LH3. HH3. 00. 00. 00. 10 7. 10 13. HL2. 10 3. 10 4. HL1. Fig. 7. Significant/insignificant coefficients map.. 3 Bits. 0. 4 Bits. 0.17. 0.34. 5 Bits. 0.5. 0.67. 6 Bits. 0.84. 1. Fig. 8. The relationship between NCl / TCl and coding length for each coefficient at the lth-scale image data..
(8) (a). (b). (c) (d) Fig. 9. Compressed Lena images using AZE. (a) Rate = 1.0 b/pixel (PSNR = 40.12). (b) Rate = 0.5 b/pixel (PSNR = 36.95). (c) Rate = 0.25 b/pixel (PSNR=34.02). (d) Rate = 0.125/pixel (PSNR = 30.50). 44 42 40. P SNR(db). 38 36 34 32 30 28 26. 0. 0.2. 0.4. 0.6 0.8 B it Rate(bpp). 1. 1.2. 1.4. Fig. 10. PSNR versus bit rate performance for poposed coder, for Lena. TABLE I CODING RESULT FOR 512¯512 LENA SHOWING PSNR (JPEG, EZW AND AZE) Compress Ratio Bit Rate(bpp) JPEG EZW AZE 8 1.0 38.81 39.55 40.12 16 0.5 35.15 36.28 36.95 32 0.25 29.86 33.17 34.02 64 0.125 24.63 30.23 30.50.
(9)
數據

相關文件
In this paper, we evaluate whether adaptive penalty selection procedure proposed in Shen and Ye (2002) leads to a consistent model selector or just reduce the overfitting of
This December, at the 21st Century Learning Hong Kong Conference, we presented a paper called ‘Can makerspace and design thinking help English language learning in local Hong
In this paper, we build a new class of neural networks based on the smoothing method for NCP introduced by Haddou and Maheux [18] using some family F of smoothing functions.
In this paper, we illustrate a new concept regarding unitary elements defined on Lorentz cone, and establish some basic properties under the so-called unitary transformation associ-
In this paper, by using the special structure of circular cone, we mainly establish the B-subdifferential (the approach we considered here is more directly and depended on the
Optim. Humes, The symmetric eigenvalue complementarity problem, Math. Rohn, An algorithm for solving the absolute value equation, Eletron. Seeger and Torki, On eigenvalues induced by
In this paper, a novel subspace projection technique, called Basis-emphasized Non-negative Matrix Factorization with Wavelet Transform (wBNMF), is proposed to represent
So, we develop a tool of collaborative learning in this research, utilize the structure of server / client, and combine the functions of text and voice communication via
