lEEE TRANShC'61ONS OFi ULTRASONICS, FERROELECTRICS, AND FREQUENCY COXTROL, VOL. 46, NO. 9, SEPTEMBER 2002 1203
Motion Artifacts of Pulse Inversion-Based
Tissue Harmonic Imaging
Che-Chou Shen and Pai-Chi
Li,
Senior Member, IEEE
Abstract-Motion artifacts of the pulse inversion tech- nique were studied for finite amplitude distortion-based harmonic imaging. Motion in both the axial and the lateral directions was considered. Two performance issues were in- vestigated. One is the harmonic signal intensity relative t o the fundamental intensity and the other is the potential im- age quality degradation resulting from spectral leakage. A one-dimensional [ 1-D) correlation-based correction scheme also ,was used to compensate for motion artifacts. Results indidated that the tissue harmonic signal is significantly af- fected by tissue motion. For axial motion, the tissue har- monic intensity decreases much more rapidly than with lat- eral ,motion. The fundamental signal increases for both axial and lateral motion. Thus, filtering is still required to remove the fundamental signal, even if the pulse inversion technique is aiplied. The motion also potentially decreases contrast resolution because of the uncancelled spectral leakage. Also, it was indicated that 1-D motion correction is not adequate if nonaxial motion is present.
I. INTRODUCTION
ISSUE harmonic imaging 11% the ability to improve
T
contrast resolution over corivent,ional fundamental imaging [1]-131. It lras become a n iniportant diagnostic toolin many clinical applicatioiis [4]. The tissue harmonic sig-
nal is generated by finite amplitnde distortion of a prop- agating sound wave, and the harnionics are generated a t frequencies that are multiples of the transmit frequency [5]-[?]. Conventionally, the t,issne liarmoriic signal is ex- tracted from the received ccho by band-pass or high-pass filtering. Although filtering can be efficiently implemented,
it also suffers froin pot.entia1 contrast dcgradation result- ing from spectral leakage
[a].
In other words: non-negligible harmonic coinpoirents may have been present a t the sur- face of the transducer prior to propagation if the pulse bandwidth is large or the ultrasound system itself is non- linear. Such a leakage signal propagates linearly and com- bines with tlic tissue harmonic signal. The leakage signal cannot be filtered out from the tissue harmonic signal due to the spectral overlap of the two signals, and it poten- tially degrades the contrast resolution in tissue harmonic imaging.The pulse iiiversion (PI) technique is a n alternative method to extract the tissue hnrmonic signal [9], [lo]. In Manuscript reccived January 10, 2002; accepted April 9, 2002. Sup- port partially supplied from the NatioiiiLl Science Council of R.O.C. under Grant NSC 90-2213-8-002-127, and partially from National Health Rcsearch Institute of R.O.C., is gratefully acknowledged.
The authors are with the Departnient. of Electrical Engineering. National TeLiwan University, Taipei, Taiwan 106, R.O.C. (email:
paichiecc.ee.iitn.edu.tw).
this case, two transmissions arc required for each acoustic beam line. After a pulse is transmitted in the first firing, the same pulse is inverted arid transmitted again im the second firing. The echoes in both firings are suniiiied to- gether to obtain a beam. Because m invcrted pulse is the original pulse with 180" phase shift, the met,liod also is
known as the phase-inversion technique [ll]. In the sum signal, the linearly propagated signal is caricellcd and only nonlinearly generated components remain. Thus, a bet- ter fiiridanierital signal cancellation is expected with the PI technique, ID addition, the contrast resolution can be improved as spectral leakage is completely cancelled [XI. Nonetheless, the P I technique requires twice the data ac- quisition time compared to the conventional filtering ap- proach. In other words, it suffers from frame rate reduction and potent,ial mot,ion artifacts. In clinical situations, mc- tion artifacts of t,he P I techniqnc result from the relative movement between the probe and the imaged tissue during the two firings. M W r motion, the linearly propagating sig- nal is not completely cancelled, and the harmonic intensity becomes smaller due to signal misalignment,. In addition, the frequency range of the uncancelled linear signal also may overlap'with the tissue harmonic signal and results in image degradation. It is the primary purpose of this pa- per to investigate such potential motion artifacts of t.hc PI technique in tissue harmonic imaging.
In Section 11, both the fnnda,niental signal intensity an8 the harmonic signal intensit,y are irivestigatcd using sirnil- lations and experiments when tissue motion is present,. In Section 111, acoustic radiation, patterns are simulated a r i d
experinieiitally measnred to investigate the motion effects on the sidelobe level. B-SCU images also are constructed to demonstrate the potential image quality degradation. The paper concludcs in Section IV with a discussion on the mo- tion artifacts of other imaging pulse sequences. Feasibility of motion correction is also studied.
11. MOTION EFFECTS ON SIGNAL INTENSIT\ In this section, riiotion effects on both the fundamen- tal and the harmonic signal intensity are investigated using simulations and experiments. The simulation model used is similar to the one used by Christopher [l] and Li arid Shen
131. The transmit waveform is first deconiposed int,o dis-
crete temporal frequency components. For each frequency component, continuous beam formation is approximated by incremental field propagation. At each increment; linear propagation is simulated based on the angular spectrmn 0885-30l0/$1~1.00 0 2002 IEEE
1204 IEEE TRANSACTIONS ON ULTRhSOhlCS. FEHROELI method (121, [13]. The nonlinear propagation is modeled using the finite amplitude distortion model [14]. As shown in the following equation, the finite amplitude distortion model utilizes the frequency domain solution t,o Burgers' equation, i.c.,
0.2:
I"
k="
In ( l ) ,
Az
is the propagation increment along the axial di- rection. The fundamental frequency is denoted by f andp
is a parameter representing the nonlinearity of the propa- gating medium. The term uk denotes the temporal velocity field a t frequency nf ( n is an integer) after linear propaga-
tion. Likewise, u, denotes the temporal velocity field after
nonlinear propagation. The sound velocity is denoted by e.
A 1-D linear array with 96 charulels was simulated. The array had a 0.3 mni pitch and the transmit focus was set to 55 mm away from the transducer. The trans- mit signal was a 2 MHz Gaussian pulse with a -6 dB 50% fractional bandwidth. The smooth Gaussian envelope produces less spectral leakage than envelopes with sharp edges. The propagating medium w a homogeneous and the nonlinear parameter
0
was 3.5> approximating the nonlin-ear property of water [15]. To obtain the sum signal in the PI technique, two simulations were performed to ac- quire sound fields corresponding t o the positive and the negative pulses. The sound field generated by the positive pulse interacted with the imaged tissue a t an original posi- tion. Based on the tissue velocity and the pulse repetition interval (PRJ), the new position of the target was found and the sound field generated by the negative pulse was calculated. The imaged object is first assumed to be a sin-
gle Scatterer positioned in the focal point and the motion artifacts are investigated separately in the axial direction and in the lateral direction.
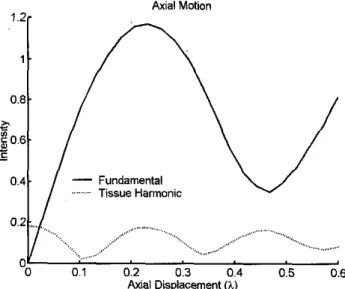
Fig. 1 demonstrates the siniulation results with ax-
ial motion. The horizontal axis is the axial displacement
(da&
normalized to the wavelength a t the fundamen-tal frequency (A) and the displacement is assumed to be sufficiently small compared to the duration of the pulse envelope. With no displacement, Fig. 1 shows that the second harmonic signal (dotted) is a t its maximum while the fundamental intensity (solid) is zero. As the displace- ment increases, it is shown that the second harmonic in- tensity changes with a period of X/4 and the fundamental intensity has a period of X/2. Also note that envelopes of the intensity curves decrease gradually due to the Gaus- sian pulse shape. Because the fundamental signal is much stronger than the harmonic signal, the fundamental in- tensity in the sum signal would become larger than the second harmonic intensity even when the displacement is
small. As shown in Fig. 1, the fundamental signal becomes dominant in the sun1 signal when the displacement is only
0.02X. With a typical PRI and realistic tissue motion, the displacement is below X/8. In this range, the second har- monic signal monotonically decreases and the fundamental signal monotonically increases.
... .... ,I(. ... ...
... ....
. . . ,,.# ... ... ... ...
ETHICS, A N D FREQUENCY cowrmL, VOL. 49, NO. 9, SEPTEMBER 2002 Axial Motion
041
/
-
FundamentalTissue Harmonic
Fig. 1. Signal intensities as a function of axial motion based on sim- ulations. The solid line is the fundamental intensity and the dotted line denotes the tissue harmonic intensity.
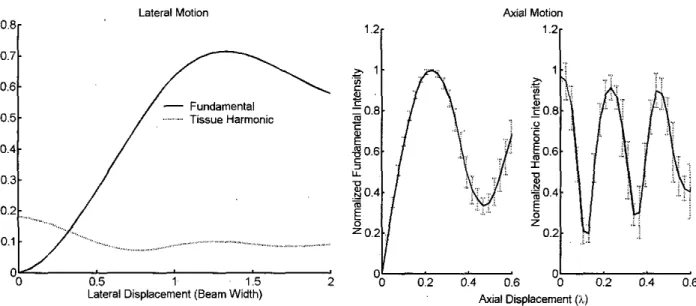
For lateral motion; the scatterer is originally positioned a t the focal point when the positive pulse arrives. The scatterer then nioves laterally between the two pulses. In this case, not only the lateral motion causes a time de- lay, intensity of the received signal also changes because the scatterer is a t a different position within the lateral radiation pattern. In Fig. 2 , the horizonlal axis represents the lateral displacement (dlateral) normalized to the beam width at the fundamental frequency, and the vertical axis denotes the signal intensities. It is demonstrated that the fundamental signal (solid) increases with t h e lateral mo- tion as the tissue harmonic intensity (dotted) decreases. It
is also shown that the tissue harmonic intensity becomes half of its maximum when the target is out of the acoustic beam. Compared to the axid motion, the harmonic in- tensity with lateral motion decreases a t a relatively slow rate. As shown in Fig. 2 , the fundamental intensity be-
comes larger than the second harmonic intensity when the displacement is larger than 0.3 times the beam width mea- sured at the focal depth. Thus, tissue harmonic imaging is less sensitive to the lateral motion in this case.
When human tissue is imaged, the received ultrasonic signal comes from a collection of scatterers in the sample volume. To investigate the motion artifacts when multiple scatterers are present, speckle signals were also simulat.ed. Signals from ten different scatterer distribution were sim- ulated and analyzed. Each distribution consisted of 100 scatterers randomly positioned around the focal depth. The velocity of tissue motion was assumed to be uniform. In other words, all scatterers moved in the same direct.ion with the same speed. The intensity curve for each distri- bution was first normalized to its own maximum and the mean and standard deviation of these normalized curves were calculated. The results are shown in Figs. 3 and 4
Lateral Motion
1'21
1205 Axial Motion7
-
Fundamental 0 5 - Tissue Harmonic x r $ 0 4 - 0 3 - I c - 0.5 1 1.5 2Lateral Displacement (Beam Width)
Fig. 2. Signal intensities as a funct,ion of lateral rrrotioii based on sim- ulations. The solid line is thc fundamental intensity and the dotted line dcnotes the tissue harmonic intensity.
error bars represent
+/-
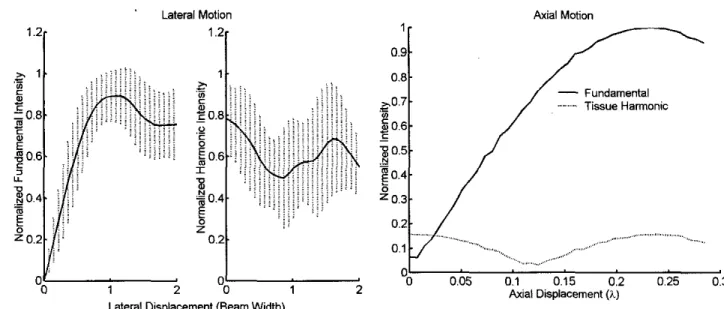
one standard deviation. The left panel of Fig. 3 denotes the fundamental intensity and theright panel shows the harmonic intensit.),. In both panels, the horizontal axis is the same a s that of Fig. 1. It is shown that the intensity curves with multiple scatterers are sim- ilar to those with a single scatterer when considering ax- ial motion. For lateral motion, the fundamental intensit,y curve is also similar to that with a siiigle scatterer. Nev- ertheless, t,lie harmonic intensity curve is different. Fig. 4 shows that the harmonic intensity docs not decrease to half
of the maxiinnin as tlie single scattering case in Fig. 2 . It
is also noted that the intensity curves with lateral niotion have larger variations. This is due to the fact that the lat- eral motion is more affected by the scatterer distribution within the sample volume.
Experiments were also conducted to investigate the mo-
tion effects on signal intensity. A schematic diagram of the experimental setup is shown in Fig. 5. An arbitrary funct,ion generator (Gage CornpuGen 1100, Montreal, QC, Canada) was used to generate the desired transmit wave- form. The transmit waveform was then sent to a power amplifier (Amplifier Research 25A250A; Soudcrton, PA) to drive a 2.25 MHz focused transducer (Panametrics V304, Waltham? MA). The transducer had a diarnet,er of 29 mm and was geometrically focused at 70 nnri. The target wits made of a nylon wirc with a diameter of 200 p i . A three- axis step motor system (CSI, Taipei, Taiwan, R.O.C.) was used to position the transducer and to control the rela- tive position between the wire target and the transducer. To ciriulate tlie target motion, a positive echo was first collccted with the target being positioncd at the focal point. Then, the transducer was moved step by step and
a negative pulse was transmitted a t different positions. The received signals were then sent to a n ultrasonic re- ceiver (Panametrics Model 58001 Waltham, MA). Finally,
u
'0 0.2 0.4 0.6
u
'0 0.2 0.4 0.6
Axial Displacement ( h )
Fig. 3. Simulated sigrial intensities as a function of axial motion. h4ultiple scattercrs are considered Left panel: fundamental intensity. Right panel: tissue harmonic intensity.
a n analog-to-digital converter with a 100 R.lsamples/s sani- pling rate arid 12-bit resolntion (Gage CompuScope 12100, Montreal, QC, Canada) was used to sample the signal. For each measurement> the acoustic signal was acquired 32 times for signal averaging. The experimental results are shown iii Figs. 6 and 7. Again, the second harniouic inten- sity decreases with motion while the fniidament,al intensity increases. The fundamental intensity becomes larger than the harmonic intensity a t 0.025X in Fig. 6 and a t 0.2 tinics tlie beam width in Fig. 7. The experimental results agree
with simulations.
The results in this section indicate that tissue motion has a significant impact on the signal intensity for the PI technique. Axial motion decreases tlie tissue harmonic intensity whereas the fundamental signal increases. The iiitensity curves change periodically within tlie pulse en-
velope. For lateral motion, the tissue harinonic intensity varies at a relatively slow rate. Because t~he wavelength and the radiation pattern are related to axial niotion and lateral motion respectively, the choice of the transmit fre- quency affects the sensitivity to niotiou. In other words, a higher frequency system would be more sensitive to motion due to its shorter wavelength and its narrower radiation pattern. Both simulations and experiments have also in- dicated that the PI technique is more susceptible to the axial motion than to tlie lateral motion. Axial motion di- rectly results in a time delay error (i.e., r = 2d,,i.,/c)
and affects the fundamental signal callcellation due to sig- nal misalignment. However, the time delay error resulted from lateral motion (i.e.: r = dfatCral/zc) is not as severe because the image depth t is usually inuch larger than the lateral displacement. It is also implied that even with the PI technique, a higb-pass filter is still rcqiiired to suppress the fundamental signal if tissue motion cannot be ignored.
9 . 1- 0.9- 0.8- .e -0.7-
.-
5
0.6. 0.5.E
0.4. b =0.3- u) c - N ._ - ' Lateral Motion Tissue Harmonic"I
0.2- 0.1 0 -0 1 2Lateral Displacement (Beam Width)
Fig. 4. Sinrulated signal intensitics as a function of latcrel motion. Multiple scatterers are considcred. Left panel: fundarricrital intensity. Right panel: tissue harmonic intensity.
... ... ... ...
.
... ... ...I .. I
Fig. 5. Schematic diagram of the experiment set-up.
111. MOTION A N D SPECTRAL LEAKAGE
Prcvious simulations and experimental results have demonstrated that the fundamental intensity increases when the imaged tissue moves. In fact, all linear propagat- ing signals increase due to tissue motion. If the transmit pulse has frequency components in the harmonic band- width (i.e., spectral leakage), the leakage signal is not can- celled in the sum. In this casc, the harmonic signal consists of two components. One is the desired tissue harmonic sig-
nal gencrated through finite arnplitnde propagation; the other is the unwanted leakage harmonic signal that is al- ready present prior to acoustic propagation. Thc,leakage signal produces an acoustic beam with different charac- teristics and significantly affects image quality. As shown
in Fig. 8, the solid line represcnts a typical radiation pat-
Fig. 6. Measured signal intensities as a function of axial motion. The solid line is the fundamental intensity and the dotted line denotes the tissue harmonic intensity.
Lateral Motion
0'
0 0.5 1 1.5
Lateral Displacement (Beam Width)
Fig. 7. Measured signal intensities as a function of lateral motion. T h c solid line is the fwrdaniental intensity arid the dotted line denotes the tissue harmonic intensity.
tern associated with thc tissue harmonic signal and thc dotted linc denotes a corrcsponding radiation pattern for the leakage liermonic signal. The sidelobes of the leakage signal are higher compared to those of the tissue harmonic signal. The lcakage signal caniiot he removed by filtering because it is in the s a n e frequency range as the tissue harmonic signal. Contrast resolution of tissue harmonic imaging is degraded by the high sidelobes due to the un- cancelled leakage signal.
Simulations and cxperirnents were performed t,o eval- uate cffccts of spectral l e a h g e in the presence of tissue motion. All parameters in the simulations are the same as
1207 SHEK AND Li: PULSE INVERSION-BASED TISSUE HARMONIC LhtAGlkG
Harmonic Beam Patterns Ada1 Motion
-
Total Harmonic-_--
Tissue Harmonic .,..,...,.. Leakage Harmonic J -6 '-4 -2 0 2 4 6 Lateral Posaion (mm) -401 'Fig. 8. Simiilatcd tissue harmonic beam pattern (solid) and leakage harmonic beam pattern (dottcd).
0 0.1 ' 0.2 0.3 0.4 0.5 0.6
Axial Displacement (1)
Fig. 9. Simulated signal intensities as a function of axial motion. The solid line is the total harmonic intensity, the dashed line represents the tissiic harmonic intensky and the dotted line denotes the leakage signal intensity. The t,ransmit pulse is a gated sine wave.
those uscd in Scctiom 11, cxcept that a 3-cycle sine wave, instead of a Gaussian pulse, was used as the transmit sig- nal. Because thc envelops of the gated sine wave is rect- angnlar, considerable leakage is present and it is linearly propag;lt,ed in the second harmonic band.' Fig. 9 sliows thc simulated Iiarmonic intensities with axial motion. Thc solid Iinc, the dashed linc and the dotted line represcnt the tot.al harmonic signal, the tissue harmonic signal and tlic lineitrly p r o p g a t e d leakage, signal, respectively. Thc l e a h g e harnionic signal is obtained by propagating the
transmit waveform linearly, and t,he total harmonic signal is generated by using nonlinear propagation of the same waveform In other words, the total harmonic signal con- sists of a linear signal (i.e., the leakage harnionic signal) and a nonlinear signal (i.e., the tissuc harmonic signal).
As shown in Fig. 9, tlie tissue harmonic intensity and the leakffgc intensity at t,he focal depth vary with the axial
motion as expected. Compared to the harmonic intcnsity
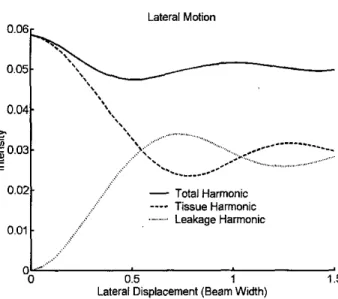
curvcs in Fig. 1 (i.e., Gaussian pulse with no significant spectral leakage), the t o t d harmonic intensity curve has significantly different characteristics from the tissue har- rmonic intensity. Moreovcr, altliougli the total harmonic intcnsity may be similar a t two diEerent displacements, the correspoiiding iniage quality may differ because the composition of the total harrnonic signal is not the samc. For examplc, the total harnionic int.ensity with a displace- ment of about X/8 is ahnost tlic same as that with no dis- placement. However, tlie leakage signal dominates i n the formcr case while the tissue harnionic signal is the only harmonic signal in the lat,ter case. Similar conclusions can be drawn for lateral motion as shown in Fig. 10. The total harmonic intensity is relat,ively uniform dispitc the fact that thc intensity cnrves cliange significantly for both tlie tissue harmonic signal and the Icahge harmonic signal. Simnlatcd harnionic radiation patterns a t the focal depth
with different tissne displacement along the axial direction
0.041
-
Total Harmonic----
Tissue Harmonic .,...,...,.. Leakage Harmonic 0.01 0 0.5 1 1.5Lateral Displacement (Beam Width)
Fig. 10. Simulated signal intensities as a innctiun of lateral motion. The solid line is tire total harmonic intcnsity, the dashed line rcpre-
sents the tissue harnronic intensity and the dotted line denotes the leakage signal intensity. The transmit pulse is a gated sine wave.
arc shown i n Fig. 11. It is demonstrated that the sidclobes increase due to the leakage signal and the iniage contrast is degraded when tissue motion is prcsent.
Experiments were also done to investigate the cffects
on image quality. Acoustic beam patterns in water were measured by a PVDF needle hydrophone (WTR Systenis TNUOOIA, Seattle, WA) with a 30 dB pre-amplifier gaix Position of the hydrophone was controlled by a t h r e e - a i s stcp motor syst~em (CSI, Taipci, Taiwan, R.O.C.). The liy- droplionc liad'a diameter of 0.6 nnn with a flat freqncncy responsc from 1 MHz to 20 MHz. The other instruments
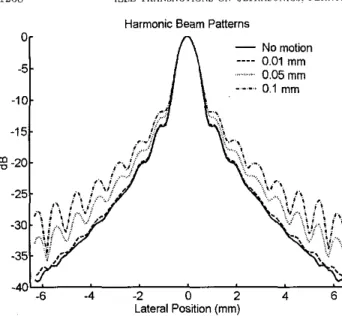
1208 IEEE TRANSACTIONS ON ULTIIASONICS. FERROELECTRICS, A N D FREQUESCY COSI'KOL: VOL. 49; Y O . 9: SEI'SEMRER 2002 Harmonic Beam Patterns
0
-
No motion TmadvE"----
0.01 mm -5 ,..,.,..,.. 0.05" -1 0 -1 5B
-20 -25 -30 -35 -40-6 -4 -2 0 2 4 6 Fig. 12. Schematic diagram of the hydrophone nieasurernent set-lip. Lateral Position (mm)
Fig. 11. Simulated harinonic bearn patterns with differcnt displace- ments. Solid line is 110 motion, dashed line is 0.01 nnn: dotted line is
Harmonic Beam Patterns
No motion 0
-5
----
0.01 mm 0.05 mm-
0.05 mm and the dot-dashed line is 0.1 mm.
,..,.,,...., -10 0.1 mm -15 -20
B
-25 -30 -35 -40 -45 arc the same as those shown in Fig. 5. A schematic dia-gram of the experimental setnp is shown in Fig. 12. Acous- tic beam patterns were sampled in the focal plane with a
spacing of 0.5 inmi. Because the t,ransducer was circularly- symmetric, acoustic b e a m generated by the transducer were also circularly symmetric. Therefore, only 1-D ra- dial measurements were performed. At cacli measwenleiit point; the acoustic field was measured 32 tinics for off-line signal averaging. The experimental results are shown in
Fig. 13. The solid line denotes the bean1 pattern with no rriot,ion and the dashed l i n c rcpresarits a d i s p l a c e m e n t of 0.01 mm between two firings. The dotted line arid the dot-
dashed line correspond to displacements of 0.05 inni and 5 10 15
0.1 mrn, respectively. It is shown that the motion elevates
imaging is affected. The faster the target moves, the more
degradation is introduced. The experimental results are consistent with previous sirnulation results.
denionstrate tlic contrast degradation due to motion. The
experimental setup is the same as that described in Fig. 5
except that a gelatin-based nlt,rasonic phantom with uni-
form distribution of glass heads (Sigma G4649, St. Louis,
MO) was used as a speckle generating object. An anechoic cyst was created inside the phantom for contrast analysis. The transmit signal was a 1.5 MHz gated sine pulse with a
duration of 3 cycles. Five different motions were considered by increasing the axial displacements between the positive
pulse and tlic negative pulse from 0 mm to'0.04 inin. In Fig. 14: results corresponding to displacements of 0 miu,
0.01 nim and 0.03 nnn are demonstrated. In the upper panels, spectra of the first scan line are shown and the corresponding B-scan images are illustrated in tlic lower panels. Spectral leakage is indicated by tlic elevated fini- daniental signal level. In Fig. 14, the anechoic cyst is more
.500
Lateral Position (mm)
the sidelobes and thus irrlagc quality i n tissue harniorlic ~ i13. hsieasllred ~ . imnrronic healn patterrls wit11 different displace- rncnts. Solid line is no mot,ian, dashed line is 0.01 ~ n m , dotted line is
0.05 nirn nrrd the dot-dashed line is 0.1 mm.
B-scan ultrasonic images were also construcLed t,o contaminated by the leakage harmonic signal when tlie displacement increases. This agrees well with the illcrcase of spectral leakage. Fig. 15 demonstrates the contrast he- twccn the anechoic cyst and the background. The contrast is computed from regions inside the two white l~oxcs in each B-scan image. The declining curve indicates that the
contrast^ decreases when the motion increases.
IV. DISCLESION AND CONCLUSIONS
In this paper, motion artifacts of PI-based tissnc har- monic iirlaging were inwstigated using siniulatioiis and ex- pcrinicrrts. It is shown that the tissuc harmonic signal is highly susceptihle to motion hetwecii the transducer and tlie imaged tissue. With motion, the tissue liarnionic sig- nal decreases, and the linear signal increases. The intensity
SHEN r\ND /,I: PULSE LN\'ERSION-BI\SED TISSUE HARhlONlC IhlAGLNG 1209
No Motion 0.01 mm 0.03 mm
1.5 3 4.5 1.5 3 4.5 1.5 3 4.5
MHz
Fig. 14. Spectra and B-scan images with axial displacements of 0 nrm, 0.01 mnr and 0.03 mm. Upper panels: spectra. Lowcr panels: B-scan images.
17.51
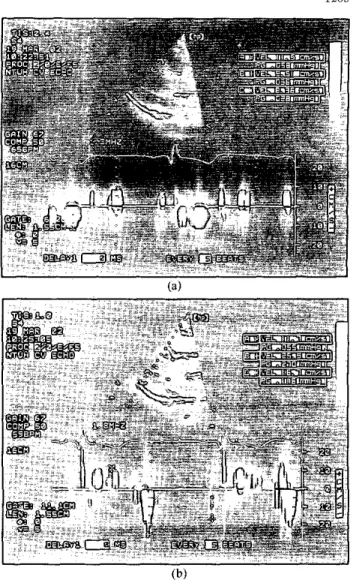
o,;4 Fig. 16. Tissuc Doppler image in P L A X . Dopplcr gate is positioned on t,he septum and posterior wall in (a) and ( b ) ; respectively. Markers A s B and C corresporrd to systole, early diastole and late diastole respectively.
0 0.01 0.02 0.03
Axial Displacement (mm)
Fig, 15. Image contrast as a function of axial displaccment.
gciierally is more sensitive to axial motion than to non- axial' motion. III clinical ,situat.ions, tissue motion is most proiioiniccd for cardiac irnaging. It is less important when iiriagiiig stationary or slow moving structures. The my- ocardial motion was assessed in order to indicate the clin- ical relemnce of the results of this paper. Fig. 16 was ac- qiiircd in Tissue Doppler mode using a conimercial scanncs (Hewlet,t-Packard SONOS 4500, Palo Alto, CA). A healthy
young adult at the age of 26 was scanncd. The para-sternal
long axis vicw (PLAX) was used. The difference between Fig. 16(a) and (b) is the depth of thc Doppler gatc. The Doppler gate was positioned on the septum and t,hc poste- rior wall respectively in Fig. 16(a) and (h). The chamber between the septum and the posterior wall was the left ven- tricle. In both figures, three markers were nscd to indicate thrce different stat,es during a cardiac cycle. Markers A: B
and C correspond to ventricitlar systole, early diastole and late diastole, respectively. At the syst,ole stage, the septum
and the wall move inward with a velocity of 11.5 cm/s and 11.7 cm/s. At the early diastolc stage, tlie outward velocity incscases to 9.51 cm/s and 25.9 cni/s. Thc outward veloc- ity t,hen decreases to 8.6 cm/s a,nd 16.7 cm/s at the latc diastole stage. In general, the myocardial velocity is ahout the range from 10 cm/s to 25 cni/s. The velocity rangc is
consistcrit with that rcpnrt,ed iu [16]. Based on the typical frequency (1.5 MHz-3.5 MHz) and PRI (200 fis-300. bs)
used in c x d i a c applications, the corresponding displace- ment could be up to X/8. This was also the reason why tlic displacement betwcem 0 to X/8 was of primary concern whcn the Iiarmotiic intcrisity was discussed iu Section 11.
As showu in Fig. 1, a n axial displacement less than X/8
can diniiuish tlie tissue haruionic intensity significantly i n
the suin signal. For lateral motion, the harmonic intensity is Icss predict,ablc due to the random distribut,ion of scat- terers witliiu the sample volume. For hot,h motions, the fundamental signal niay increasc to a level much higher
1210 IEEE TRANSACTlONS ON ULTRASONICSI FERROEI.ECTRICSI FREQUENCY CONTROL, VOL. 49; 9,
than the harmonic signal level for both directions. Tliis indicates that, filtering is still required to remove the fun- damental signal even though the PI technique was origi- nally developed to cancel the linear signal without the need of filtering. The high-pass filtering inevitably reduces the bandwidth of t,he tissue harmonic signal hecause some har- monic signals below the cutoff frequency are rejected. This degrades the axial resolution. Besides, a trade-off hetween lateral resolution and potential niotiori astifidcts also exists hecause high frequcncy signal is more susceptible to nio- tion. Motion artifacts also degrade the cont,rast resolution in tissue harmonic imaging. The tissue harnionic signal is contaminated by the leakage signal if the linear signal is not cancelled due to motion. In this case, t,he image con- trast is reduced because of the elcvdted sidclobes.
When tissue inhomogeneities are considered, the intem- sity curves with lateral motion become niore complicated due to the distorted radiation pattern. For axial motion, howcver, the intensity curves are not affected hecanse both positive and negative pulses suffer from the same phase er-
ror. In other words, the effects of tissue irrhoniogerieit,ies 011 intensity curves could be ignored wlien the image o h jcct moves in the axial direction. Note that the sidclohe difference hetween the tissue harmonic beam and the spec- tral leakage beam differs in the presence of tissue inhomo- geneities. The difference decreases when a larger phase er- ror is introduced
[SI.
In other words, the contrast between the image without motion a n d the image with motion is reduced in the presence of sound velocity inhomogeneities. The motion artifacts are even more severe when more firings are used to extract harmonic signals for each heam line. The multiple-firing scheme is also referred to as the phase-coded pulse sequence [17]. For exanlple, a phase-coded pulse seqnence with three pulses can bc nsed to cx-
tract the third harmonic signal. In this case, phases of the pulscs are O " , 120°, and 240°, respectively. Becanse the time needed for each sun1 signal increases, the multiple- firing scheme is more susceptible to motion. Also, the desired third harmonic signal decreases eveii faster than the second harmonic signal a? a function of displacement,. However, the pulse inversion Doppler (PID) technique
[lo]
does not directly suffer from the aforementioned intensity variation. This is due to the fact that tlie positive echo and the negative echo are not sumriled togdieer to obtain the harnioiiic sigrial. Instead, a conventional clutter filter is applied to the Doppler signal.
A simple scheme may be used to correct for the motion artifacts. A correlation-based time shift estimator may he
adopted to cstimate and cornpensate for the phase dif- ference introduced by the motion hetween the positive echo and the negative echo [18]. After motion compen- sation, the undesired fundamental signal is eliminated and the harmonic signal is restored. Figs. 17 and 18 show the simdated harmonic-to-fundamental ratios with axial mo- tion and lateral motion, respectively. All parameters in the simulations were the same as t,liose nsed in Section 11. The transmit signal was a 2 MHz Gaussian pulse with a
-6 dB 50% fractional bandwidth and the f/number in the
401 0 011 0:2 0:3 0:4 0:5 0:6
Axial Displacement (7.)
Fig, 17. Harrrionic-to-fundalnental ratio for axial motion correction. The solid line corresponds to the ratio before correction and t,he dotted line is thc ratio after correction.
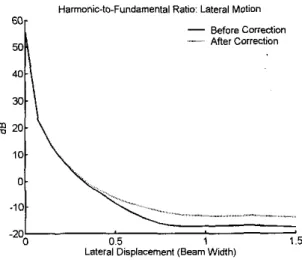
Harmonic-to-Fundamental Ratio: Lateral Motion
-
Before Correction,...,,,, Afler Correction
39
401\
Fig. 18. Harmanic-to-flmda,rlental ratio for lateral motion correction.
The solid line corresponds to thc ratio before correction and the dotted line is the ratio after correction.
simulations was 2 . The harmonic-to-fundamental ratio is
defined as the ratio of the harnionic intensity to the fun- damental intensity. The higher the ratio, the more effec- tive motion compensation is. The ratio is the highest with no displacenient. In this case, only tissue harmonic signal remains and the ratio is infinite. I t is shown that, when the axial mot,ion is considered, tlie correction scheme ef- fectively improves the harmonic-to-fundamental ratio. As
shown in Fig. 18, however, little improvement is obtained with lateral motion correction. This is because the simple correlat,ion-based method only accounts for axial motion. Because the 1-D correlation-based method generally does
not estimate the lateral motion, 2-D motion correction is required.
SBEN I U D LI: PULSE INVERSION-BASED TISSUE HARMONIC IMAGING 1211
ACKNOWLEDGMENT
The authors thank Dr. Lin at the National Taiwan Uni-
versity Hospital for getting t,he cardiac images and the re- viewers for insightful coinments.
REFERBNCES
[1] T. Christopher, "Finite amplitude distortion-had inhomoge- neous pulse echo ultrasonic imaging," I E E E P a n s . Ultrason.,
Ferroelect., Freg. Gontr., vol. 44. no. 1, pp. 125-139, Jan. 1997.
[2] T. ChriBtopher, "Expcrimentid investigation of finite amplitude distortion-based sccond liariiioriic pulse echo ultrasonic imag- ing: IEEE Tmns. Ultmson.. Ferroelect., F r q . Contr., vol. 45, P.-C. Li and C.-C. Shen, "Effects of transmit focusing on finite amplitudc distortion based second harmonic generation," Uitra- son. Imag., "01. 21, pp. 243-258, 1999.
F. l k m q u a r t , N. Grenier, V. Edcr, and L. Pourcelot, "Clinical
iise of oltramurtd tissue harmonic imaging," Ultrmound Med.
C. A . Cain. "Ultraionic reflection mode imaeine of the nonlinear no. I . pp. 158-162, hn. 1998. 131 [4] voi. 25, no. 6, pp. 8 8 ~ 8 9 4 , 1999. 151 , ,
_ -
parametcr D / A : I. A thmre1,icd ha.is," .I. Acoust. SOC. Amer., vol. 80, no. 1, pp. 28-32, July 1986.
R. T. Boyer arid S. V. Latcher, Nonli7~ear Acoustzcs. New York: [GI
Academic, 1969.
M. E. Haran and B. D. Cook, "Distortion of finite anrplitude ultrasound in lossy media." J . A c o w t . Sot. Ame 7.. "01. 73, no. (71
191
1121
1151
3, pp. 774-779, hi&. 1983:
C.-C. Shen arid P.-C. Li; "Harmonic leakage and image qual- ity degradation in tissue harmonic imaging? IEEE h n s . Ul- tmson., ~ ~ ~ fiY. ~ i
conir-.,
~ ~v o ~ . t 48, . , 3, pp. 728-736, May 2001.D. H. Simpson arid P. N. Burns, "Pulse inversion doppler: A new method for detecting nonlinear echoes from microbuhble con- trast agents," i n Pmc. IEEE Ultrason. Svmp., 1997, pp. 1597- 1600.
D. H. Simpson, C . T. Chin, and P. N. Burns, "Polsc inversion dopplcr: A new method for detecting nonlinear echoes from mi- crobubble contriut agents," I E E E n o n s . Ultmson., Fermelect., Fmg. Contr., "01. 46, no. 2, pp. 372-382, Mar. 1999.
P. Jiung, Z. Mae, and J. C. Lazenby, "A new harmonic irnug- ing sclicme with better fundamental frequency canccllation and higher signal-to-noise ratio," i n Pmc. I E E E Ultrason. Sump., D. L. Liu and R. C. W a g , "Propagation arid backpropagation for ultrasonic wavefront design; I E E E %na. Ultrason., F e m -
elect., I h q . Gontr., vol. 44, pp. 1-12, Jan. 1997.
3 . W. Goodman, Introduction to Fovricr Optics. New York: McGraw-Hill, 1968.
P. T. Christopher and K. J. Parker, "Ncw approaches tu non- linear diffraqtivc field propagation," J . Acoust. S K . Amer.> "01.
90, no. 1, pp. 488-499, July 1991.
W. K . Law, L. A. Rizzell, and F. Dunn, "Determination of the nonlinearity parameter B/A of biological mcdia," Ultmsound 1998, pp. 1589-1594.
hied. ~ i ~ i . , v o ~ . 11, no. 2, pp. :{07-3ia, 1985.
[16] K . Shan, 12. J. B i d l B. J. Poindexter, S. Shimoni, G. V. Letsou, M . J. Rcardon, J. F. Howell, W. A . Zoghbi, "Relatimi of tissue doppler dcrived myocardial velocities to myocardial structure and iieta-adrenergic receptor density in humans," J . A m . Coll.,
[17] W. Wilkcning, M. Krueger, and H. Emmert, "Phasecod& pulsc
sequeace for non-linear imaging," in Proc. IEEE Ultmson.
Sump., 2000, pp. 1597-1600.
[la]
L. F. Nock and G. E. lkahcy, "Synthetic receive aperture irnag- irig with phase correction for motion and for tiesue inhome gencities, Part I: Basic principles," I E E E %?Ls. U l t m m n . , Fer-melrct., Reg. Contr., vol: 39, no. 4, pp. 48S495, July 1992.
"01. 3, pp. 891-898,
scp
2000.ChcChou Shen xias born in 1976 in Tai- maon, R.O.C. He graduated from the Depart- ment of Electrical Engineering a t National Taiwan University i n 1998. He is now a Ph.D. student working on ultramnic harmonic irnag- ing under the inst,ruction ofl'rofessor P.-C. Li.
Pai-Chi Li (S'91-h1'93~S'93-M'95-S~4'01) received the B.S. degree i n electricill engineer- ing from National Taiwan University, Taipei, Taiwan, R.O.C., in 1987, and tlic M.S. and Pti.D. degrees from thc University of Michi-
can. Ann Arhor. in 1990 and 1994. resmc-
LkW
i rI.'. .
Lively, both in electrical engineering: systems. Dr. Li v i m a rescnrch assistant with the Department of Electrical Enginecring and Computer Science a t the University of Michi- gan from 1990 to 1994. He joined Acuson Cor- poration? Mountain View, CA, ai a meinbcr of the techuical staff i n June 1994. His work with Aciison w a pri- marily in the a r e s uf niedical ultraonic imaging system design for both cardiology and general imaging applications. In August 1997, he returned to the Departmentof Electrical Enginecring at National Taiwan University ils an Njsistant profcssor. He became an ass- ciate professor in August 1998. His current research interests include biomedical ultrasonoic imaging and signal processing.
He is a senior member of IEEE, and he was the recipient of the Distinguished Achicvement. Award in Electrical Engineering: Sys- tems for his outstanding acjniemic achievement at the University of Michigan