中國廣告市場之研究 - 政大學術集成
96
0
0
全文
(2) 中國廣告市場之研究. The Development of Advertisement Market in China. 研究生:李雲開. Student:Yun-Kai Lee. 指導教授:黃教授仁德. 立. Advisor: Jen-Te Hwang. 政 治 大. 國立政治大學. ‧ 國. 學. 中國大陸研究英語碩士學程. Nat. al. A Thesis. er. io. sit. y. ‧. 碩士論文. n. iv n C h eMaster’s Submitted to International in China Studies i U n g c hProgram National Chenchi University In Partial fulfillment of Requirement For Degree of Master in China Study. 中華民國 98 年 7 月 July. 2009.
(3) Abstract In the three decades prior to 1979, there was no advertising industry in China; TV and radio did not broadcast advertisements until the Third Plenary Session of the CCP (Dec. 1978) set up the guidance of the Socialism Modernization, which encouraged all industries, including the restoration and rapid growth of advertising.. Having been developed for more than 30 years, China’s advertising market was forecasted to become the world’s second largest market within a few years. The. 政 治 大 RMB. Moreover, the revenue from media advertising of the twelve Asia-Pacific 立. business had 640,000 employees, and an annual turnover of more than 10 billion. ‧ 國. 學. region countries rose to US$ 83.5 billion in 2006, and China shared more than half of the region’s total amount. China’s advertising revenue was estimated to reach. ‧. RMB267.5 billion in 2010, RMB519.6 billion in 2015, i.e. three times more than in. n. al. er. io. sit. y. Nat. 2006.. i Un. v. Even though the expenditure of Chinese Market is prosperously increasing, there. Ch. engchi. uncertainties still exist behind the prosperity and the development of the advertising market. These include the inefficiency of local Chinese advertising enterprises, on average 25 times less than foreign enterprises, and the low-productivity of local companies’ employees, which is estimated at 6 times less than that of the employees of foreign enterprises.. However, the forecast for China’s advertising market remains one of prosperous development, and the world still attaches great importance to it. Therefore, this study seeks to research and compare different data from academic sources, advertising. i.
(4) enterprises, and Chinese official documents in order to examine how modern Chinese advertising and modern media are ready to keep pace with the international society.. 立. 政 治 大. ‧. ‧ 國. 學. n. er. io. sit. y. Nat. al. Ch. engchi. ii. i Un. v.
(5) Contents Chapter 1 Introduction ……………………………………………………………… 1 1.1. Motivation and Purpose….………….………..………………………….. 1. 1.2. Research Methodology and Expect Results ……….……………...………2. Chapter 2 Development of China’s Advertising Market .…….…………………….3 2.1. Thirty-Year Lag in the Advertising Industry…………..….……………….4. 2.2. World’s 3rd Largest Advertising Market and Ranking …………….……….6. 2.3. Two Stages of Advertising Market Growth..……………………….….….10. 2.4. Internationalization of the Advertising Business and Its Influences …..…12. “Scattered and Weak” Domestic Companies…………....…...……13. 學. 2.4.2. ‧ 國. 2.4.1. 政 治 大 Multinational Advertising Giants in China…………..…..………..12 立. Well-off Families are accelerating the Advertising Market …….....……..14. 2.6. Summary …………………….....…………….………………………......17. ‧. 2.5. Nat. sit. y. Chapter 3 Characteristics of China’s advertising Market….…………….…..…….18. n. al. er. io. 3.1 Multiregional Market by Different Regions ……..………………………18. i Un. v. 3.2. Straightened and Controlled by the Legal System ……………...………..22. 3.3. Media Dominates the Market …………………..………………………..24. 3.4. Limited Grouping of Newspaper …..……………….…….……………...26. 3.5. Enormous Development of Private Advertising Enterprises…….….……30. Ch. engchi. 3.6 Summary ………………..……………..…………………………………31 Chapter 4 Status of China’s Advertising Market…………..……………………….32 4.1. Advertising Expenditure on Major Media…………………...…..…..……33 4.1.1. CCTV holds the Most Advantages in Market ……………….……35. 4.2. Advertising Expenditure of Enterprises ……………………………….....36. 4.3. Foreign & Domestic Famous Brands in China ...…………...…..………..36. iii.
(6) 4.4. Top Advertising Media in China ……………………..……….………….40. 4.5.. New Media in China…………….……………………………………….41 4.5.1. Internet & Cell phones ………….…………..………..……..…….43. 4.5.1.1 Popularity of Cell Phone in Major Cities…..…….….…………..47 4.5.2. Urban Popular Media: Buildings LCD TV.…………....…….…….47. 4.6. Top Advertising Agencies in China…………………………….…………49. 4.7. 2008 Beijing Olympics …………………..………….……….…………...50 Sponsors, Partners and Exclusive Suppliers of Beijing Olympics...53. 4.7.2. Advertising Spending during the Olympic Period ….....…....….…54. 治 政 4.7.3 Winners of Olympic Advertising ….………..……...….………….55 大 立 Summary………………………………………………………………….56 學. ‧ 國. 4.8. 4.7.1. Chapter 5 Perspective of China’s Advertising Market……………..………………58. ‧. 5.1 Online Advertising Attracts Advertisers………..….….…………….……58. sit. y. Nat. 5.2 Children are the Future Market……………………………….…………..60. 5.4. Problems of Chinese Advertising Market……..………...…..………..…..63. er. Trend of Growth in the Advertising Market …………….…….……..…..61. io. 5.3. al. 5.4.2. Insecure Consumers…………………….………………...…...…..65. 5.4.3. Disorganized Online Advertisements………………...……………66. 5.4.4. Lack of Consumer Credibility…………..…………………………68. n. 5.4.1. iv n C Influences of Financial h e nCrisis…………..…………………………63 gchi U. 5.4.5 Lack of Professional Manpower…………………………………...69 5.5. Summary………………………………………………………………….71. Chapter 6 Conclusion and Recommendations…........................…………………...72 References…………..................................................…………………………...…...78. iv.
(7) List of Tables Table 2-1 Popular Media in China……..…………………………………….……. 5 Table 2-2 Distribution of Advertising Turnover: 1983-2005……..…….....………..6 Table 2-3 Advertising spend of TV, Newspapers and Magazines in the 12 Asia Pacific Market: 2006-2007 ……………………………………….……..8 Table 2-4 Globe’s Top 4 Total Advertising Expenditure across all Media: 2005-2007 …...………….………………………………………….……..9 Table 2-5 Index of Chinese Advertising Industry: 1981-2006 ……………...……..11. 政 治 大 2006 …………..………………………………………...…..…………..14 立. Table 2-6 Numbers & Revenue of Local and Foreign Advertising Companies:. ‧ 國. 學. Table 2-7 Average Revenue Comparison between Local and Foreign Advertising Companies: 2006……..………..……………………...………………..15. ‧. Table 2-8 Spending on Cosmetics and Perfumes in China:1998-2003 …….....…..16. Nat. sit. y. Table 3-1 Development of Three Regions in China;2004 ……………….………..21. er. io. Table 3-2 Top 5 Advertising Developed Cities and Provinces in China:2003 …....22. al. n. iv n C h e Expenditure Distribution of Advertising n g c h i inUDifferent Media:2007-2008. Table 3-3 Shares of Advertising Companies & Media during the Initial Period…..25 Table 3-4. …………………………………………………………………………...26 Table 3-5 Major Newspaper Groups in China by Circulation:2008 …………..…..29 Table 3.6 Comparison of Types of Advertising Companies:2004 ………...……....31 Table 4-1 Advertising Expenditure of Major Media in China:2000-2006………....34 Table 4-2 Top Advertising Media by Revenue:2006-2007 …………………..…....35 Table 4-3 China’s Major Advertisers by Expenditure:2004-2007…….……….......37 Table 4-4 Best Domestic Brands in China: 2006………..………….………...…....39 Table 4-5 Most Valuable Brands in China………………….……………………....40 Table 4-6 Top Brands Spending in Different Media:2008…………………..…......41 v.
(8) Table 4-7 Globe’s Top 3 Internet & Mobile Markets ……………………….…......44 Table 4-8 Major Internet Sites/Portals in China……………….…....………..….....44 Table 4-9 Degree of Media Attention from Audiences in Major Cities…………....45 Table 4-10 Scale of China’s online advertising Market: 2001-2010 ……...…….....46 Table 4-11 To use or not to use Mobile Phones……………..……….….………....48 Table 4-12 Accumulation of Short Message Services in China: 2004-2006………48 Table 4-13 Attitude toward Buildings LCD TV in Major Cities………………...…49 Table 4-14 Recall Rates of Household TV & Building LCD TV…………….…....49 Table 4-15 China’s Top 10 Advertising Agency Ranking by Revenue:. 學. ‧ 國. Table 4-16. 治 政 2003-2006……………………………………………………………....52 大 立 Sponsors, Partners and Exclusive Suppliers to the Beijing Olympics....54. Table 5-1 New Product Information Images of Chinese Children ….…….…….....61. ‧. Table 5-2 Advertising Revenue Forecasts Based on 14.2% GDP Growth Rate.…..61. sit. y. Nat. Table 5-3 Advertising Revenue Forecasts Based on 9.5% GDP Growth Rate …....62. io. n. al. er. Table 5-4 Advertising Departments in China’s Institutions and Colleges………....70. Ch. engchi. vi. i Un. v.
(9) List of Figures Figure 2-1 Share of Major Media Spending in the Asia-Pacific Region……………7 Figure 5-1 Unified Format of the Websites of Sina and Alibaba…….…….......…..68 Figure 5-2 Consumer Confidence in Commercial Advertising…….…..…......…..69. 立. 政 治 大. ‧. ‧ 國. 學. n. er. io. sit. y. Nat. al. Ch. engchi. vii. i Un. v.
(10) Chapter 1. Introduction. 1.1 Motivation and Purpose Ever since starting work for the public media, the Police Radio Station, I have been strongly attracted to the tremendous activity and creativity of Taiwan’s advertising industry. Almost everyone in the prosperous and developed Taiwanese society is fascinated by commercials packed with brilliant ideas, and those outstanding offerings have led me to recognize that the spirit of competition in the advertising market is the. 政 治 大. crucial element to inspire the production of the better advertising of a public radio. 立. station.. ‧ 國. 學. China has two sides, separated by the Taiwan Strait, which became known as the “iron. ‧. curtain” after 1949. On the Taiwanese side, there is a well known “Taiwan. y. Nat. io. sit. experience” of a hard-working society, while on the other side of the Taiwan Strait,. n. al. er. China is writing its experience of a new economy, and many new lessons are being. Ch. i Un. v. created and need to be learned. China implemented an “open door” policy in the late. engchi. 1980s, which gradually narrowed the distance between the two sides, and fostered a sustainable and steady economic growth with an annual 10% GDP growth rate. On the contrary, because Taiwan had ignored the strengthening economic power of China for a decade, China’s reform less benefited Taiwan, and had the opposite effect on Taiwan’s. economic. development.. Moreover,. the. two. sides’ governmental. “decentralization” and governmental “streamline” policies were implemented at almost the same time, in the late 1990s, which prospered China but ensured the loss of government elites and competence in Taiwan. The opposing consequences of the reform of both sides demonstrated that the Taiwanese governmental system needed 1.
(11) more flexibility and vitality for better progress. Since the cross-strait governmental elements were closely related to their similarity of social and economic developments, it is essential to make a step-by-step analysis and study the development of China’s experience. This could begin with one of the creative industries, i.e. the advertising market, and it is the intention of this study to endeavor to reach a reasonable conclusion of the development of China’s advertising market to illustrate the merits and de-merits of China’s policy.. 1.2 Research Methodology and Expected Results. 治 政 The study will research and compare different sources大 of information from academic 立 data, the advertising business and official websites, in order to analyze and examine ‧ 國. 學. how modern Chinese advertising has developed, and has actively participated in the. ‧. economic arena, media and advertising enterprises, as a force which has permeated. sit. y. Nat. different levels of people’s lives, and become an integral part of modern family life. io. er. and social activities. These sources are gathered and analyzed to form academic. al. research literature. A large amount of the data based on advertising market research is. n. iv n C mainly from and focuses h e nwebsites, gchi U. taken from literature,. on describing the. development and status of the Chinese advertising market and the topics stated above. The data contained in this study is taken from the work of academics, Chinese officials and advertising industry statistics from enterprises, as well as some news reports for updated information.. 2.
(12) Chapter 2. Development of China’s Advertising Industry. China’s trade began as early as the Shang Dynasty (商朝, 1600-1046 B.C.), 1 when commercial activities, including the exchange of goods (seashell) and currency prospered during the Warring States Period (453B.C. to 221A.D.). In ancient China, merchants mainly promoted their goods by “bowls (叫賣),” “ veils (幌子),” “ flags (旗幟),” and “sign boards (招牌)” Then, after paper-making was invented in 106 AD, paper was very soon used by merchants to promote their businesses. In the late Chin. 政 治 大. ( 清 ) Dynasty, especially after the Opium War (1839-1842), the Great Powers. 立. imported numerous goods and capital into China, which intensified the competition. ‧ 國. 學. between domestic and foreign enterprises, and initiated advertising in the mass media and the birth of the advertising industry (Gu, 2007).. ‧ y. Nat. io. sit. After the founding of the People’s Republic of China in 1949, highly centralized and. n. al. er. planned economic systems prevented the development of the advertising industry for. Ch. i Un. v. a prolonged period of time. Prior to 1979, there was almost no advertising market in. engchi. China. Advertising was only undertaken by a dozen operating units, in which only a handful of employees delivered a few advertisements. Basically, television and radio did not broadcast advertising. Furthermore, in the era of the “Cultural Revolution,” Chinese society totally rejected advertising operations, and advertising commercials were forced to be suspended until the Third Plenary Session of the Eleventh Party in 1978. By taking economic construction as the central task, adhering to the Four Cardinal Principles, persevering in reform guided by the basic line, and the gradual liberation of people’s thinking, many of the economic field’s “forbidden zones” were 1. In accordance with Chinese characters, “Shan” has the same meaning as “commerce.” 3.
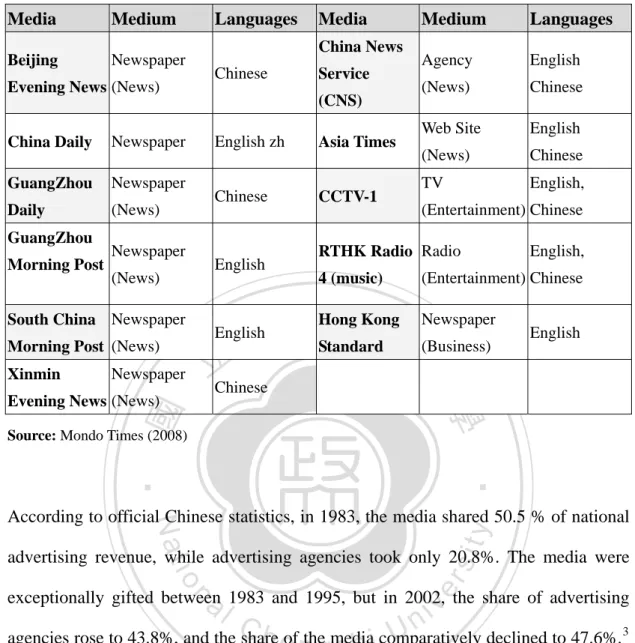
(13) demolished, and merchandise advertisements eventually appeared in China.. 2.1 Thirty-Year Lag in the Advertising Industry The Chinese government had been heavily involved in the media for three decades since 1949, since the large media organizations were agencies of the government. After Mao’s death, the Chinese media expanded significantly and became more autonomous and more diverse. Having become increasingly self-supportive by means of advertising revenue and circulation, the Chinese media had gained an advantage in the advertising market. According to reports, advertising in all Chinese media formats. 治 政 increased 35 times between 1981 and 1992. Print advertising 大 revenues jumped ten 立 times between 1990 and 1995, from RMB 1.5 billion to RMB 15 billion. Television ‧ 國. 學. revenues also increased dramatically, totaling US$2 million in 1995, rising above. ‧. US$6 billion in 2005 (CIA, 2009). By 2007, there were over 10,000 newspapers,. sit. y. Nat. magazines and TV news media in China. The on-line newspaper, Mondo Code LLC,. io. er. lists eleven media which have been identified as being “popular media” in China. 2. al. These include one news agency (CNS), one TV channel (CCTV-1), one radio station. n. iv n C (RTHK Radio Hong Kong,) one web Times Online Hong Kong,) and seven h esiten(Asia gchi U. newspapers. Nine of the eleven media provide an English version, and three are English only media, and another three are Chinese only. Four of these media are located in Beijing and Hong Kong, two in Guangzhou and one in Shanghai (Table 2-1).. 2. Based in Boulder, Colorado USA, Mondo Code LLC is an online production company providing information about, and access to, news media-newspapers, magazines, radio and television stations/networks. 4.
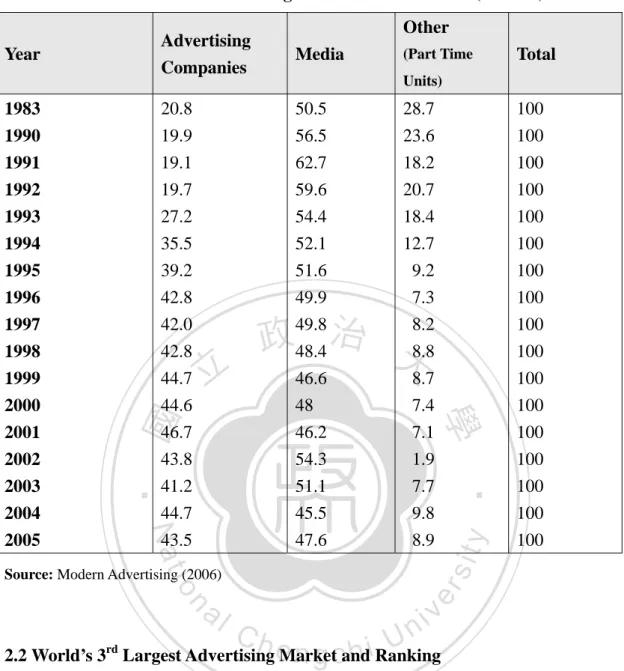
(14) Table 2-1: Popular Media in China Media. Medium. Languages. Beijing. Newspaper. China News Chinese. Evening News (News) Newspaper. GuangZhou. Newspaper. Daily. (News). Morning Post. Newspaper (News). Morning Post (News) Newspaper. Asia Times. Chinese. CCTV-1. Medium. Languages. Agency. English. (News). Chinese. Web Site. English. (News). Chinese. TV. English,. (Entertainment) Chinese. RTHK Radio Radio 4 (music). English,. (Entertainment) Chinese. 治Kong Newspaper 政 Hong Standard 大(Business). English. English. 立Chinese. ‧ 國. 學. Evening News (News). English zh. English. South China Newspaper Xinmin. Service (CNS). China Daily. GuangZhou. Media. Source: Mondo Times (2008). ‧ sit. y. Nat. According to official Chinese statistics, in 1983, the media shared 50.5 % of national. io. er. advertising revenue, while advertising agencies took only 20.8%. The media were. al. iv n C U h eofnthegmedia agencies rose to 43.8%, and the share declined to 47.6%. 3 c h i comparatively n. exceptionally gifted between 1983 and 1995, but in 2002, the share of advertising. This trend of relative increases and decreases reflects the status of the weakening advantage of the media in the advertising market. The distribution of part-time advertising units fell by 70% during the same period, and this demonstrated the inevitable professionalism of the advertising market in China in the early 2000s, proving that Chinese advertising companies had been equal to the media for two decades since the early 1980s. (Table 2-2). 3. The National Bureau of Statistics is an institution under the direct jurisdiction of the State Council. The major duty of the NBS is to undertake organizational leadership and coordination of national statistical work to ensure that statistical data is true, accurate, responsible and timely. 5.
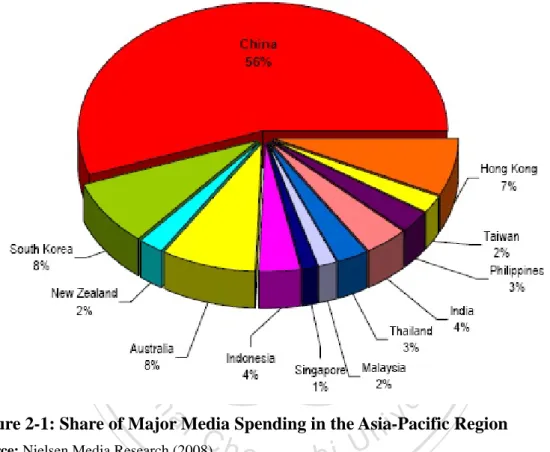
(15) Table 2-2: Distribution of Advertising Turnover: 1983-2005 (Unit:%) Other. Advertising Companies. Media. 1983. 20.8. 50.5. 28.7. 100. 1990 1991 1992 1993 1994 1995 1996 1997 1998 1999 2000 2001 2002 2003 2004 2005. 19.9 19.1 19.7 27.2 35.5 39.2 42.8 42.0 42.8 44.7 44.6 46.7 43.8 41.2 44.7 43.5. 56.5 62.7 59.6 54.4 52.1 51.6 49.9 49.8 48.4 46.6 48 46.2 54.3 51.1 45.5 47.6. 23.6 18.2 20.7 18.4 12.7 9.2 7.3 8.2 8.8 8.7 7.4 7.1 1.9 7.7 9.8 8.9. 100 100 100 100 100 100 100 100 100 100 100 100 100 100 100 100. 政 治 大. 學. Total. n. y. er. io. al. ‧. Nat. Source: Modern Advertising (2006). sit. 立. (Part Time Units). ‧ 國. Year. Ch. engchi. i Un. v. 2.2 World’s 3rd Largest Advertising Market and Ranking China’s tremendous economic boom and its rise in consumption have sustained it for decades, and the country is currently regarded as the dominator of the Asia-Pacific region’s advertising market. Nevertheless, as a key driver of the Asia-Pacific region’s economic growth, accompanied by its significant growth in the advertising market, China has become one of the world’s leading advertising markets. 4 In terms of expenditure on major media in own countries, China took the lead, accounting for more than half, i.e. 56% of the total spending of the Asia-Pacific region in the year 4. According to a survey by Zenith Optimedia, China’s advertising market will reach US$25 billion in 2011, after the United States, Japan, Great Britain, and Germany. 6.
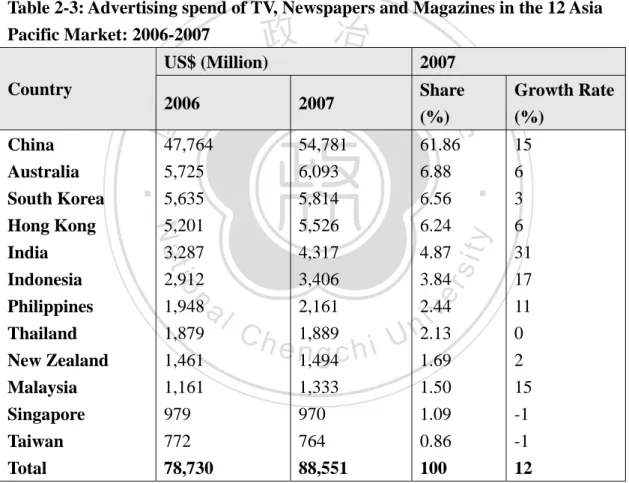
(16) 2005. China was followed by Australia and South Korea, both with an 8% share, Hong Kong took third place with a 7% share, India and Indonesia followed with 4%, the Philippines and Thailand had a 3% share, Taiwan, Malaysia and New Zealand shared 2%, and Singapore only had 1% (Figure 2-1).. 立. 政 治 大. ‧. ‧ 國. 學. n. er. io. sit. y. Nat. al. i Un. v. Figure 2-1: Share of Major Media Spending in the Asia-Pacific Region. C Source: Nielsen Media Research (2008) h. engchi. Two years later, a report focusing on “Asia-Pacific region advertising broadcast monitoring services,” released by Nielsen Media Research in 2007, indicated that, within the Asia-Pacific region’s 12 major markets, advertisers were sustaining unprecedented investment in major media, amounting to US$885 billion, and that China had attracted 62% of the advertising budget to its major media from the Asia-Pacific region. India performed the highest growth rate of 31% in the same year, dramatically recovering from the previous year, in which it had only increased by 0.78%. In Taiwan and Singapore, the two nations were facing a long-term recession 7.
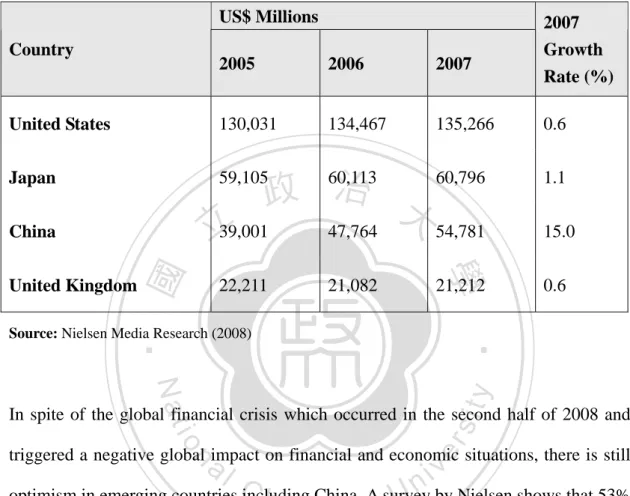
(17) which caused a downturn of advertising in the major media, with both reporting a -1% growth rate, while Taiwan’s share of the Asia-Pacific region’s total expenditure on major media had descended to less than 1% as early as 2006 (Table 2-3). In terms of the global advertising market, China’s total advertising spend, with an annual 15% growth rate, reached US$54 billion in 2007, which was only 10% (US$ 6 billion) less than Japan (Table 2-4). China was expected to rank the 2nd largest advertising market in the world in 2009 (Times, 2005).. Table 2-3: Advertising spend of TV, Newspapers and Magazines in the 12 Asia Pacific Market: 2006-2007. Ch. engchi. 15 6 3 6 31 17 11 0 2 15 -1. y. sit. er. n. al. 61.86 6.88 6.56 6.24 4.87 3.84 2.44 2.13 1.69 1.50 1.09. ‧. 54,781 6,093 5,814 5,526 4,317 3,406 2,161 1,889 1,494 1,333 970. (%). Growth Rate (%). 學. 47,764 5,725 5,635 5,201 3,287 2,912 1,948 1,879 1,461 1,161 979. io. Taiwan Total. 2007. Nat. China Australia South Korea Hong Kong India Indonesia Philippines Thailand New Zealand Malaysia Singapore. 2006. ‧ 國. Country. 政 治 大 US$ (Million) 2007 立 Share. i Un. v. 772. 764. 0.86. -1. 78,730. 88,551. 100. 12. Source: Nielsen Media Research (2008). The “fastest-growing” forecast for the development of major media in the Asia Pacific region is expected to remain from 2007 to 2011, and investment of major media in Asia Pacific is forecast to grow by 9.6% annually, which is faster than any other region. This is expected to increase from US$297 billion in 2006 to US$ 470 billion 8.
(18) in 2011. China will continue to record double-digit annual growth with an average 16.8%, next to India’s 18.5% compound annual growth rate (PRNewswire, 2007).. Table 2-4: Globe’s Top 4 Total Advertising Expenditure across all Media: 2005-2007 US$ Millions 2005. 2006. 2007. United States. 130,031. 134,467. 135,266. Japan. 59,105. China. 立39,001. 47,764. 54,781. 15.0. 22,211. 21,082. 學. Country. 2007 Growth Rate (%). 21,212. 0.6. ‧ 國. 60,113 60,796 政 治 大. United Kingdom. 1.1. ‧. Source: Nielsen Media Research (2008). 0.6. sit. y. Nat. io. er. In spite of the global financial crisis which occurred in the second half of 2008 and. al. triggered a negative global impact on financial and economic situations, there is still. n. iv n C optimism in emerging countries including A survey by Nielsen shows that 53% h e nChina. gchi U of consumers from the world’s 53 major markets consider that their country is trapped in a prolonged recession which will last for more than 12 months. Yet, 18% of consumers, concentrated in a handful of emerging markets like India, Vietnam, China, and Russia, expect their country to break out of recession within the next 12 months. On the contrary, consumers in Japan, Germany, Argentina, Mexico, Turkey, Italy, Taiwan, the USA, and Spain were the least optimistic about the prospects of a quick economic recovery (Nielsen Wire, 2008). This still promises a ranking up of China in. 9.
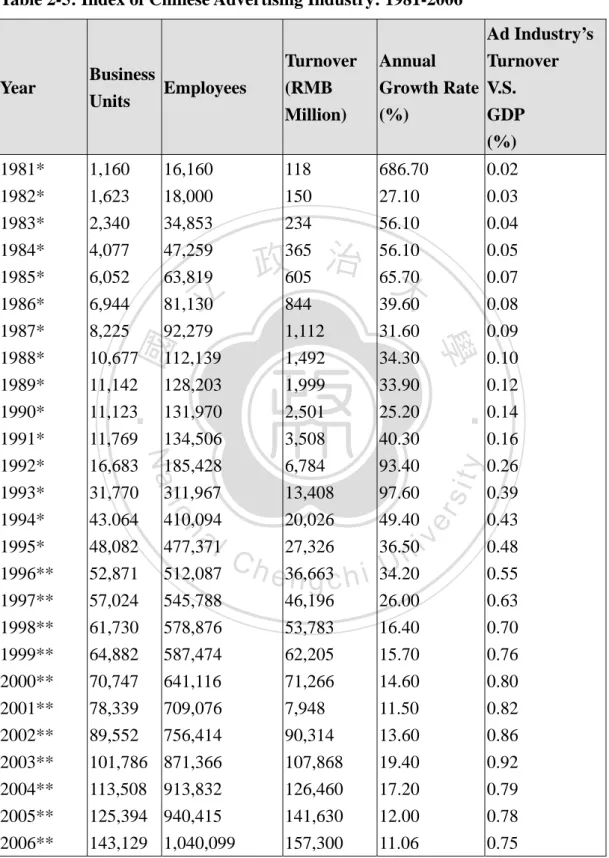
(19) the global advertising market. 5. 2.3 Two Stages of Advertising Market Growth When China reopened its advertising market, Shanghai city media instantly responded. In January 1979, Shanghai Television initiated the nation’s first television commercial and the Shanghai “Liberation Daily” published the first commercial advertisement. Today, the prosperous development of China’s advertising market has made it one of the world’s largest, driven by China’s continued economic growth. Between 1981 and 2004, the advertising market’s annual turnover was exceeded 1,000 times, and its ratio. 治 政 of growth rate against GDP rose from 0.024% to大 0.93% (China Daily, 2004). 立 Although China’s advertising market has rapidly developed into one of the world’s ‧ 國. 學. greatest markets, it still has some way to go to reach a mature stage. In accordance. ‧. with the “Rostovian Take-off Model,” 6 the development of China’s Advertising. sit. y. Nat. Industry has traveled through the Traditional Society to the “Preconditions to. io. al. n. to Maturity”.. er. Take-off” and “Take-off” stages, but is still a few steps away from the stage of “Drive. Ch. engchi. i Un. v. The Center for Studies of Media Development at Wuhan University considers that the “Initial stage” of the development of China’s advertising market was accomplished in 1995. The ratio of advertising turnover against GDP surpassed 0.5% in 1996 and drove a new stage of development, i.e. the “Take-off” stage, which has lasted until the present year, and has almost evolved (Chang, 2006). In 2006, China’s ratio against GDP was driven to 0.92%, only 0.02% away from the “Maturity stage”, but it 5. Overall global advertising spend is expected to decline by at least 4-6% in 2009. On the contrary, according to Carat Media, the forecast of the Chinese ad market will grow by at least 6.9% in 2009. 6 The Rostovian take-off model (also called "Rostow's Stages of Growth") is one of the major historical models of economic growth. It was developed by W. W. Rostow. The model postulates that economic modernization occurs in five basic stages, of varying lengths. 1. Traditional society. 2. Preconditions for take-off. 3. Take-off. 4. Drive to maturity. 5. Age of High mass consumption. 10.
(20) eventually failed because of the ratio declines in the ensuing years (Table 2-5).. Table 2-5: Index of Chinese Advertising Industry: 1981-2006. Year. Business Employees Units. Turnover (RMB Million). Ad Industry’s Annual Turnover Growth Rate V.S. (%) GDP (%). 1981*. 1,160. 16,160. 118. 686.70. 0.02. 1982* 1983* 1984* 1985* 1986* 1987* 1988* 1989* 1990* 1991* 1992* 1993* 1994* 1995* 1996** 1997** 1998** 1999** 2000** 2001** 2002** 2003** 2004** 2005** 2006**. 1,623 2,340 4,077 6,052 6,944 8,225 10,677 11,142 11,123 11,769 16,683 31,770 43.064 48,082 52,871 57,024 61,730 64,882 70,747 78,339 89,552 101,786 113,508 125,394 143,129. 18,000 34,853 47,259 63,819 81,130 92,279 112,139 128,203 131,970 134,506 185,428 311,967 410,094 477,371 512,087 545,788 578,876 587,474 641,116 709,076 756,414 871,366 913,832 940,415 1,040,099. 150 234 365 605 844 1,112 1,492 1,999 2,501 3,508 6,784 13,408 20,026 27,326 36,663 46,196 53,783 62,205 71,266 7,948 90,314 107,868 126,460 141,630 157,300. 27.10 56.10 56.10 65.70 39.60 31.60 34.30 33.90 25.20 40.30 93.40 97.60 49.40 36.50 34.20 26.00 16.40 15.70 14.60 11.50 13.60 19.40 17.20 12.00 11.06. 0.03 0.04 0.05 0.07 0.08 0.09 0.10 0.12 0.14 0.16 0.26 0.39 0.43 0.48 0.55 0.63 0.70 0.76 0.80 0.82 0.86 0.92 0.79 0.78 0.75. n. engchi. Note: * represents take-off stage, ** represents take-off Stage Source: Chang (2007). 11. y. sit. er. io. Ch. ‧. Nat. al. 學. ‧ 國. 立. 政 治 大. i Un. v.
(21) 2.4 Internationalization of the Advertising Business and Its Influences Foreign advertisers have understandably been attracted by the huge business potential of China’s fast-growing market, and advertising groups began to trigger their cross-border global expansion strategy as early as the 1960s. The top five advertisers measured by business turnover in the early 1990s were all domestic companies, but by 1996, foreign advertising firms occupied the market’s top five positions, with only 2 domestic Chinese advertisers ranking among the top 10 (Pan, 2006). Since 1996, the top 6 largest multinational advertising groups all seized a place in China. Similarly, only two local advertising companies squeezed into the list of the national top 10 annual turnover in 2005.. 2.4.1 Multinational Advertising Giants in China. 學. ‧ 國. 立. 政 治 大. ‧. In 1979, the French Publicis Group was the first foreign advertising group to open a. sit. y. Nat. branch in China. When the government issued tough limitations on certain types of. io. er. foreign investment in the 1980s and early 1990s, there were virtually no new foreign. al. entrants to China’s advertising market. In accordance with China’s timetable of. n. iv n C accession to the World Trade Organization, investment holding joint venture h e n g foreign chi U. advertising companies was allowed to be established after December 10, 2003. On December 10, 2005, wholly owned foreign advertising companies would be allowed to become established in China. Prior to this period, big multinational advertising firms with large stores of capital anxiously strengthened and expanded their market positions through mergers and acquisitions with big local advertising companies. Initially, Shanghai Eastbest International signed a joint venture with the WPP Group of Britain and Hakuhodo of Japan at the end of 2002, and converted its Shanghai branch into the first Sino-foreign joint venture advertising company in China (Xinhwa News, 2002).. In mid 2006, the world’s top multinational advertising group joint 12.
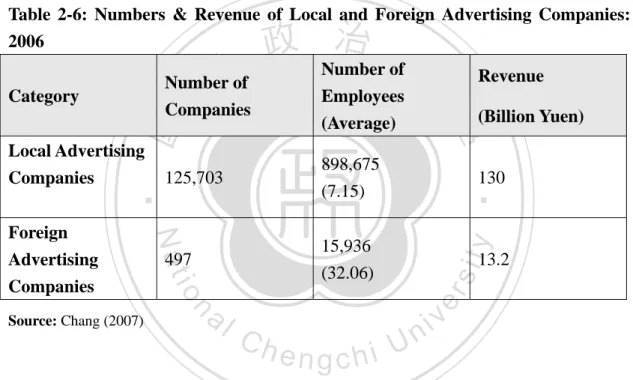
(22) ventured 38 advertising companies with a local Chinese corporation. About half of these companies were co-established by the British advertising giant, the WPP Group, and Chinese Advertising companies, followed by the world’s largest advertising agencies, the Omnicom Group(宏盟集團), the IPG Group (USA) and Publicis Group(陽獅集團) (Muzi, 2006). The most famous of the 5 major groups in the global advertising market, namely Omnicom, WPP, IPG, Publicis, Dentsu, as well as Havas, have numerous subsidiaries which provide customers with advertising, marketing, public relations, Internet marketing, customer relationship management and advisory services. In 2003, the share of the global advertising market of these 6 business. 治 政 groups reached 66% in total, and the WPP is currently 大 China’s largest advertising 立 group (Hong Kong Trade Development Council, 2005). ‧. ‧ 國. 學. 2.4.2 “Scattered and Weak” Domestic Companies. sit. y. Nat. The Chinese domestic advertising market allows companies to enter the advertising. io. er. business at a low threshold, which has caused domestic advertising companies to. al. become “scattered and weak,” making it difficult for them to confront highly. n. iv n C capitalized foreign advertising companies, severely limiting the innovation of h e n gand chi U. domestic advertising services. Additionally, in 2006, local advertising companies had an annual turnover of RMB 140 billion, whereas foreign advertising companies reached an average of RMB 26.64 billion. The average productivity of each local advertising employee is RMB 145,000 per year, and the gap between employees of foreign and domestic advertising companies has a 5 times efficiency.. A study by Wuhan University concludes that these local advertising companies are in deep crisis, and that “a high degree of dispersion and a high degree of being scattered and weak,” accurately sums up the critical situation of local advertising companies in 13.
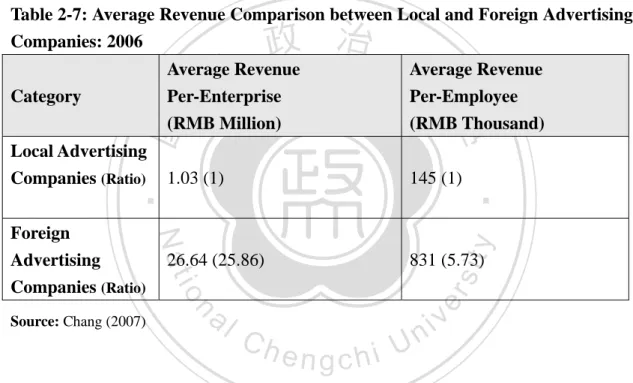
(23) China. Nevertheless, in 2006, the number of Chinese advertising companies sharply increased from the previous year, with a growth rate of 7.3%. At the same time, the number of employees of domestic advertising companies increased by 10.2%. In contrast, the advertising revenue dropped by 6.3 % compared with the year 2005. The domestic advertising industry is described as being “the more scoped, the more scattered,” which makes it more difficult for it to gain advantage from the advertising market. (Tables 2-6 and 2-7). Table 2-6: Numbers & Revenue of Local and Foreign Advertising Companies: 2006. ‧ 國. sit. 13.2. er. n. al. (Billion Yuen). 130. 15,936 (32.06). 497. io. Source: Chang (2007). 898,675 (7.15). 125,703. Nat. Foreign Advertising Companies. Revenue. ‧. Local Advertising Companies. Employees (Average). 學. Number of Companies. y. 立. Category. 政 治 大 Number of. Ch. engchi. i Un. v. Although local advertising companies took the lead in terms of quantities and total revenue in the market, the statistics in Table 2-7 indicate that foreign advertising companies are, on average, 5.73 times more capable of attracting revenue than local companies. Nevertheless, there is a surplus capacity of, on average, 25.86 times of foreign companies’ employees than domestic companies’ employees.. 2.5 Well-off Families are accelerating the Advertising Market On account of the explosive increase in wealth, consumption habits are undergoing a. 14.
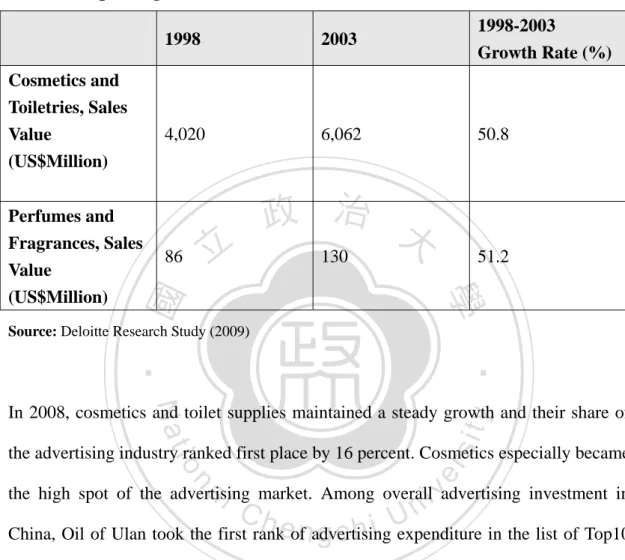
(24) rapid change in China. Studies show that China is expected to process more than 400 million well-off families by 2015, following only the United States, Japan and the United Kingdom. Prior to this date, the number of families of urban households with an annual income of more than RMB 250,000, which were defined as being “well-off families”, reached 1.6 million in China by 2008. Whereas most Chinese consumers were buying luxury goods in foreign countries a few years ago, 60% of luxury goods are now purchased within China (McKinsey, 2009).. Table 2-7: Average Revenue Comparison between Local and Foreign Advertising Companies: 2006. 政 治 大 Average Revenue Average Revenue 立 Per-Enterprise Per-Employee. 學. (RMB Thousand). 1.03 (1). 145 (1). y. n. al. 831 (5.73). sit. 26.64 (25.86). io. Source: Chang (2007). Nat. Foreign Advertising Companies (Ratio). er. Local Advertising Companies (Ratio). ‧. (RMB Million). ‧ 國. Category. Ch. engchi. i Un. v. In the scope of advertising development, China entered a slow growing period in terms of advertising spending in 2005, except for the acceleration of advertising expenditure on luxury products by China’s middle class, especially high-end women living in urban areas, influenced, to some degree, by western culture and who tend to want to pursue a western lifestyle. This facilitated the burgeoning of credit card advertising spend, which grew by 80% to RMB 900 million, and foreign alcoholic beverages, which surged by 156% to reach RMB 1.1 billion in 2005 (People’s Daily, 2006). Consumer spending on cosmetics and perfumes in China simultaneously grew. 15.
(25) about 50 percent between 1998 and 2003 (Table 2-8), in line with expenditure on their advertising.. Table 2-8: Spending on Cosmetics and Perfumes in China:1998-2003. Cosmetics and Toiletries, Sales Value (US$Million). 2003. 1998-2003 Growth Rate (%). 4,020. 6,062. 50.8. 政 治 大. 立. 86. 130. 51.2. ‧ 國. 學. Perfumes and Fragrances, Sales Value (US$Million). 1998. Source: Deloitte Research Study (2009). ‧. Nat. sit. y. In 2008, cosmetics and toilet supplies maintained a steady growth and their share of. n. al. er. io. the advertising industry ranked first place by 16 percent. Cosmetics especially became. i Un. v. the high spot of the advertising market. Among overall advertising investment in. Ch. engchi. China, Oil of Ulan took the first rank of advertising expenditure in the list of Top10 advertisers, while L’Oreal had the highest increase of 89%, which formed an era of “she” in China and represents the fastest growth of luxury consumption. A survey showed that high-end women in eight of China’s first tier cities, which included Beijing, Shanghai, Guangzhou, and Shenzhen, reached 1.67 million with a trend of leaping forward. 7 The potential of the consumption of these high-end women is. 7. The definition of high-end women: defined by income, defined in the standard of a 20-45 year-old female personal income or household income (if one of them can meet it). Beijing, Shanghai, Guangzhou, Shenzhen and Hangzhou cities, such as a class: Personal monthly income above RMB 5,000 or monthly family income above 15,000 RMB. Chongqing (for Chengdu in 2007), Wuhan and Shenyang, such as second-class city: Personal monthly income above RMB 3,000 or family monthly income of more than RMB 10,000. 16.
(26) growing by an average monthly income of RMB 7,000, with an average annual family income as high as RMB 240,000. In their daily lives, the high-end women surveyed were accustomed to watching television (90.8%), reading newspapers (78.5%), surfing the Internet (69.2%), listening to the radio (24%), and reading magazines (28%). Compared with 2007, high-end women who live in urban areas are rapidly increasing their behavior of on-line shopping on the Internet, and 72% of them bought goods by their own capacity and determination of consumption, thus supporting the exceptional growth of luxury products in a declining market in China (CTLS, 2008).. 2.6 Summary. 立. 政 治 大. China has been identified as the dominator and key driver of economic growth of the. ‧ 國. 學. Asia-Pacific region. Furthermore, it has become one of the world’s leading. ‧. advertising markets, the Globe’s 3rd largest advertising market next to the USA and. sit. y. Nat. Japan, and with the promise of ranking up in the Globe’s market, China is expected to. io. er. surpass Japan within years by two digits of growth rate, disregarding the Financial. al. Crisis of 2008. Ever since the development of China’s advertising industry,. n. iv n C advertising media has benefited from of the advantages of the market and has h emost ngchi U profited by two digits of growth rate annually. However, the rapid development of domestic and especially foreign, advertising businesses eventually changed the industry, concealing its glory from the media. At the same time, the more the requirements for advertising services, the better-class level demanded by clients, which is a skill owned by foreign advertising companies which provide the better professional services. These companies have taken over 20% distribution of the market and weakened domestic players, especially part time domestic advertising companies, turning them into “scattered and weak” firms.. 17.
(27) Chapter 3 Characteristics of China’s Advertising Market Between 1949 and 1978, the development of advertising in PRC walked a rugged road, since the implementation of the Planning Economy had shrunk the commodity economy, and the role of the market had been totally neglected. China’s economic system had contributed to the loss of the conditions and the soul of the development of the advertising market. Since the establishment of market-oriented economic development and the opening up policy of 1978, China proceeded to integrate the. 政 治 大. tenets of Marxism by “touching stones across the river” to build up socialism with. 立. Chinese characteristics, trying to find new ways of building socialism within the. ‧ 國. 學. nation. 8 In 2007, the 17th Party Congress of CCP eventually and ideologically defined the “socialist road with Chinese characteristics”. Under the leadership of the. ‧. Communist Party of China, based on fundamental national conditions, this involved. y. Nat. io. sit. taking economic construction as the center, and the four cardinal principles, sticking. n. al. er. to reform and opening up, the liberation and development of social productive forces,. Ch. i Un. v. consolidating and improving the socialist system, and building a socialist market. engchi. economy, socialist democracy and socialist advanced culture, a socialist harmonious society and a prosperous, democratic, civilized and harmonious modern socialist country (Xinhua Net, 2007).. 3.1 Multiregional Market by Different Regions Although the advertising industry is still undergoing rapid development, an imbalanced economic development is causing a problem in the market. For Example, the turnover of advertising companies in Beijing, Shanghai and Guangdong 8. “Cross the River by Touching the Stones” is a famous Deng quotation and the principle of political and economical reform in China. 18.
(28) comprised half of the country’s total advertising business. Further data shows that the development of the convention and exhibition industry in China is also highly imbalanced. The stage of development reached in each region varies widely, and can be distinctly classified into three large groups, the first of which includes the leaders of the advertising industry, in Beijing, Shanghai and Guangdong, which account for a respective 40%, 30% and about 16% of the national market of conventions and exhibitions (Central Policy Unit, 2007).. In the scope of economic development, China has been unequally divided into. 治 政 different regions and economic zones. Thus, marketing 大 in such a huge country as 立 China has always been somewhat of a myth for foreign investors. According to an ‧ 國. 學. investigation into the marketing strategy of twenty-two foreign enterprises in China,. ‧. 44% of them considered China to be “one market”, 6% considered it as being “two. sit. y. Nat. markets”, 11% thought of it as having “three markets”, while 39% considered China. io. er. to have “more than 4 markets”. These winners and losers illustrate that foreign. al. companies cannot take full advantage of the enormous Chinese market by a single. n. iv n C strategy (Hsiao, 2007). Marketing, h which includes theUadvertising marketing in China, engchi should be considered as multiregional marketing instead of a simple marketing, since. the concept involves the success or failure of investors to establish an advertising business in China.. Furthermore, there is a similar development within different zones of the western region in the field of cultural industry. The Chinese Academy of Social Sciences issued China’s cultural industry development report in 2007, in which it points out that three areas have been designated for major cultural industries in China, namely the Yangtze River Delta, the Pearl River Delta, and the Bohai Economic Zone. These 19.
(29) areas share 66.08%, more than RMB 100 billion, of the cultural assets of Guangdong, Beijing, Shanghai, Zhejiang, Jiangsu and Shandong, 6 eastern provinces and cities, while 12 western provinces and autonomous regions share only 11%. 10 eastern provinces and cities share 4/5ths of the total national cultural industries’ annual operating income, while the western provinces and cities share less than 10%, which corresponds with the situation of economic development and the development of the media industry. In fact, a great many internal differences exist in the Chinese consumer market, including differences between urban and rural, coastal and inland, inter-city, racial, economic, cultural, language, local government implementation of. 治 政 different policies, inter-generational differences, differences 大 between rich and poor 立 and so on, all of which result in different consumption patterns. ‧ 國. 學 ‧. China is one of the biggest emerging markets, and its enormous population and rapid. sit. y. Nat. increase in consumer spending have attracted many multinational corporations. At the. io. er. same time, the misconception of China as a homogeneous market frequently leads to. al. difficulties in assessing market demands and enacting effective strategies. Consumers. n. iv n C significantly different from one heng chi U. from various regions are. another in terms of. purchasing power, attitudes, lifestyles, media use, and consumption patterns. According to the first National Economic Census in 2004, China was divided into three major regions, as follows: 1.. Eastern Region, which includes Beijing, Tianjin, Hebei, Liaoning, Shanghai, Jiangsu, Zhejiang, Fujian, Shandong, Guangdong, Hainan. 2.. Central Region, which includes Shanxi, Jilin , Heilongjiang, Anhui, Jiangxi, Henan, Hubei, Hunan. 3.. Western Region, which includes Inner Mongolia, Guangxi, Chongqing, Sichuan, Guizhou, Yunnan, Tibet, Shaanxi, Gansu, Qinghai, Ningxia and Xinjiang. 20.
(30) In 2005, the State Council Development Research Center proposed a program entitled “four regions eight economic zones”, which further divided the country into eastern, central, western, and north-east regions, with eight economic zones within those regions. Among those regions, more than half of the secondary and tertiary industries were located in the eastern region, accounting for 56.3%, while the central region accounted for 23.1%, and the western region accounted for 20.6%. One year earlier, industrial enterprises were the main business income, and the eastern, central and western regions accounted for 72.5%, 16.8% and 10.7%. This data shows that the three regional economies show large unbalanced development, with the turnover. Table 3-1: Development of Three Regions in China:2004. io. al. n. Business Income RMB Trillion. 72.5. R & D Budget. 76.4. 20.6. sit. 23.1. er. 56.3. Western Region. y. Nat. Secondary & Tertiary Industries (%). Central Region. ‧. Eastern Region. 學. ‧ 國. 治 政 being concentrated in the eastern region (Table 3-1). 大 立. Ch. 16.8. engchi 14.2. i Un. v. 10.7. 9.4. Source: Huang and Ma (2006). In 2003, Beijing, Guangdong, Shanghai, Jiangsu and Zhejiang, i.e. all of the cities and province located in the eastern region, comprised the list of the top 5 most developed advertising regions. Guangdong had the most advertising companies and employees, consisting of more than ten thousand advertising units with 93 thousand employees. Beijing obtained the number one turnover (RMB 205 billion), followed by 21.
(31) Guangdong and Shanghai (RMB 165 billion). Jiangsu and Zhejiang revenues were 50% less than Guangdong and Shanghai by 71 and RMB 68 billion (Table 3-2).. Table 3-2: Top 5 Advertising Developed Cities and Provinces in China:2003 Beijing. Guangdong Shanghai. Jiangsu. Zhejiang. Units. 9,736. 10,898. 4,151. 7,473. 5,670. Employees. 86,886. 92,956. 65,780. 65,780. 46,620. 2,053,988. 1,658,947. 1,606,269. 715,110. 680,086. Turnover (RMB 10,000 ). Source: Fang (2004). 立. 政 治 大. ‧ 國. 學. As recently as 2008, Beijing, Shanghai and Guangdong were still ranked the top three in terms of turnover of regional advertising. Beijing had the largest growth rate of. ‧. 14.16%, Shanghai’s turnover exceeded 30 billion and surpassed Guangdong, although. Nat. sit. y. Shanghai’s growth rate slowed down from 12.6% in 2006 to 4.82% in 2007. In the. n. al. er. io. Guangdong region, the impact of the financial crisis resulted in the first time negative. i Un. v. growth of the previous four years with a growth rate of -2.38%. In the other top. Ch. engchi. regions, Jiangsu achieved the highest growth rate in the eastern region with a rapid growth of 17.61 %. Noticeably, Tianjin, the top sixth region, with a respective growth rate of 17.1%, 19.3% and 13.85% in the previous three years, shortened its gap with Zhejiang with RMB 0.3 billion, and would probably replace the number 5 region, Zhejiang, within a year (China Investment Net, 2009).. 3.2 Straightened and Controlled by the Legal System On 15 November 1985, the Department of State implemented the “Notice of strengthening and management of advertising” which provided the official legislative. 22.
(32) straightening of the advertising market. Prior to 1985, Chinese officials had implemented two series of straightening the advertising market under the three principals of “limiting, guiding and managing” during May-November 1982 and October-November 1984, in order to clean up false advertising, and incorporate the advertising industry into the Socialist legal system. After the implementation of the “Notice of strengthening and management of advertising,” two more series of straightening were implemented in 1986 and between 1989 and 1990, which resolved the over-heated development of the advertising market. The latter two series of straightening revoked the licenses of hundreds of advertising business units, which. 治 政 did not comply with the regulations or had been involved 大 in serious irregularities, as 立 well as investigating and charging more than 3,300 cases of false advertising (Fang, ‧. ‧ 國. 學. 2004).. sit. y. Nat. China’s first advertising laws and regulations were issued by the State Council on. io. er. October 26, 1987, and the “Regulation on the Management of Advertisements” took. al. effect in December that year, which created a favorable external environment,. n. iv n C improved the obsolete advertising system, and obviated chaos and further obstacles to heng chi U advertising development. 9 In March 1993, a document issued by the State Council. listed advertising as one of the tertiary industries, and four months later, two ministries issued guidelines designed to boost the advertising sector. In 1995, a law governing advertising took effect. The introduction of such laws and regulations gave a big boost to the advertising sector, which had gained increasing attention and recognition from the government and the public with the establishment of the socialist market economy. In 1994, China’s advertising sales hit RMB 10 billion, and 9. The “Regulation on the Management of Advertisements” was adopted on deliberation at the executive meeting of the State Administration for Industry and Commerce in order to promote healthy industry standards and consider consumers’ interests. 23.
(33) companies started to bid for time slots and prime time at CCTV. The time slot spending reached RMB 30.79 million in 1995, the top bidder spent RMB 321 million on advertising in 1996, and the bidding war topped the bidding in 2005 with RMB 385 million. However, most of the domestic brands which paid top prices at CCTV eventually collapsed, which led to a decision by the State Administration of Taxation that any company should not spend more than 2% of its annual revenue on advertising due to lobbying by the China Advertising Association that the percentage was increased in 2001 up to 8% for some industries. 10. 治 政 3.3 Media Dominates the Market 大 立 Since the initial development of the advertising market in the 1980s, most advertising ‧ 國. 學. companies started their businesses by acting as agents of printing media with. ‧. inefficient and weak infrastructure. At the same time, both the advertising media and. sit. y. Nat. advertising agencies, including newspapers, TV, radio and magazines monopolized. io. al. er. the advertising market in China. Newspapers and TV particularly shared more than. n. half of the revenue in the market (Table 3-3), which characterized “weak companies, strong media” in China.. Ch. engchi. i Un. v. In 2004, after rapid development for two decades, China’s market ranked second in the world after the USA with 651 TV stations, which were heavily involved with the government before the 1980s, serving only CCP. In the early stage, during breaks in televised sporting events, Chinese audiences could typically only watch a blank screen or a shot of an ashtray or a cigarette, which signified that the audience should. 10. The China Advertising Association (CAA) was founded on December 27, 1983. It is a national institution directly under the State Administration for Industry and Commerce (SAIC) which is China’s advertising industry’s trade organization, registered by the Ministry of Civil Affairs of the non-profit industry organizations. 24.
(34) take a break.. Shanghai Television initiated the broadcast of the Nation’s first TV. commercial in 1979, which faced unprecedented resistance and controversy. Shanghai Television had to apply for approval from the government to broadcast the commercial, and even with government approval, the 90-second commercial for Shenguiyangrong ginseng liquor was almost cut half a minute before it was aired. In 1980, CCTV, the nation’s largest TV station, began its commercial broadcasting with advertisements for Coca-Cola and jeans. Wang Nansheng, former chief of advertising for CCTV, delivered an animadversion of Coke, not targeted at average people, and jeans were regarded as being part of a bourgeois lifestyle (Li, 2008). Ideologically,. 治 政 many people in that period believed that commercials 大had an unsavory link with 立 capitalism and there was no need to place advertisements. ‧ 國. 學. 1988 1989 1990 1991 1992. 25.35 20.35 19.15 19.74 27.47. y. a31.31 l C 32.48 h. n. 20.81 30.10 24.96 25.52. Newspaper (%). 36.37 30.31 31.97. TV (%) 6.94 9.30 11.36 13.63 15.22. engchi U. 33.60 30.49 27.07 -. 17.13 17.10 22.44 28.15 30.28. Others (%). Total (%). 11.34 9.91 9.05 8.44 8.33. 49.59 51.69 56.78 52.38 55.52. 8.99 10.26 6.92 -. 59.72 57.85 56.43 62.80 59.60. sit. io. 1983 1984 1985 1986 1987. Share of Media. er. Nat. Year. Advertise Companies (%). ‧. Table 3-3: Shares of Advertising Companies & Media during the Initial Period. v ni. Source: Fang (2004). On account of the habit of watching dynamic and colorful media and the number of illiterate Chinese increasing to 116 million (Washington Post, 2007), the advertisers retained their increased investment in TV commercials, instead of receiving a passive 25.
(35) acceptance of advertising, such as television, radio ads, etc. in China declined in 2008 (CTR, 2009). Another survey shows that Chinese people watch TV for 2.23 hours per day on average on normal weekdays, and 3.15 hours at weekends. Yet another result from the survey shows that 44.3% read newspapers every day and 29.7% read them at least 3 times a week (Search in a Research Inquiry, 2009). China’s advertising industry was forecast to rise 19% and exceed a turnover of RMB 200 billion in 2008, of which TV stations are expected to occupy a 36.4% share, which substantially leads newspapers (17.2 %), new media (15.1 %), outdoor advertising (14.0 %), magazines (8.4 %), radio (2.5 %) and direct mail (1.3 %).. 政 治 大. 立. ‧ 國. 36.4%. 19.1%. 13.5%. 12.1%. 8.8%. 14.0%. 15.1%. 8.4%. 17.2%. io. Source: Huang, Ding, and Shiao (2009). n. al. Ch. 3.1%. y. 2008. Magazine Radio. sit. 36.2%. Outdoor New Media Media. 2.5%. Direct Mail 1.6% 1.3%. er. 2007. News Paper. ‧. TV. Nat. Year. 學. Table 3-4: Distribution of Advertising Expenditure in Different Media: 2007-2008. engchi. i Un. v. 3.4 Limited Grouping of Newspaper. Since the 1980s, in accordance with the principles of entrepreneurial business, a series of major changes have taken place in the field of the media in China, particularly in terms of maintaining their survival and the pursuit of economic efficiency. In January 1996, the Guangzhou Daily Group was set up with the formal approval of the State Press and Publication Administration as the first newspaper group in China (Administration of Press and Publication of Guangdong Province, 2006). 11 Although. 11. The General Administration of Press and Publication (GAPP) is the government’s administrative agency responsible for drafting and enforcing China’s prior restraint regulations. 26.
(36) the newspapers in China are continuously merging into groups, the grouping of Chinese newspapers is still limited by the scope of the region and inter-industry. Firstly, China’s current grouping of newspapers has focused on media of the same nature due to policy restrictions, since the fragmentation of China’s administrative system is inseparable. For example, newspaper operators cannot be involved in radio or television. Secondly, according to China’s current public information policies, newspapers can operate in other industries, such as retail, tourism and real estate, but those industries are not allowed to operate in the media. Thirdly, the grouping of Chinese newspapers is still limited to the scope of the region, and any inter-territorial. 治 政 operation can be considered to be an invasion on 大 other newspaper marketing in 立 another place, which may face strict local protectionism (Zhang, 2007). Even though ‧ 國. 學. grouping has various restrictions, newspaper groups are consistently developing, and. ‧. compared with 2005 and 2007, China newspaper sales have steadily increased from. sit. y. Nat. 96.6 to 98.7 million copies daily (World Association of Newspapers, 2006). Official. io. al. er. statistics of China also show that, in 2000, China had 2,160 newspapers with an. n. annual circulation of 26 billion copies.. Ch. engchi. i Un. v. More than a decade before, in 1978, the “People’s Daily” and several other media organizations in Beijing jointly made a request to the Ministry of Finance for a trial of operating policies, “the management of enterprises and institutions”. On January 28, 1979, Shanghai’s “Liberation Daily” published the first commercial advertisement. In 1985, Henan’s “Luoyang Daily” was the first to embark on the path of the self-management issue, which initiated a new wave of newspaper reform in China. In the late 1980s, the rapid growth of the advertising market led to newspapers being eager to expand their number of pages to meet the growing demand from the advertising market. On Jan 1, 1987, the “Guangzhou Daily” was the first to be 27.
(37) extended to 8 pages from the original 4-page version. During the 1990s, real estate, commodities and trading advertising grew constantly, which provided the elements for developing new newspapers, and the local official newspapers of the CCP began to publish the Evening News and the Metropolis News. Eventually, the innovation of operating systems and the distribution of news editing systems contributed to the formation of China’s newspaper market (Chen, 2006).. As a result of the prosperous expectation of subsidiaries of official newspapers, the State Press and Publication Administration formally approved the formation of the. 治 政 “Guangzhou Daily” newspaper group in 1996. In 1998, 大 the Hong Kong Economic 立 Times newspaper group, the Guangming Daily Newspaper Group, the Nanfang Daily ‧ 國. 學. Press Group, the newspaper Yangcheng Evening News Group, and the Wenhui. ‧. Xinmin United Press Group were approved. At the same time, the restructuring of. sit. y. Nat. newspapers became the most important management of newspaper reform, and the. io. er. administrative implementation of the newspaper industry continued. By 2006, with. al. the exception of the Tibet Autonomous Region, every municipality and autonomous. n. iv n C region in China had formed newspaper which totaled 39 groups (Wu, 2006). h egroups, ngchi U. In 2005, the People’s Republic of China was the country with the largest number of 23 newspapers in the top 100 list of 215 countries and regions around the world by average circulation. The Cankao Xiaoxi (參考消息) issued by CCP retains its influence on the Nation with a circulation of 3.18 million, which accords the Cankao Xiaoxi the position of number one in China, and 7th in the world after five Japanese newspapers (Yomiuri, Asahi, Mainichi, Nihon and Chunichi News) and one German. 28.
(38) newspaper (Das Bild). 12 The People’s Daily with its 5 foreign languages (English, Japanese, French, Spanish and Arabic) ranked second in China with a circulation of 2.8 million (Table 3-5).. Table 3-5: Major Newspaper Groups in China by Circulation:2008 Rank. Newspaper Group. Release Location. Million Copies. Language (Online). 1. Cankao Xiaoxi. Beijing. 3.183. Chinese Chinese. People’s Daily. Beijing. 立. Yangtse Evening Post. 4. 政 治 大. Nanjing. 1.810. Guangzhou Daily. Guangzhou. 1.680. 5. Information Times. Guangzhou. 1.480. 6. Nanfang City News. Guangzhou. 1.400. Guangzhou. 1.170. Chinese. n. al. (Traditional Chinese). Chinese. y. Chinese Chinese. sit. ‧ 國. io. 8. News. Spanish, Arabic). ‧. Nat. Yangcheng Evening 7. French,. 學. 3. (English, Japanese,. 2.808. er. 2. i n C Wuhan Chutian Metro Daily 1.140 U hengchi (武漢). v. Chinese. Chinese. 9. New Express. Guanzhou. 1.132. Chinese. 10. Qilu Evening News. Jinan. 1.050. Chinese. 11. Global Times. Beijing. 1.042. Chinese. Shanghai. 0.998. Chinese. 0.995. Chinese. Xinmin. Evening. 12 News. Shijiazhuang 13. Yanzhao Metro Daily (石家莊). 12. The Cankao Xiaoxi (Reference News), issued by the Xinhua News Agency, and the People’s Daily “Global Times” are the only two newspapers which can publish foreign news in China. 29.
(39) Newspaper Group. Release Location. Qianjiang Evening. Hangzhou. News. (杭州). 15. Metro Express. Shanghai. 16. Today Evening News. 17. Peninsula City News. 18. Nanfang Daily. Guangzhou. Wuhan Evening. Wuhan. News. (武漢). 20. 立. ‧ 國. Modern Express. Nat. News. io. 0.910. Chinese. 0.900. Chinese. 0.850. Chinese. 0.850. Chinese. 政 治 0.830 大 (鄭州) Shenyang. al. 0.826. Beijing. 0.800. Nanjing. 0.790. Nanjing. 0.700. n. Source: Wikipedia (2008). Chinese. Chinese. Chinese. Chinese. ‧. News. Jinling Evening 24. 0.950. 學. 23. (瀋陽). (瀋陽). News. Beijing Evening 22. Shenyang. Chinese. Zhengzhou. Dahe Daily. Liaoshen Evening 21. (天津). 0.951. Chinese. y. 19. Tiangjin. Language (Online). Chinese. sit. 14. Million Copies. er. Rank. Ch. engchi. i Un. v. 3.5 Enormous Development of Private Advertising Enterprises China took action to relieve the Three Principles of managing the advertising market in 1992, and a survey showed that China’s advertising growth rate was, on average, 154.2 percent annually, which led the world from 1992 to 1994. In 1991, there were only two private advertising units in China, with 30 employees and a turnover of RMB 0.78 million. After only a decade, there were 3.38 thousand units, 338.9 thousand employees and 1.69 billion turnover. Compared with other professional advertising companies, private advertising companies gained half of the revenue in the advertising market, and the share of private, SOEs, collective and foreign invested 30.
(40) advertising companies has changed every three years since 1993. Private advertising companies increasingly shared the turnover of the market, which rose from 2.62% in 1993 to 42.86% in 2002. In 2004, the annual statistics showed that the revenue of private advertising companies had progressively occupied a 49.5% share of the market, followed by foreign invested enterprises with 20.94%, and SOE companies dropped further to 17.29% (Table 3-6).. Table 3-6: Comparison of Types of Advertising Companies:2004. al. 28. 49.57. 61.2. 9,606. 17.29. 232.3. 2,506. 4.51. 11,634. 20.94. n. Source: Wu (2005). Ch. (RMB 1,000). engchi. y. ‧ 國. 3,393 (41,348) 2,836 (32,112) 306 (5,502). io. Foreign. 56,517 (449,936). Nat. Collective. 政 治 大 Million) (%). ‧. SOEs. Turnover Per Capita. 學. Private. Share of Revenue. sit. 立. Revenue (RMB. er. Type. Companies (Employees). i Un. 78.1 2114.5. v. 3.6 Summary Although under a straightened control system, China’s advertising industry may still sustain a long-term prosperous development. During the past three decades of developing, the traditional media, especially TV and newspapers shared more than fifty percent of the market revenue and dominated the advertising market for a long period of time, only gradually losing their domination of the market to advertising enterprises. In addition, the continuous innovation of communication which has enhanced the fast growth of online businesses and encouraged the future development 31.
(41) of China’s advertising market has taken an unexpected turn, and the importance of new media will be further described in the next chapter.. Because of the unequal development in China, 43% of the total population of 1.3 billion is made up of urban residents living in major cities, and the media and advertising are synchronized to develop in a state of imbalance. Thus, localization of strategies with various characteristics is unavoidable for the further development of China’s advertising market, which may create opportunities for the prosperous development of small advertising agencies. Large-scale professional advertising. 治 政 companies must also adapt to the different regional 大 characteristics to provide more 立 intimate services for local advertisers. ‧. ‧ 國. 學. n. er. io. sit. y. Nat. al. Ch. engchi. 32. i Un. v.
(42) Chapter 4. Status of China's Advertising Market. China’s advertising spending is projected to grow between 5 to 8 percent in 2009, since the decline of last year’s 15 percent growth because of the economic downturn may possibly force companies to reduce their advertising budgets. Due to the government’s efforts to spur domestic consumption, business and services sectors are forecasting a reasonable growth in 2009 (CTR Media Research, 2009).. 政 治 大. As mentioned in chapter 3, China should be considered as being a multiregional. 立. market rather than a simple one, because of the result of an investigation into the. ‧ 國. 學. market strategy of twenty-two foreign enterprises in China. This demonstrated that 44% of them consider China as “one market”, while 6% thought it consisted of “two. ‧. markets”, 11% believed China to be “three markets” and 39% consider China to have. y. Nat. io. sit. “more than 4 markets”. Winners and losers have shown that foreign companies cannot. n. al. er. possibly take full advantage of the enormous Chinese market by a single strategy (Gardner, 1997).. Ch. engchi. i Un. v. In fact, there are a great many internal differences in the Chinese consumer market, which include differences between urban and rural, coastal and inland, inter-city, racial, economic, cultural, language, local government implementation of different policies, inter-generational differences, differences between rich and poor and so on, all of which result in different consumption patterns (China Strategy Net, 2007).. 4.1 Advertising Expenditure on Major Media In the early 2000s, the expenditure on major media in China was unequally developed, 33.
(43) and studies show that the traditional media, including TV and newspapers, were still dominating the advertising market in China. TV and newspapers’ total revenue was more than 70 billion in 2006, taking a long lead ahead of Radio (5.72 billion) and magazines (2.41 billion). Although magazines hit a historical growth rate of 60% in 2003, two digits of negative growth rate followed in 2004. Newspapers encountered an undulating situation, which rose by 28.9% in 2003, and dropped to -5% in 2004. In the field of major media in China, only TV and radio avoided this undulating situation by constantly growing (Table 4-1).. (%). Billion). Nat. 2000 14.66. (RMB. Rate (%). Revenue. Billion). 21.6. 8.2. 1.52. 7.5. 17.94. 6.2. 1.83. 2002 18.85. 19.8. 28.8. 2.19. 2003 24.30. 28.9. a23.10 l C h. 2004 23.07. -5.0. 29.15. 14.3. 2005 25.60. 11.0. 35.53. 2006 31.26. 22.1. 40.40. io. 16.89. n. 25.50. Rate. (RMB. 30.4. 2001 15.74. Growth. (%). Advertising Revenue (RMB Billion). Growth Rate (%). y. Billion). Rate. Advertising. ‧. (RMB. Revenue. Growth. 1.13. 2.7. sit. Year Revenue. Advertising. Growth. 20.4. 1.19. 5.3. 19.8. 1.52. 28.3. 16.8. 2.44. 60.3. 3.29. 28.7. 2.03. -16.7. 21.9. 3.89. 18.0. 2.48. 22.1. 13.7. 5.72. 47.2. 2.41. -3.1. er. Advertising. 學. ‧ 國. 治 政 Table 4-1: Advertising Expenditure of Major Media大 in China:2000-2006 立TV Newspaper Radio Magazine. i Un. e n10.4 g c h i2.56. v. Source: Chang (2007). In recent years, TV has developed even more rapidly, and according to another study on the expenditure on major media in China, the total expenditure on media advertising in China rose by 9% in 2007 and 15% in 2008, which consisted of TV. 34.
(44) (76%), newspaper (13%), radio (4%), and magazines (2%). TV continued to take a great leap forward from other media. The growth of spending on radio is slowing down, and spending on outdoor media is constantly declining, while the growth rate of the printed media reached a two-digit increase (Itamar Medeiros, 2009).. 4.1.1 CCTV Holds the Most Advantages in Market In terms of individual TV media, CCTV takes the lead in the national television advertising market. It not only holds the largest market share, but there has been an increased demand for CCTV camera deployment across different sectors, such as. 治 政 banking, retailing, education and transportation worldwide, 大 and due to this functional 立 diversification, its market revenue was US$6 Billion in 2008 (1888 Press Release, ‧ 國. 學. 2009). 13 In 2007, CCTV was listed as the number 1 for advertising revenue of all. ‧. media in China, followed by new media, Focus Media, SMG Shanghai and the. io. n. al. er. Table 4-2: Top Advertising Media by Revenue:2006-2007. Traditional TV 1. 3. Ch. New Media. engchi. Focus Media SMG. 4 5. i Un. Newspaper. CCTV. 2. sit. y. Nat. Shenzhen Daily (Table 4-2).. Shenzhen Daily Baidu. v. Revenue in 2006 (RMB Billion). Revenue in 2007 (RMB Billion). 9.20. 8.50. 1.60. 4.00. 3.35. 3.63. 2.89. 1.91. -. 1.53. Source: Huang, Ding and Shiao (2009). 13. China Central Television (CCTV) is the national TV station of the PRC with a multi-media broadcasting platform and business operation, movies, newspapers and the internet, which is the major news source of Chinese people. 35.
數據

+7
相關文件
As students have to sketch and compare graphs of various types of functions including trigonometric functions in Learning Objective 9.1 of the Compulsory Part, it is natural to
In response to the changing needs of society, the rapid development of science and technology, the views of stakeholders collected through various surveys and
Reading Task 6: Genre Structure and Language Features. • Now let’s look at how language features (e.g. sentence patterns) are connected to the structure
In response to the changing needs of society, the rapid development of technology, views of stakeholders collected through various engagement activities and events
To take the development of ITEd forward, it was recommended in the Second Information Technology in Education Strategy “Empowering Learning and Teaching with Information
Teachers may consider the school’s aims and conditions or even the language environment to select the most appropriate approach according to students’ need and ability; or develop
Currency risk is the risk that the fair value or future cash flows of a financial instrument will fluctuate due to changes in currency exchange rates. The Fund’s
Currency risk is the risk that the fair value or future cash flows of a financial instrument will fluctuate due to changes in currency exchange rates. The Fund’s
