iierarchical fuzzy-based support system for
inaesthesia monitoring and control
S. Shieh,
M.F.
Abbod, D.A. Linkens and J.E. PeacockAbstract: The paper describes research into a novel hierarchical architecture for fuzzy logic monitoring and control of intravenous anaesthesia with two main objectives. The primary task is to utilise auditory evoked response signals for augmenting cardiovascular and body function signs into a multisensor fuzzy model-based fusion strategy for anaesthesia monitoring and control. The secondary task is to extend an existing fuzzy patient model for use as a training simulator via computer-based models. This demonstrates a totally fuzzy-logic-based architecture for manipulat- ing complex procedures on a complex process (i.e. hospital patients).
otation EG ER LAER 4P R uli 4
i
OA PDOA DDOA FDOA SDOA DOL CDOA L 3 D IFLC IFM 31-
” Electroencephalogram Audio evoked response Mid latency AER Systolic arterial pressure Heart rateSweating Lacrimation Pupil response Depth of anaesthesia Primary level of DOA Dominant level of DOA First level of DOA Secondav level of DOA Depth of lightness Confidence in DOA Anaesthetic light Anaesthetic OK Anaesthetic deep
Self-organising fuzzy logic controller Self-organising fuzzy model Linguistic controller Target controlled infusion Infusion rate
Introduction
otivated by hierarchical structures in complex industrial stems and in management systems, theoretical investiga-
IEE, 1999
F Proceedingr online no. 19990125 >I: 10.1049/ip-cta: I9990125 per first received 2nd December 1998
,. Shieh is with t h e Center for Biomedical Engineering, National Taiwan iiversity, Taipei, Taiwan, Republic of China
nail: [email protected].
F. Abbod and D.A. Linkens are with the Department of Automatic nlrd and Systems Engineering, University of Sheffield, Mappin Street, effield SI3 3JD, UK
nail: [email protected]
:. Peacock is with the Department of Anaesthesia, Royal Hallamshire ,spital, Sheffield, UK
7 Proc.-Control Theory Appl., Vol 146, No. 3, May 1999
tions in establishing the decomposition and co-ordination approach for large-scale systems were explored by Mesaro- vic et al. [I]. The development of so-called hierarchical control has grown significantly in the past two decades in industries such as steel [2], petrochemistry [3] and electric power [4-61. Through multilevel methodologies, a large- scale control system’s complexity can be reduced by solving a family of subproblems which are of smaller dimensions and are more easily handled. Hierarchical control has been extended to large-scale control systems with multiple objectives [7-91. Furthermore, intelligent multiobjective optimal control has been successfully applied to control a train transportation process using hierarchical intelligent control combined with fuzzy logic
POI.
Within the current interest in intelligent systems engi- neering, one of the major paradigms being emphasised is that of fuzzy logic control. Although fuzzy theory was invented by Zadeh in 1965 [ I l l , and fuzzy control was demonstrated by Mamdani in 1974 [12], there occurred a delay of two decades before the commercial importance of this technique was to be demonstrated by Japanese products and latterly by German industry. Thus, now there are commercial and industrial fuzzy logic based products covering a vast range of high-volume, low-cost, low-technology consumer products through to high-tech- nology aerospace applications [13, 141.
Some of the main advantages of fuzzy control are that it is good for nonlinear systems, or where mathematical models are either unobtainable or too complex, or where there is large uncertainty about process (e.g. hospital patient) parameters. Obviously, the field of biomedicine ought to he a natural candidate for these situations. Surprisingly, therefore, the use of fuzzy control has been slow to mature in clinical engineering. While there are several uses of fuzzy logic for signal processing and interpretation in medicine, there are relatively few exam- ples of fuzzy control. In 1988, one of the authors published an early study on fuzzy control of muscle relaxation, via simulation [15]. More recently, this has been implemented in extensive clinical trials. Fuzzy control has been applied to blood pressure control on humans in the USA [16]. Recently, several researchers [17-19] have constructed closed-loop blood pressure control systems based on fuzzy logic during isoflurane or enflurane anaesthesia.
The results show the fuzzy controller to be able not only to imitate the anaesthetist’s management of the administration of the inhaled gas but also to give superior performance. However, an argument heard frequently against this prac- tice is that blood pressure depends on many factors such as blood volume and cardiovascular function, apart from anaesthetic depth.
Depth of anaesthesia (DOA) is a very challenging area for fuzzy control since direct measurements are uuavail- able. Thus, a hierarchical structure containing fuzzy reasoning at every level has been developed 1201. This provides self-organising fuzzy modelling (SOFM) at the first lcvel for inferential monitoring of anaesthetic depth utilising numerical clinical variables, such as systolic arterial pressure (SAP) and heart rate (HR). The sccond level is focused on non-numerical clinical signs, such as sweating (SW), lacrimation (LA) and pupil response (PR), which can be merged with the first level to decide DOA with more confidencc. At the next level, regulatory control is achieved for the anaesthesia maintenance phase via a self-organising fuzzy logic controller (SOFLC). Hence, the existing fuzzy logic based programme provides good control algorithms with self-learning capabilities, but only limited measurement inference which is based mostly on cardiovascular indicators (i.e. changes in SAP and HR). However, these changes are subject to modera- tion by drugs used in anaesthesia (e.g. opioids and anti- cholinergics), by the surgical situation (e.g. posture) or patients’ circumstances (e.g. fluid loss and blood loss), and hence they are unreliable in practice.
In the search for a more reliable monitor of DOA the electroencephalogram (EEG) is an obvious signal to investi- gate. The EEG, generated from within the central nervous system (CNS), is not affected by neuromuscular blockers, and the raw signal has been known for some time to show graded changes with increasing concentration of anaesthetic agents. Numerous drugs and signal processing techniqucs have been investigated to find a widely acceptable index of DOA. Thus, Buhrer et al. 1211 used fast Fourier transforms and a periodic time series analysis to study the effect of the drug midazolam on the central nervous system. They concluded that the EEG signal was best classified via the use of periodic time analysis parameters. Stanski [22] states that the changes in morphol- ogy due to anaesthetic agents are profound and also different for each class of drug. For thiopental, with an increasing concentration in the plasma, initially the frequency and amplitude of EEG rhythms increases. In stage 2 there is a decrease in frequency and increase in amplitude, while stage
3 produces burst suppression, followed by an isoelectric condition in stage 4.
Frequency-based features for classification have included spectral edge (frequency below which 95% of the EEG power exists) or the median frequency (50th percentage of EEG power). Hoffman and Edehnan 1231 showed that burst suppression, quantified via percentage times of electrical silence, is similar for inhalational agents isofluranc and desfluranc used in neurosurgery. The complexity of the EEG component rhythms has led people to investigate higher-order moments in the frequency analysis, in attempts to elicit information about interactions between the rhythms. Thus, Barnett et al. 1241 described the use of the bispectrum for distinguishing between awake and sleeping persons. More recently, the bispectral index has been developed into commercially available monitors of DOA. The inherent complexity of the signal generators in the brain responsible for the spontaneous EEG makc it difficult to propose a widely acceptable index of DOA.
266
Attention has turned therefore to evoked potentials (EP). EPs, which are changes in electrical potential evoked by auditory, somatosensory or visual stimuli, have two advau- tages over the EEG in the study of anaesthesia: EP is an indication of the responsiveness of the CNS, whereas the EEG reflects the resting level, and EPs have anatomical significance. The auditory evoked response (AER) has been tested with these criteria in iniiid 1251. Thus, having been validated as a measure of DOA the mid-latency auditory evoked response (MLAER) 1261, is being used in the clinical contcxt. The main features of MLAER, which reflect the anaesthetic depth, are thc changes in latencies and amplitudes of its waves due to drug step changes and surgical stimuli. Digital signal processing techniques have been carried out to smooth MLAER and improve the signal-to-noise ratio. Feature extraction has been impleinentcd to extract the factors describing the changes in amplitudes and latencies of MLAER waves which are related to DOA. Thus, three factors have been obtained and fused together using fuzzy logic to create a reliable index for DOA 1271.
The overall purpose of this paper is to consolidate and extend research into a novel hierarchical architecture for fuzzy logic monitoring and control of intravenous anaes- thesia, with two main objectives. The primary task is to utilise AER signals for augmenting cardiovascular and body function signs into a multisensor fuzzy model- based fusion strategy for anaesthesia inonitoring and control. The secondary task is to extend an existing fuzzy patient model for use as a training simulator via realistic computer..based models. This will then demon- strate a totally fuzzy logic based architecture for manip- ulating complex procedures on a complex process (i.e. hospital patients).
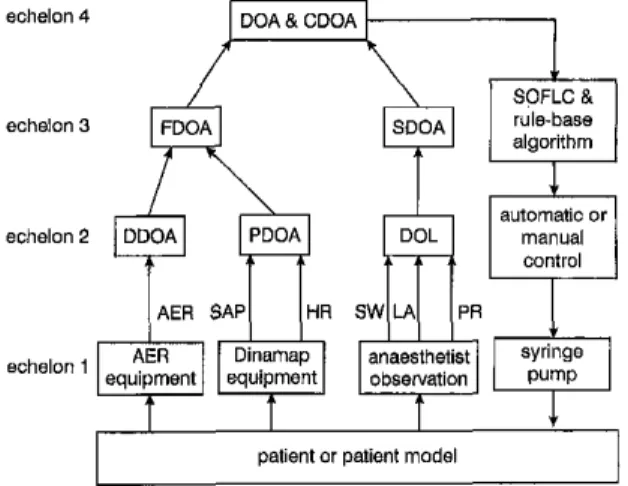
2 Hierarchical structure for monitoring DOA A hierarchical structure using cardiovascular indicators. AER signals and clinical signs to monitor DOA is shown in Fig. 1. The first level uses measured data which can bc input online to the system, such as SAP, HR and AER. The second level focuses on clinical signs which are non- numerical and difficult to apply online to the system via
patient or patient model
I
Fig. 1
For iiotatiun see beginning of p q m
Ilier~rchicd s ~ m c l u r e f i ~ monitoring DOA
)I computer. These clinical signs, such as SW, LA and PR, fieed to be input to the computer manually after observa- lion by the anaesthetist. After the data from the first and fecond levels have been fused, the DOA can be decided pore accurately.
1.
I First level of depth of anaesthesia fFDOAl from SAP, HR and AERkhe first level estimates the primary depth of anaesthesiol- />gy (PDOA) from online signals such as SAP and HR, as (:hewn in Fig. 1. SAP and HR are divided into three
ilifferent ranges i.e. high, medium and low. High means {he SAP and HR values of the patient are higher than pormal values (patient-specific) and vice versa for low. jlledium means the SAP and HR values of the patient are in (he normal range. There are also three states of anaesthesia i.e. anaesthetic light (AL), anaesthetic OK (AO) and
irnaesthetic deep (AD). At this level, the rules can come lrom anaesthetists’ experience, in which case we apply a i;imple fuzzy modelling system to derive the PDOA, or ]:hey may he derived from self learning via clinical trials, in byhich case we apply a self-organising learning system
1
Regarding the AER signals, it is considered that they Idate to unconsciousness more closely than cardiovascular indicators. Hence, the first-level estimates of DOA from /:dine AER signals are defined as the dominant depth of jinaesthesia (DDOA). The MLAER has been validated as a kneasure of DOA. Conventional averaging and autoregres- bive model (ARX) techniques are used to smooth the PLAER and improve the signal to noise ratio (SIN) [27]. Feature extraction is implemented to monitor the factors tlescrihing the changes in amplitudes and latencies of the jMLAER waves which are related to DOA. Three factors !lave been defined and fused together using fuzzy logic to Ireate an index for DOA. This index is a number which Fiescribes the value of DOA every 30 s, defined as DDOA iin this paper. However, at this level, the rules cannot be obtained from anaesthetists’ experience because they have !tittle experience in this monitoring mode. Hence, a self- brganising learning system derived from a SOFM algo- irithm has been used to learn the rule base from offline data ![28].i
Using the previous methods for measuring SAP and HR ‘to monitor PDOA and for measuring AER to monitor ~IIDOA, we fuse these two factors to decide the firsf level Jof depth of anaesthesia (FDOA). There are three states ofanae esthesia
for FDOA i.e. anaesthetic light (AL), anaes- :?hetic OK (AO) and anaesthetic deep (AD). From extensiveI .
itliscussion with anaesthetists, a rule base to decide FDOA !tias been elicited, as shown in Table 1.
j:20].
~‘rable 1: Anesthetists, rule base for FDOA
1-
II’DOA DDOA (AER)
SAP
& HR)~ AL A 0 AD
~ A L AL AL
~ A O AL A 0 AD
IAD
AD ADor
notation see beginning of paperI
!iEE Proc.-Conlml Theory Appl.. Vol. 146, MO. 3, May I999
2.2 Second level of depth of anaesthesia fSDOAI from SW, LA and PR
The second level to decide DOA is focused on measuring clinical signs (i.e. SW, LA and PR), for which there are no automatic methods of measurement as indicated in Fig. 1.
The best way is to use qualitative concepts to identify this information. A scoring system is often used in this field. Thus fuzzy logic applied to the Apgar scoring system bas been described by Shono ef al. [29] in Japan. Similarly, we use fuzzy logic to determine the DOA from the qualitative clinical signs. The details of determining the degree of
lightness (DOL) have been reported in Linkens et aZ. [20] and use a sum of scores obtained from SW, LA and PR indications. Basically, the SDOA is equal to DOL as shown in Table 2, while CDOA (confidence of DOA) is evaluated as (1-DOL).
2.3 Fusing FDOA and SDOA to decide DOA
Using the previous first level of measuring SAP, HR and AER to decide FDOA and the second level to decide SDOA, we fuse the first and second levels to decide DOA and provide a measure of conjidence of depth of anaesthesia (CDOA). The rules for fusing the first and second levels are as follows:
IF FDOA = AD THEN DOA =AD and CDOA = 100% IF FDOA = A 0 THEN DOA = A 0 and CDOA = 100% IF FDOA=AL THEN go to second level as shown in Table 2.
There are three states of DOA for anaesthetic light i.e.
small light (SL), medium light (ML) and very light (VL) from Table 2. It depends on the sum of scores of sweating, lacrimation and pupil response. The confidence in DOA in Table 2 can provide an assessment of the monitoring of DOA using clinical signs. Anaesthetists are particularly concerned about the patients becoming ‘light’ during an operation. From the point of view of controlling a drug the infusion rate of the administered drug will be kept increas- ing when the patient is in a light situation. Therefore if these additional clinical signs cannot actually be used to represent DOA for this condition, too much drug will be given. Hence, if the patient is in
a
very light situation, anaesthetists will lose their confidence in this method to monitor DOA. Because patients vary a great deal, anaes- thetists depend on their clinical experience to select moni- toring parameters to control a drug. However, something may still happen which anaesthetists had not anticipated before the operation. Therefore the CDOA in this methodTable 2: Monitoring and assessment of DOA by second level
No. Sum DOL (%) SDOA (“4) DOA CDOA (%)
1 0 16 16 SL 84 2 1 25 25 SL 75 3 2 25 25 SL 75 4 2 50 50 ML 50 5 3 50 50 ML 50 6 3 50 50 ML 50 7 4 50 50 ML 50 8 4 75 75 VL 25 9 5 75 75 VL 25 10 6 100 i o 0 VL 0
For notation see beginning of paper
gives an indicator which can warn and assist anaesthetists in the operating theatre for special cases.
3 Multiechelon system of fuzzy-based support system for anaesthesia monitoring and control
From the details given in the previous Section we propose a multistage hierarchical fuzzy control system with a multiechelon structure for anaesthesia as shown in Fig. 2. According to this hierarchical architecture there are four echelons which monitor, control, interpret and assess the whole surgical operation. Echelon 1 is a measurement and control action level which involves instrument sensors (Dinamap and AER equipment), anaesthetist observations (measurement of SW, LA and PR) and a syringe infusion pump (Graseby 3400 pump). Echelon 2 is an interpretation
level which involves interpreting SAP and HR to provide PDOA, interpreting AER signals to give DDOA and inter- preting SW, LA and PR to provide SDOA (i.e. DOL). Echelon 3 is a regulation level which involves controlling the drug from the anaesthetists' rule base (linguistic controller LC) or a SOFLC algorithm, and managing alarm situations. Finally, echelon 4 is an assessment level which assesses the whole surgical procedure according to DOA and confidence in DOA.
4 Simulator for hierarchical fuzzy-based support system for anaesthesia monitoring and control A fuzzy logic based simulator programme called SADA
(simulator advisor for depth of anaesthesia) has been programmed in "Modula-2" [30]. SADA has been devel- oped to simulate the administration of intravenous and analgesic drugs. It fuses online measurements (such as systolic arterial pressure SAP and heart rate HR) and non- numerical clinical signs (such as sweating, lacrimation and pupil response) using anaesthetists' experience or self- organising fuzzy logic control (SOFLC) algorithms to provide advice on administering drugs to a patient. This hierarchical control architecture includes five sectors: monitoring depth of anaesthesia, drug controller algorithm, deciding sensitivity of the patient, fentanyl supplementa- tion advice, and recovery time calculation. It has been
echelon 4 DOA & CDOA
echelon 3
'i
+
algorithm
I
-schelon,
^$
"",", ""*";"
fl
equipment equipment obsewation
patient or patient model
Fig. 2
For notation see beginning of paper 26R
Muliichelon syrmnfor. monitoring and conrrolling DOA
developed to predict drug profiles, control drug levels, and assess recovery time during anaesthesia. Also, a patient model bas been designed according to linguistic rules and fuzzy set theory for the simulator describing dynamic changes during the induction and maintenance stages.
Moreover, a self-orgartising learning algorithm using offline analysis of patients' AER signals has been created from ten clinical trials during maintenance of anaesthesia using propofol [28]. Hence, the patient model with respect to not only SAP and HR hut also AER has been merged into the system to simulate the whole procedure in the operating theatre. Therefore the computer screen of the sitnulator shows the fusing of SAP and HR to provide PDOA, interpreting AER signals to give DDOA, interpret- ing SW, LA and PR to provide SDOA, the fusing of PDOA and DDOA to provide FDOA, and the fusing of FDOA and SDOA to provide DOA and CDOA. Also, the controller based on SOFLC or LC is shown on the computer screen to determine the performance of the particular controller used by each simulation.
5 Closed-loop control simulation and results
The simulator has been used to simulate a major surgical procedure (abdominal operation), where the controller was based on either SOFLC or a linguistic controller (LC). In Fig. 3 the controller used a
SOFLC
algorithm which has a learning ability to adjust rules to suppress the surgical disturbances. Therefore when large disturbances (e.g. organ cutting) occurred to the patient, the SAP went high outside the acceptable band as shown in Fig. 3 so that the PDOA and DDOA went into the anaesthetic light range as shown in Figs. 4 and 5. The fusing of PDOA and DDOA to provide FDOA also indicated anaesthetic light as shown in Fig, 6. Further, the second level with SW, LA and PR went into the anaesthetic light range so that the SDOA (i.e. DOL) indicated small light degree as shown in Fig. 7 and confidence in the adequacy of control for the whole system was reduced from 100% to 75% as shown in Fig. 8. The DOA was assessed as small light as shown in Fig. 9 and therefore the propofol infusion rate IR increased as shown in Fig. 10 to reduce SAP and increase PDOA and DDOA5 0 k i n d u M i o ; , , , , maintenance
.
I 20 40 eo 80 100 120 0 0 timeFig. 3 Clo~eised-laup .sintulnt;on reruli, with paiieni model using SOFLC
algorithm f o ~ syr.iolic amrial presswe.
Anows indicate time of stating maintenance phase and disturbance occorrence. Abscissa: 35 per unit in induction period, I min per unit in rnainteilance and recovery period
500 100 90- 80 70
ae
3
5 0 - 40- AD .. . . . .. . . . .. . . . . . . - - - A 0 20 40 80 80 100 120 lime 450 r AD 100:Y
50 20 40 60 60 100 120 0 ' 0 lime5 Dominant-level DOA for Fig. 3 dfuation
AD
100
550 0 0 20 40 time 60 BO 100 120 L
6 First-level D 0 A f . r Fig. 3 siruation
c to the anaesthetic OK range. Hence, the SDOA rned to normal and confidence was increased to
?/a. Further, the DOA was returned to the anaesthetic range.
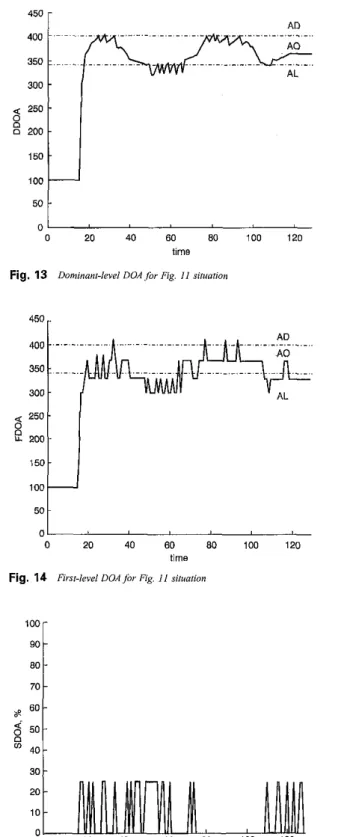
i Figs. 11-18 the controller used an LC controller #se rules came from anaesthetists' experience in clinical itice. The trend in Figs. 11-18 was quite similar to that 'igs. 3-10. However, the standard deviations of SAP DDOA as shown in Figs. 3 and 5 were 7.93 and 20.34,
'mroc.-Conirol Theory Appi., Vol. 146, No. 3, May 1999
30 20 10 0 0 20 40 60 80 100 120 lime Fig. 7 Secondary-level DOA for Fig, 3 situation
40 30 20 0 0 20 40 BO 80 100 120 lime Fig. 8 Coqfidence in D 0 A f . r Fig. 3 Siruation
20
401
0
1 ,
0 20 40 60 80 100 120
time
Fig. 9 Deplh of anaeslhesia fop Fig. 3 siiuaiion
respectively, compared to 13.90 and 24.37 in Figs. 11 and 13. This indicates that the drug administered by the SOFLC showed a smoother time profile to the disturbances compared with the LC. Also, the percentage of time showing no degree of lightness was 82.2% in Fig. 7 in comparison to 73.3% in Fig. 15 during the maintenance phase. Therefore the monitoring and control confidence
450 AD 100 90 80 70 ae G o -
$
5 0 - 4 0 - 30 n 0 20 40 BO 80 100 120 140 timel&si;.i.n ratefor Fig. 3 siiuaiion
Fig. '10
-
--
- - I E E 100 ". deep disturbance 20 0 0 20 40 60 80 100 I20 lime Fig. 11Arrow linguistic and abscissa as for Fig. 1
Closed-loop simulation re.wlt, witii pelieni model using controller
600 loo[ . . .
n
AD ...k
0 20 40 60 80 100 120 limeFig. 12 Primary-IsveIDOA for Fig. 11 .situation
achieved when using SOFLC was better than when using LC. Moreover, the total drug administered during the whole simulation from induction to recovery stage was 103 ml in Fig. 10 in comparison to 119 ml in Fig. 18 which shows that the SOFLC controller can also provide reduced drug consumption.
270
50 0 0
L
20 40 60 80 100 120time
Fig. 13 Dominant-level D O A f i r Fig. I 1 dtuarion
450
t
01
0 20 40 BO 80 100 120
time
Fig. 14 First-level D O A / b Fig. 11 situation
20 10 0 60 80 100 120 0 20 40 lime
Fig. 15 Secondary-level D M J b r RE. 11 situation
6 Conclusions
Depth of anaesthesia is hard to define and so cannot depend merely on one physiological signal. Blood pressure depends on many factors such as blood volume and cardiovascular function so that it is not directly coupled
100- 90 80 70 ap <' 50-
'
40- 30 20 10- --
- --
MLt
+
. . . 20 40! VL 0 ' - ' 0 20 40 BO 80 1W 120 timsig. 17 Depth of anaesthesiafor Fiz. 11 Situalion
0 20 40 60 80 100 120
time
g. 18 Iqfusim mitefor Fig. 11 situation
anaesthetic depth. Also, the body function signs, such as W, LA and PR, are too subjective and cannot be used for iline measurement to the system. The AER is considered be a better indicator of the DOA. However, AER signals quire a lot of signal processing and are easily contami- ded by noise, such as diathermy effects.
E Proc.-Controi Theory AppL, Vol. 146, No 3, May 1999
Hence, a hierarchical fuzzy-based support system for anaesthesia monitoring and control by using AER signals for augmenting both cardiovascular ( i s . SAP and HR) and body function (i.e. SW, LA and PR) signs has been developed and used to control major surgical operations. This method of fusing multiple clinical signs to determine the DOA is similar to anaesthetists' clinical practice. Also, it has been demonstrated successfiilly via simulation that administration of intravenous anaesthetic drugs via fusing these multiple signs as feedback signals compared to just one signal [ZX] produces better procedures. Regarding the type of controller used, the SOFLC algorithm which has a learning ability to adjust rules to suppress the surgical disturbances has demonstrated a smoother response to the disturbances, more confidence in the whole system perfor- mance and less drug consumption compared to the LC.
Following extensive simulation studies, the next phase involves the implementation of these techniques for advi- sory-based control of DOA in operation theatre for intra- venous anaesthesiology. The real-time measurement system is based on fuzzy logic, with the addition of fuzzy and multiresolution wavelets analysis signal proces- sing of the AER signal [31]. The measuring system includes a signal processing chip hosted in a PC because of the high-speed, complex algorithm requirements provid- ing averaging and analysis using multiresolution wavelets analysis. The analysed signal is fed to the neurofuzzy system where the inference takes place to obtain a measure of the DOA. Another measure for DOA is based on cardiovascular system status using a rule-based fuzzy logic classifier. The two measures are merged together using rule-based fuzzy logic data fusion to decide the final DOA. Based on the classified DOA, a target concen- tration is decided by a rule-based fuzzy logic controller which feeds the target to the increasingly-accepted anaes- thetic procedure based on target controlled infusion. The system formed a closed-loop controller for monitoring and controlling the DOA for patients undergoing surgical operations, and is currently undergoing clinical validation at the Royal Hallamshire Hospital, Sheffield. Initial results have been encouraging, evidencing good clinical proce- dures using the system. Considerable experience already exists for evaluating these types of system (albeit simpler) in operating theatre for both inhalational and intravenous anaesthesia [32].
The simulator program is being developed further for the purpose of training junior anaesthetists, particularly for handling critical incidents. Several linguistic and numeric patients models have been developed for this purpose and incorporated into a self-contained anaesthetic training simulator, which encapsulates the architecture described in this paper [33].
7 Acknowledgments
The project has been supported financially by EPSRC under grant number GRKOX345.
8 References
1 MESAROVIC, M. D., MACKO, D., and TAKAHARA, Y.: 'Theory of . . , , ,
. .
JL?, S . > and SARAF, D. N.: 'On-line optimization: a hierarchical scheme for distillation column control', Chem Eng. Process., 1992, 31,
( l a ~.,, nn rl. 117-147 .. . . . .
4 LIANG, C. C.: 'An overview of the hierarchical disputch and control system in Tnipower', IEEE Trans. 1990, PWRS-5, (4), pp. 1041-1046
5 RUBAAI, A,: 'Transient stability control - a multi-level hierarchical approach', IEEE Tians. 1991, PWRS-6, (l), pp. 262-268
6 NADIRA, R., DY LIACCO, T. E., and LOPARO, K. A,: 'A hierarchical interactive aooroach to electric nower svsteni restoration'. IEEE Trans. 1992,PWRS7,(3),pp. 1123-il31. '
7 HAIMES, Y . Y., TARVA!NEN, K., SHIMA, T., and THADATHIL, J.: Hierarchical multiobjective analysis of large-scale systems' (Hemi- sphere Publishing, New York, 1990)
8 LI, D., and HAIMES, Y. Y.: ‘Multilevel methodology far a class ofnoil- soparable optimization problems', Int. 1 Sy.ri. Sci., 1990, 21, ( I I), pp.
7157-7?hn
_ " _ _ .-..
9 LI, D.: 'Hierarchical control for large-scale systems with general multi- ple linear-quadratic stmctwe', Astomatica., 1993, 29, (6) pp. 1451-
, * * I
L - Y .
10 JIA, L. M., and ZHANG, X. D.: 'On fuzzy multiobjectivc optimal control', Eng. Appl. Aytlf Intell., 1993, 6 , (2). pp. 153-164
11 ZADEH. L. A.: 'Fuzzv sets'. h f control. 1965. 8. DO. 2 8 4 4 Holland Amsterdam, 1985).
14 HIROTA, K.. and SUGENO. M.: 'Industrial avolications of fuzzv technology in the world' in 'Advances in fuzzy &kerns: applicatiork
symposium 'Modelling and control ifl rne%cim', 1988, tenice, pp.
I P < - I W
."_
. _ _ .16 YING, H., SHEPPARD, L., and TUCKER, D.: 'Expert-system-based fuzzy control of arterial pressure by drug infusion', Med. Prog through
Technol. 1988, 13, pp. 203-215
17 MEIER, R., NIEUWLAND, J., ZBWDEN, A. M., and HACISALIH- ZADE, S. S . : 'Fuzzy logic control of blood pressure during anaesthesia',
IEEE C o n t d S y s t . Mag., 1992, 12, (12), 12-17
18 TSUTSUI. T.. and ARITA. S.: 'Fuzav-loeic control of blood vressurc
fizzy modelling for monitoring depth of anaesthesia, Fuzzy Setr Sysr.,
1006.79. nn 41-57 ... ., . ~, rr .. . ..
21 BUHRER, M., MAITRE,
p
O., CREVOISIER, C., and STANSKI, D. R.: 'EEG effects of benzodtazopines. I, Choosing an EEG panmeter tomeasure the effect of rnidazolam an the central nervous system' Clin.
--,.
23 HOFFMAN, W. E., and EDELMAN, G.: 'Cornmuison of isoflumne and
NUTE, C.: 'Bispecmm analysis of kEG siznals durinr &kina and
Scand. 1993, 37, (SlbO), pp. 105-168.
26 SCHWENDER, D., MADLER, C., KLASING, S., PETER, K., and POPPEL, E.: 'Do auditory cvoked potentials measure depth of anaes- thesiology ?', Them Surg., 1993, 8, pp. 29-31.
21 FLKFAFI, M., SHIEH, J. S., LINKENS, D. A., and PEACOCK, J. E.: lntelligent signal processing of evoked potentials for anaesthesia monitoring and control', IEE Pmc. Contml Theory Appl., 1997, 144, (41, pp. 354-360
28 ELKFAFI. M.. SHIEH. J. S. LINKENS. D. A.. and PEACOCK. 1. E,: 'FUZZY logic for auditory evoked response mdnitorinc and control of
Antonio, pp. 386-390,
31 LINKENS, D. A., ABBOD, M. E, and BACKORY, J. K.: 'Auditoty
F&y Syjlcrns, 8-1 1, Scp.1996, New Orleansi~USA
33 ABBOD, M. R , and LINKENS, D. A.: 'Anaesthesia simulators: intelli- gent monitoring and control of depth of anaesthesia'. Presented at the IEE colloquium on Siniulalion in Medicine, Dec., 1998, Savoy Place,
London.