行政院國家科學委員會補助專題研究計畫
成果報告
※※※※※※※※※※※※※※※※※※※※※※※※
※ ※
※ 低溫或高速超塑性細晶鋁材之微織構 ※
※ 與晶界演變分析 ※
※ ※
※※※※※※※※※※※※※※※※※※※※※※※※
計畫類別:▓個別型計畫 □整合型計畫
計畫編號:NSC 89-2216-E-110-041
執行期間:89 年 08 月 01 日至 90 年 07 月 31 日
計畫主持人:黃志青
本成果報告包括以下應繳交之附件:
□赴國外出差或研習心得報告一份
□赴大陸地區出差或研習心得報告一份
□出席國際學術會議心得報告及發表之論文各一份
□國際合作研究計畫國外研究報告書一份
執行單位: 國立中山大學材料科學研究所
中 華 民 國 90 年 10 月 1 日
行政院國家科學委員會專題研究計畫成果報告
Texture, Grain Boundary Sliding and Deformation Mechanism during
Low Temperature Superplasticity in 5083 Al-Mg Alloy
計畫編號:NSC 89-2216-E-110-041
執行期限:89 年 08 月 01 日至 90 年 07 月 31 日
主持人:黃志青 國立中山大學材料科學研究所
計畫參與人員:蕭一清、謝佩汝、林鉉凱 國立中山大學材料科學研究
所
1 . A b s t r a c tLow temperature superplasticity (LTSP) was observed in the 5083 Al-Mg base alloy after thermomechanical treatments (TMT). The maximum LTSP elongation was 511%, occurring at 230oC and 2x10⁻³ s-1. The texture and grain boundary sliding behavior at low temperatures were first examined and analyzed. Based on the above observations, the deformation mechanisms are discussed. It is concluded that the primary rate controlling deformation mechanism in the TMT processed specimens during the initial straining of the optimum LTSP condition was solute drag creep, followed by power law dislocation creep plus minor grain boundary sliding. Grain boundary sliding became dominating at large strains from ε>1.0.
K e y w o r d s : Low Temperature Superplasticity,
Texture, Grain Boundary Sliding, Aluminum Alloy, Deformation Mechanism.
2. Introduction
There have been numerous efforts in processing aluminum materials to exhibit high rate superplasticity (HRSP) and/or low temperature superplasticity (LTSP) by using thermomechanical treatments (TMT), equal channel angular extrusion, multiple forging, cyclic extrusion, torsion under compression, or accumulative roll-bonding on commercial or experimental alloys. Representative LTSP reports [1-9] are listed in Table 1.
Table 1 Summary of LTSP occurred in fine-grained Al and Mg alloys
_______________________________________________ Alloy Temp, oC
ε&
, s-1 Elong. Ref._______________________________________________ Al-10Mg-Mn 300 (0.61Tm) 1x10 -3 400% 1 Al-10Mg-Zr 300 (0.61Tm) 1x10 -3 1100% 2 Al-4Cu-Zr 220 (0.53Tm) 3x10 -4 250% 4 Al-8090 350 (0.67Tm) 8x10 -4 710% 3 Al-4Cu-Zr 250 (0.56Tm) 1x10 -4 850% 5 Al-3Mg-Sc 400 (0.72Tm) 3x10 -2 1020% 6 Al-5083 230 (0.54Tm) 2x10 -3 511% 7 Mg-AZ91 200 (0.51Tm) 6x10 -5 661% 8 Mg-ZK60/SiC 190 (0.50Tm) 1x10 -4 350% 9 _______________________________________________
In our pervious studies [7,10-13], a simple rolling-type TMT was applied to process the low-priced commercial 5083 alloy, resulting in low temperature superplasticity at around 230-270oC and 2x10⁻⁴-1x10⁻² s-1, with an optimum tensile elongation to 511%. The TMT processed thin sheet contained subgrains measuring around 0.5 µm. At temperatures lower than 270oC, the grains grew limitedly and maintained LTSP, with failure by cavitation coalescence plus partial necking. The flow stress of the LTSP specimens dropped to nearly one half as compared with the as-received non-LTSP samples, and the true strain rate sensitivity increased from 0.15 of the as -received specimens to around 0.3 of the LTSP ones. The grain-structure, texture and grain-orientation evolution as a function of strain, strain rate and temperature have been presented previously [10-13]. In this report, the possible controlling deformation mechanisms during superplastic tensile loading are characterized and discussed.
3. Experimental Methods
The 5083 alloy was obtained from CS Aluminum Corp., Taiwan, in the form of hot-rolled thick plates of 30 mm, with a composition of Al-4.7wt%Mg-0.7%Mn. The thick plates possessed elongated grains measuring 500x80x8 µm3 and did not exhibit any LTSP. Annealing treatment was performed at 500oC for 1 h, followed by air cooling, resulting in nearly equiaxed grained measuring ~25 µm. Tensile samples extracted from the thick plate under this condition is called the as-received and annealed (ARA) specimens. A series of low temperature (25-250oC) rolling type TMT was applied to the ARA plates to a final thickness of 0.5-3 mm. The rolling reduction ratio or the true strain received during TMT varied from 90% to 98% or from 2.3 to 4.1, respectively. Constant crosshead speed tensile tests were conducted, with the loading direction parallel to the rolling direction. The specimen gauge length was 8 mm.
4. Results
Figure 1 shows the variation of tensile elongation as a function of test temperature and strain rate for the ARA and TMT specimens. There are two maximum peaks, one of LTSP at ~230oC and the other of HTSP at
~550oC. Although the elongation values were similar at both temperatures (both ~500%), the controlling deformation mechanisms at these two temperatures might not be the same. The optimum strain rate was 1-2x10⁻³ s-1. At 1x10⁻² s-1, the tensile elongation dropped to ~200%.
At low temperatures over 200-300oC, the ultimate tensile stresses of the TMT specimens were lower than those of the ARA ones by 50-80 MPa. For example, the maximum stress dropped from 146 MPa of the ARA materials at 250oC and 1x10⁻³ s-1 to 77 MPa of the TMT processed ones, suggesting the stress reduction effect in the fine-grained thin sheets originated from the activation of grain boundary sliding (GBS) at low temperatures. This also implies that the controlling deformation mechanism in the ARA and TMT specimens should be different.
(a) (b)
Fig. 1 Dependence of LTSP elongation as a function of test (a) temperature, and (b) strain rate.
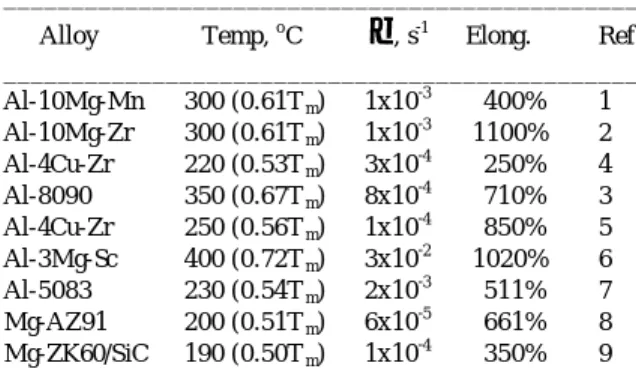
The contribution of grain boundary sliding to overall straining has been evaluated by examining the surface marking offset, as shown an example in Fig. 2. It was found that the contribution of GBS at 250oC and 1x10⁻³ s-1 was 27% at ε~0.4, and increased to 62% at ε~1.2. In other words, GBS was not prevailingly proceed during the initial stage of LTSP straining, but gradually increased its role at later stages. Due to the operature of GBS during LTSP, the strong texture observed in the thermomechanically processed alloys was rapidly diminished at later stage, as seen in the week texture in the LTSP specimen after 216% elongation in Fig. 3.
Fig. 2 (a) Example of the line offsets observed from the surface marker lines scribed on the LTSP specimens loaded at 250oC and 1x10⁻³ s-1.
5. Analysis of Deformation Mechanism
For fine-grained Al-Mg alloys deformed at elevated
temperatures, three possible mechanisms should be considered. Firstly, the typical superplastic deformation controlled by grain boundary sliding would exhibit an m-value of around 0.5 (n=1/m=2), and had a strong grain size dependency [14], i.e.,
2 th p eff E d b D kT Eb A σ−σ = ε& , (1)
where A is a coefficient related to grain boundary structure, k the Boltzmann’s constant, Deff the effective diffusivity, including lattice diffusion diffusivity (Dl), grain boundary diffusivity (Dgb), and dislocation core diffusivity (Dc), d the grain size, p the grain size exponent closed to 2-3, σth the threshold stress. The second acting mechanism might be the power law dislocation creep with an average m-value of around 0.2 and no grain size dependence [15], i.e.,
5 th eff E D kT Eb B σ−σ = ε& , (2)
where B is another coefficient related to dislocation creep. Thirdly, the solute drag creep for aluminum alloys with a sufficient amount of Mg should be active. The controlling rate equation [16] is
3 s E D E kT C σ = ε& , (3)
where Ds is the diffusivity of the solute in the Al matrix. From the tensile test data of TMT specimens, it would exhibit superplasticity in the temperature ranges of 230-250oC and above 400oC. At the temperature between 270oC and 400oC, tensile elongation was decreased obviously. In the TEM observation, the microstructure of TMT specimen was stable at the temperature below 250oC. Even it was subjected to static annealing or tensile loading at 250oC, it maintained a stable grain size less than 3 µm. But when the test temperatures were higher than 270oC, because the occurring of partial recrystallization, it exhibited a inhomogeneous microstructure.
(a) (b)
Fig. 3 (a) EBSD (100) pole figure and (b) inverse pole figure for the LTSP 5083 specimens after loaded to 216% tensile elongation, showing near random orientation distribution with a maximum coutour level around 3-5.
A. Apparent strain rate sensitivity (ma)
The maximum tensile stress typically occurred at
ε=0.4. It was apparent that once the subgrains formed during TMT transformed successfully into high angle
0 200 400 600 200 300 400 500 600 1x10⁻³ s-1 2x10⁻³ s-1 Tensile elongation, % Tensile temperature, o C 0 200 400 600 10-5 10-4 10-3 10-2 10-1 230 o C 250 o C Tensile elongation, %
boundaries during the critical initial straining, the material could further deform smoothly to large strains. In this study, the true tensile stress was first selected at ε=0.4 to determine ma, as shown in Fig. 4a for 200, 230, and 250oC. The average ma-value over this temperature range was ~0.23.
B. Apparent activation energy (Qa)
The activation energy Qa-values were extracted from either ln under a constant stress condition or ε&
σ
ln under a constant strain rate condit ion. The slope or the apparent activation energy of ln data against ε& 1000/RT under constant stress of 200 MPa was around 118.0 kJ/mole. On the other hand, Qa was also calculated under constant stra in rate of 1x10⁻³ s-1 to be 121.2 kJ/mole (Fig. 4b). The average apparent activation energy calculated by these two methods was around 120 kJ/mole. Due to the presence of an appreciable threshold stress at low temperatures, it is necessary to consider the threshold stress and temperature dependence of elastic modulus.
C. Threshold stress (σth) and true strain rate sensitivity (mt)
The value of σth was determined by using a linear extrapolation on a double-linear plot of
ε&
1/n against σ for selected values of n at each temperature. The fitted straight line intersects the stress axis at zero strain rate and gives the value of σth.In the temperature range of 200-250oC, the σth determination was carried out by extrapolation on the plots ofε&
1/n against flow stress by selecting n=3, 3.5, and 4 respectively. Excluding the stress data of 200oC at 5x10⁻³ and 1x10⁻² s-1 since they seemed to lie outside the power law region. The most probable true stress exponent nt seemed to be 3.5 (mt~0.29) because this value corresponds to a higher correlation coefficient, as shown in Fig. 4c. It is a value between power law dislocation creep and solute drag creep. The extracted σth values of 200 to 250oC were 67.92, 23.58, and 16.98 MPa respectively. Park and Mohamed [17] proposed the relationship between the apparent stress exponent (na), applied stress (σ), and effective stress (σ-σth) to be th t a n n σ − σ σ = . (4)The true stress was 135.08 MPa at 230oC and 1x10⁻³ s-1, and the effective stress was 111.5 MPa, so the value of
σ/(σ-σth) was around 1.2. The value of na/nt was also around 1.2. Thus, the estimated value of true stress exponent was reasonable.
D. True activation energy (Qt)
Including σth, the true activation energy can be evaluated. Taking (σ-σth)=200 MPa, the slop of the double linear plot of
ln
ε&
against 1000/RT was ~70.0 kJ/mole. On the other hand, taking mt~0.29 andε&
=1x10⁻³ s-1, the estimated activation energy underconstant strain rate was ~72.5 kJ/mole, as shown in Fig. 4d.
(a) (b)
(c) (d)
Fig. 4 Determination of (a) ma from flow stress vs. strain rate, (b) Qa from lnσ vs. 1/RT, (c) σth from ε&1/3.5 vs. stress, and (d) Qt from ln(σ-σth) vs. 1/RT.
Considering the temperature dependence of elastic modulus, selecting the constant normalized stress condition of (σ-σth)/E=1.5x10-3, the slop or Qt was around 65.6 kJ/mole. Also, the Qt determined under constant strain rate condition of 1x10⁻³ s-1 was around 66.0 kJ/mole.
Both of these two values of Qt were lower than Mg diffusion in Al matrix (136 kJ/mole) and self-diffusion in pure Al (142 kJ/mole), but close to grain boundary diffusion in Al (84 kJ/mole) and dislocation pipe diffusion in Al (82 kJ/mole). Although the activation energy of grain boundary diffusion of Mg atom in Al was not recorded so far, it was thought to be close to or lower than grain boundary diffusion for Al. Also, the activation energy of dislocation pipe diffusion of Mg atom in Al was close to or lower than pipe diffusion for Al. On the basis of the estimated true activation energy in the temperature range of 200-250oC, the rate-controlling diffusion step might be grain boundary diffusion or dislocation pipe diffusion for Al. It might also be dislocation pipe diffusion or grain boundary diffusion of Mg atom in Al matrix. E. Grain size exponent (p) at ε=0.4
On the basis of Eqns. (1), (2) and (3), if grain boundary sliding was dominant, the p-value would be 2 for lattice diffusion and dislocation pipe diffusion during the rate-controlling step or 3 for grain boundary diffusion. If the power law dislocation creep or solute drag creep was dominant, the p-value would be zero. To examine the relationship between grain size and flow stress, Eqn. (1) can be rewritten as
− σ ′ = ε RT Q exp E d b B n p & , (5) 10 100 1000 10-5 10-4 10-3 10-2 200 oC 230 o C 250 o C
Flow stress, MPa
Strain rate, s-1 4.6 4.8 5 5.2 5.4 0.22 0.23 0.24 0.25 0.26 LTSP ln( σ) 1000/RT, mole/J 0 0.1 0.2 0.3 0.4 0 70 140 210 280 350 200 o C 230 o C 250 o C (Strain rate) 1/3.5 , s -1/3.5
Flow stress, MPa
4.4 4.6 4.8 5 5.2 0.22 0.23 0.24 0.25 0.26 LTSP ln( σ−σ th ) 1000/RT, mole/J
where B’ is a coefficient, p grain size exponent, and d grain size. At constant temperature, Eqn. (4) can be written as σ + + ′ = ε E ln n d b ln p C ln ln & , (6)
where C’ is a coefficient. To determine p, it could be done by (a) finding the relationship between σ and d under constant strain rate condition; or (b) determining the dependence between
ε&
and d at any given value ofσ. In this study, the varying grain sizes in specimens statically annealed at 250oC for 0-60 min were measured. The same group of specimens was subjected to tensile loading at 250oC and 1x10⁻³ s-1. Thus, the first method was used to determine the p-value. The double linear plot of ln(σ/E)n against ln(1/d) for ε=0.4 is presented in Fig. 5a. The slope of this plot or the p-value is around zero, suggesting that in the initial straining stage at
ε=0.4, there was no dependence between the strain rate and grain size.
(a) (b)
Fig. 5 p-values at (a) ε=0.4, and (b) ε=1.0.
On the basis of determination and discussion above, we found that mt is ~0.29, p is ~0, and Qt is ~70 kJ/mole at ε=0.4 and T=200-250oC. The most important deformation mechanism during initial straining at ε=0.4 seems to be solute drag creep. However, power law dislocation creep could also be acting, and grain boundary sliding might play a less significant role during the initial straining stage. Because the solute drag creep was the most important mechanism, so the rate-controlling diffusion step might be dislocation pipe diffusion of Mg in the Al matrix.
F. Grain size exponent (p) at ε=1.0
When the specimen was strained further to later stages, the extracted p-value was seen to gradually increase. P was calculated to be ~1.1 at ε=1.0 as shown in Fig. 5b. It suggests that grain boundary sliding has gradually taken over the controlling deformation role when the specimen was pulled to larger strains. The ma and mt could not be determined precisely at large strains due to varying extents of necking in various specimens under different testing conditions. However, based on the results of TEM and EBSD observations [13], i.e., a high fraction of high angle grain boundaries and a pronounced reduction of texture intensity, grain boundary sliding did appear to more and more important with increasing tensile strain, especially at later stages of straining.
G. Deformation mechanisms of 230-250oC
By closer examination, the stress data at 200oC seemed to be slightly different from those at 230 and 250oC. The tensile elongation at 200oC was typically less than 200%. So it might not be appropriate to determine mt or Qt over the temperature range of 200-250oC. In this section, determinations of strain rate sensitivity and activation energy are carried out for the mechanical data at 230 and 250oC only.
As shown in Fig. 4a, both ma-value of 230 and 250oC were close to 0.24. Taking σ=200 MPa, the estimated slope or Qa was around 119.5 kJ/mole. On the other hand, under the constant strain rate, selecting
ε&
=1x10⁻³ s-1, the Qa was around 117.3 kJ/mole.In the same way as discussed in Sec. 4C, the mt-value in the temperature range of 230-250oC was also around 0.29, and the threshold stress of both temperatures were 23.58 and 16.98 MPa. The estimated semi-activation energy under constant effective stress or strain rate was 89.5 or 92.9 kJ/mole. Considering the temperature dependence of elastic modulus, the estimated true activation energy under constant (σ-σth)/E or strain rate was 84.7 or 88.2 kJ/mole.
According to the determination results above, the true activation energy was close to 86 kJ/mole, which was then very close to dislocation pipe diffusion of Mg atom in Al or pipe diffusion for Al (80-84 kJ/mole). Thus, during the initial straining at 230-250oC, the most dominant deformation mechanism would be solute drag creep, and the rate-controlling diffusion step should be dislocation pipe diffusion of Mg atom in Al. Finally, the overall comparisons of deformation mechanisms and rate-controlling diffusion steps during LTSP straining are presented in Table 2.
Table 2 Comparison of the parameters extracted for LTSP deformation in the 5083 alloy
___________________________________________ T, oC 200-250 230-250 200-250 ε 0.4 0.4 1.0 ma ~0.23 0.24 ~0.3 Qa, kJ/mole 120 118 -- σth, MPa 68, 24, 17 -- -- mt ~0.29 ~0.29 -- Qt, kJ/mole 66 86 -- p ~0 ~0 ~1.1 Mechanism 1. Solute drag 1. Solute drag 1. GBS
2. Power law 2. Power law 2. Solute drag 3. GBS 3. GBS 3. Power law Diffusion Pipe diffusion Pipe diffusion GB diff. ___________________________________________
6. Summary
(1) Under the optimum LTSP condition, the true m-value was ~0.29, compared with 0.15 for the ARA coarse-grained 5083 alloy at 250oC.
(2) The activation energy Q-value was around 86 kJ/mole for LTSP at 230-250oC. The major rate controlling deformation mechanism in the LTSP 5083 specimens during the initial straining was solute drag
-23 -22 -21 -20 -19 -18 -0.8 -0.4 0 0.4 0.8 250 o C ln( σ/Ε ) n ln(1/d) -25 -24.5 -24 -23.5 -23 -0.5 0 0.5 250oC ln( σ/ Ε) n ln(1/d)
creep, plus minor contribution from power law dislocation creep and grain boundary sliding. With increasing LTSP straining, grain boundary sliding gradually played a more dominant role.
7. References
1. T. R. McNelley, E. -W. Lee, and M. E. Mills, Metall. Trans. A, 17A, 1035 (1986).
2. T. R. McNelley, R. Crooks, P. N. Kalu, and S. A. Rogers, Mater. Sci. Eng., A106, 135 (1993). 3. R. Z. Valiev, A. V. Korznikov, and R. R. Mulyukov,
Mater. Sci. Eng., A168, 141 (1993).
4. H. P. Pu, F. C. Liu, and J. C. Huang, Metall. Mater. Trans., 26A, 1153 (1995).
5. R. Z. Valiev, Mater. Sci. Forum, 243-245, 207 (1997).
6. S. Komura, P. B. Berbon, M. Furukawa, Z. Horita, M. Nemoto, T. G. Langdon, Scripta Mater., 38, 1851 (1998).
7. I. C. Hsiao and J. C. Huang, Mater. Sci. Forum, 304-304, 639 (1999).
8. M. Mabuchi, H. Iwasaki, K. Yanase, and K. Higashi, Scripta Mater., 36, 681 (1997).
9. T. Mukai, T. G. Nieh, and K. Higashi, Thermece’97, ed. T. Chandra and T, Sakai, TMS, Warrendale, PA, 1847 (1997).
10. I. C. Hsiao and J. C. Huang, Scripta Mater., 40, 697 (1999).
11. I. C. Hsiao, J. C. Huang, and S. W. Su, Mater. Trans. JIM, 40, 744 (1999).
12. S. W. Su, I. C. Hsiao, J. C. Huang, Key Eng. Mater., 177, 613 (2000).
13. I. C. Hsiao, S. W. Su, J. C. Huang, Metall. Mater. Trans., 31A, 2169 (2000).
14. O. D. Sherby and J. Wadsworth, in Deformation, Processing and Structure, ed. G. Krauss, ASM, Metal Park, Ohio, 355 (1984).
15. A. Ball and M. M. Hutchinson, Met. Sci. J., 3, 1 (1969).
16. J. Weertman, J. Appl. Phys., 28, 1185 (1957). 17. K. -T. Park and F. A. Mohamed, Metall. Mater.