Submitted on 06/Feb./2013
Article ID: 1923-7529-2013-03-34-14 Tung-Hao Lee, and Jiun-Kai Huang
~ 34 ~
Financial Liberalization, Foreign Ownership and Corporate
Operational Efficiency: The Case of Taiwan Market
Tung-Hao Lee
Department of Money and Banking, National Chengchi University, No. 64, Sec. 2, Zhi-Nan Rd., Wenshan District, Taipei 11605, Taiwan
Tel: +886-2-2939-3091 E-mail: [email protected]
Jiun-Kai Huang (Correspondence Author)
Department of Money and Banking, National Chengchi University, No. 64, Sec. 2, Zhi-Nan Rd., Wenshan District, Taipei 11605, Taiwan
Tel: +886-930-042-297 E-mail: [email protected]
A
bstract: Using a non-parametric data envelopment analysis (DEA) method, this paperinvestigates the investment allocation choices of foreign investors and how the foreign ownership and corporate operational efficiency play roles in Taiwan market with more financial liberalization. Empirical results suggest a possible channel. Through this channel, a high level of foreign ownership significantly positively affects corporate operational efficiency, and then higher operational efficiency triggers better performance. With more liberalization, some foreign investors are not only speculators, but also they play the role of monitoring or disciplinary. They improve corporate operational efficiency and performance, and thus in turn their investment profits, especially high-tech and exporting companies. These two roles are not mutually exclusive. The case of Taiwan market may have established a paradigm for developing countries to follow.
JEL Classifications: G38, L25, O16
Keywords: Financial liberalization, Foreign portfolio, Operating efficiency, DEA, QFII
1. Introduction
Since the opening of emerging stock markets to foreign investors, there have been a lot of debates about the role of foreign ownership. For example, several studies suggest that stock market liberalization tends to enhance informational efficiency of stock prices and global integration, or mitigate stock return volatility (Bae et al., 2012; Kim and Signal, 2000; Li et al., 2011; Poshakwale and Thapa, 2010); improve corporate profitability or investment and economic growth (Bekaert et al., 2005 and 2011; Mitton, 2006); accrue to transparent or well-governed companies and reduce the cost of equity capital (Aggarwal et al., 2011; Bae and Goyal, 2010; O’Connor, 2012) in developing countries.
To attract foreign capital or adjust the structure of stock markets, several emerging countries have adopted progressive strategies to open up their securities markets, mainly through the qualified foreign institutional investors (hereafter, QFII) scheme. In 2003, Taiwanese government abolished the system of QFII. Over the last decade, the listed companies in the Taiwan stock exchange (hereafter, TWSE) witnessed tremendous changes of foreign shareholders in response to deregulation and globalization of financial economic activity. Taiwan is a mature emerging economy. Data from the World Federation of Exchanges indicate that the TWSE at the end of 2010
~ 35 ~
was ranked 21st globally by domestic market capitalization, with a capitalization of US$818 billion. Additionally, the value of share trading was ranked 14th globally. Figure 1 indicates the different patterns of the proportion of foreign ownership after more open financial market. During the early period from 2003 to 2006, foreign portfolio investments have been fast-growing from 16.65% to 34%. On the other hand, after 2007 (late period), foreign ownership maintains high holdings (above 30%). It is worth noting that data on purchases and sales of foreign investors are publicly released in Taiwan. Meanwhile foreign shareholders are becoming more influential in corporate operating management or performance.
Figure 1. Proportion of foreign ownership in Taiwan stock market
Equity market liberalization is one important issue. What (or how) role does foreign ownership play? Not only policymakers but also managers of listed companies need to understand whether to push for the lifting of restrictions on foreign portfolio investments in their stocks or whether a more open stock market to foreign investors could help listed companies to raise their operating efficiency. Unfortunately, few studies so far have attempted to account for the relationship between foreign ownership and corporate operational efficiency. This study tries to propose another benefit of stock market liberalization how foreign investors impact corporate operational efficiency and performance, using quarterly data set of 476 listed companies on the TWSE over the period 2003-2010.
This study highlights the importance of recognizing the industries and heterogeneity effects, such as computer and electronics industries versus non-computer and electronics industries (hereafter, high-tech versus non-high-tech companies), and exporting companies versus non-exporting companies. Using a non-parametric data envelopment analysis (DEA) method, this study estimates the relative corporate operational efficiency value in each quarter under conditions
Jan-2003 16.65 DEC-2006 33.99 Dec-2010 32.86 14 16 18 20 22 24 26 28 30 32 34 36 Ja n-2003 Jun-2003 Nov-2003 Apr -2004 S ep -2004 Feb -2005 Jul-2005 D ec -2005 May -2006 Oc t-2006 Mar-2007 A ug -2007 Jan-2008 Jun-2008 N ov -2008 A pr-2009 S ep -2009 Feb -2010 Jul-2010 D ec -2010
~ 36 ~
of variable returns to scale. Thus, this article investigates the investment allocation choices of foreign investors, and how the roles of foreign portfolio investments and corporate operational efficiency, or what drive foreign shareholders to listed companies after more open financial market in Taiwan.
This article conjectures that foreign institutional investors (or QFII) affect corporate operational efficiency because monitoring effectiveness and disciplinary roles may resolve some agency problems between investors and managers, such as X-inefficiency, excessive managerial perquisites, or empire building and so on. Compared to individual investors, foreign shareholders have better technological, knowledge, and quality of research. In order to safeguard or increase their portfolio investments or wealth, they play a monitoring or disciplinary role, and affect corporate management and investment decision making (e.g., Aggarwal et al., 2011; Choi et al., 2012; Douma et al., 2006; Ferreira and Matos, 2008; Huang and Shiu, 2009).
This research belongs to the literature bridging the gap between foreign portfolio investments and corporate performance. In accordance with the changing behavior of foreign ownership, listed companies in emerging markets can no longer ignore the voice of foreign investors. To empirically validate the framework, this study finds that high level of foreign ownership could convey a signal regarding the quality of corporate operational efficiency because they could discern the quality of management or impose disciplinary mechanisms on managers (Douma et al., 2006; Lee and Park, 2009; Parrino et al., 2003). In addition, better corporate operational efficiency within a company is more likely to trigger high performance. These findings suggest a possible channel through which high foreign portfolio investments significantly positively affect corporate operational efficiency, and then better operational efficiency triggers high performance. This evidence might explain, at least in part, the somewhat empirical findings evidence regarding the association between foreign shareholders and subsequent high corporate performance (Bae et al., 2011; Ferreira and Matos, 2008; Huang and Shiu, 2009; Hung and Tseng, 2009).
Moreover, this study highlights the importance of recognizing the heterogeneity effects. Different types of companies have disparate effect on corporate performance. The results support that the influences of high-tech and exporting companies are greater than those of non-high-tech and non-exporting companies because foreign ownership can monitor these companies more easily. Consistent with the idea of Chen et al. (2007), when monitoring benefits exceed costs, foreign shareholders has the potential ability and incentive to control or influence managers’ operating decisions. Interestingly, after more liberalization, some foreign investors are not limited to just speculators, pursuing abnormal profits (Barber et al., 2009; Puckett and Yan, 2011). They also play monitoring or disciplinary roles, and improve corporate operational efficiency and performance, and thus in turn their investment profits, especially high-tech and exporting companies. These two roles are not mutually exclusive. These results therefore not only add to existing evidence on the impact of foreign portfolio investments but also highlight the importance of recognizing the heterogeneity groups. Given the mature Taiwan’s capital market, it is important to explicitly examine whether and how foreign ownership affects corporate performance. These findings can be applied to other emerging markets.
The remainder of this paper is organized as follows. The next section reviews the related literature. Second 3 briefly describes our research design: data, methodology and variables. Section 4 shows empirical findings. The final section presents conclusions.
~ 37 ~
2. Literature Review
Institutional investors are more concerned about their holding securities. For example, they seem constrain the practice of earnings management, demand more conservative financial reporting or high audit quality, and mitigate the incentives for companies to misreport (Burns et al., 2010; Kane and Velury, 2004; Hadani et al., 2011; Ramalingegowda and Yu, 2012). Moreover, when their concerns are not heeded, institutional ownership could sell their stock holdings, such as “voting with their feet” (Parrino et al., 2003). They also could influence executive compensation structures and mitigate the agency problem between shareholders and managers (Almazan et al., 2005; Hartzell and Starks, 2003). Lee and Park (2009) find that institutional activism could increase shareholder wealth and spillovers on non-target companies. On the other hand, within a cost-benefit framework, Chen et al. (2007) argue that only when monitoring benefits exceed costs would institutional investors specialize in monitoring and influencing efforts rather than trading.
Following this line of thought, foreign shareholders with efficiencies and incentives could play a monitoring or disciplinary role of the companies they hold, and take a lead role in improving corporate governance and shareholder activism (Choi et al., 2012; Jeon et al., 2011; Jeon and Ryoo, 2013). Li et al. (2011) find that large foreign ownership could mitigate stock return volatility and seems play a stabilizing or monitoring role in emerging stock markets. Douma et al. (2006) provide that foreign institutional investors have superior monitoring abilities, resource endowments and skills to use the institutional environment to their advantage. They also increase corporate governance by terminating poorly performing CEOs (Aggarwal et al., 2011). Additionally, the QFII in Taiwan could enhance monitoring strength, alleviate agency problems, reduce capital market imperfections, and improves corporate performance (Huang and Shiu, 2009; Hung and Tseng, 2009). Moreover, Bae et al. (2011) argue that foreign investors are able to discern between listed companies with good versus bad or predict companies’ operating and financial performance. Previous studies have proposed that foreign ownership is associated with greater transparency and disclosure, higher corporate value and financial performance, better corporate governance and larger size (Aggarwal et al., 2005; Ferreira and Matos, 2008; Kim et al., 2010; Ko et al., 2007; Sueyoshi et al., 2010).
3. Research Design
3.1 Data
The research data come from the Taiwan Economic Journal database and the website of the TWSE. The sample selection criteria require listed companies to have complete financial data and no restriction on foreign ownership during the sampling period. These procedures result in 476 listed companies from 2003Q1 to 2010Q4, which include a total of 32 quarters.
3.2 Methodology and Variables
Using a non-parametric technique, the data envelopment analysis (DEA) measures efficiency by comparing each company to a “best practice” efficient frontier formed. Banker and Natarajan (2008) argue that DEA performs better than parametric procedures in the estimation of individual decision making unit productivity, and two-stage approach is statistically consistent in a composed error framework. In addition, using the DEA model could avoid functional form misspecification problems and the effects of endogeneity or incorrect error term distribution assumptions (Bozec and Dia, 2007; Margaritis and Psillaki, 2010; Sueyoshi et al., 2010). Based on the framework of
~ 38 ~
Sueyoshi et al. (2010), the DEA’s model of this study is constructed using one single output and four inputs (i.e. one single output is net sales, and four inputs include: total fixed assets, cost of goods sold, operating expenses, and number of employee). All inputs and output data report non-negative variables, including 476 listed companies over 32 quarters. Corporate operational efficiency scores (EFF) vary between 0 and 1. If a corporate operational efficiency is on the best practice frontier, its efficiency score equals to 1; whereas inefficient companies have scores between 0 and 1.
Following the previous research, this study traces the effects of foreign ownership (FO), change in foreign ownership (∆FO) and corporate operational efficiency (EFF), and the interaction between them. This study also examines the impact of these variables on corporate performance measures, such as Tobin’s Q and ROA (King and Santor, 2008; Kim et al., 2010). To isolate the relationship among foreign ownership, corporate operational efficiency and performance, the regression models further consider several control variables. Size is measured by the natural log of quarter sales (Sales). Larger sales possess comprehensive managerial, organizational and financial structures, or enjoy economies of scale in monitoring (Margaritis and Psillaki, 2010; Psillaki et al., 2010). The sales growth rate (Growth) can serve as a proxy for growth opportunities. Growth has a positive effect on corporate performance (King and Santor, 2008; Margaritis and Psillaki, 2010). In contrast, companies with more growth opportunities are more difficult to monitor. When a company does not have strong internal control procedures, the growth rate may negatively associate with corporate performance or efficiency (Hutchinson and Gul, 2004). The tangibility ratio (TANG) is measured as the ratio of fixed tangible assets divided by the total assets of the company. Tangibles are easily monitored or good collateral and as a result diminish agency conflicts, but more collateral requirements may give rise to countervailing adverse selection effects, such as undertaking riskier projects (Margaritis and Psillaki, 2010; Psillaki et al., 2010). The quarter equity turnover (Turnover) is measured by the sales to equity ratio. Turnover captures the sales generating ability of a net worth, but excessive sales to net worth ratios may be viewed as a poor credit risk due to insufficient equity capital to support sales (Psillaki et al., 2010). Furthermore, to account for some unobserved changes in market or regulatory conditions over time effects, the models also include quarterly fixed effects.
4. Empirical Results
Foreign investors offer portfolio management services. If financial markets are informationally efficient and all investors rationally optimize the relationship between risk and expected return in equilibrium, the market capitalization weighted value investment portfolios may have the lowest possible volatility given their expected return. Table 1 shows basic descriptive statistics for foreign investment allocation strategies and corporate operational efficiency, based on the average market value over the study period (from 2003Q1 to 2010Q4). This study sorts into difference groups: high-tech versus non-high-tech and exporting versus non-exporting companies. Throughout the sample period, foreign investors overweight the high-tech and exporting companies; underweight the non-high-tech and non-exporting companies. Moreover, using t-statistic for differences of EFF, the high-tech (exporting) companies have better corporate operational efficiency than the non-high-tech (non-exporting) companies.
These findings seem imply that corporate operational efficiency has become an important investment criterion for investors. Foreign investors might have voted with their feet by selling shares with poor operational efficiency and buying shares with better efficiency, as a result of their portfolio rebalancing activity. Previous researches find that foreign institutional investors have a
~ 39 ~
strong bias for companies that have external visibility through large sales abroad, more analyst coverage, greater transparency and disclosure (Aggarwal et al., 2005; Ferreira and Matos, 2008). This study complements their findings and argues that foreign portfolio investments may also play an essential role in corporate operational efficiency. High level of foreign ownership seems convey a signal regarding better corporate operational efficiency.
Table 1. Basic descriptive statistics
Market capitalization value ($TW billion)
Foreign ownership Market value Proportion of foreign ownership Value-weighted of foreign ownership Overall value-weighted ownership Portfolio
basis EFF t-test #
(a) (b) (a)/(b) (a') (b') (a')/(b')
Full sample 3627.2 10385.5 34.93% 100% 100% 0.735 476
Exporting 3129.8 7867.8 39.78% 86.29% 75.76% 1.14 0.737 * 244
Non-exporting 497.4 2517.6 19.76% 13.71% 24.24% 0.57 0.733 232
High-tech 2863.2 6731.1 42.54% 78.94% 64.81% 1.22 0.748 *** 200
Non-high-tech 764 3654.4 20.91% 21.06% 35.19% 0.6 0.726 276
Notes: Exporting (Non-exporting) companies refer to: companies exported more (less) than 50% of their
product’s sales, based on average sales over the study period. High-tech companies include: computer & peripheral, internet and information service, optoelectronic and semiconductor. Non-high-tech companies include: cement, foods, plastics, textiles, electric & machinery, electric appliance & cab, chemical, biotechnology & medical, glass & ceramics, pulp/paper, iron & steel, rubber, automobile, tourism & amusement, trade service & shopping center, and others. #: The number of companies. *, **, *** indicate significance at 10%, 5%, and 1% levels, respectively.
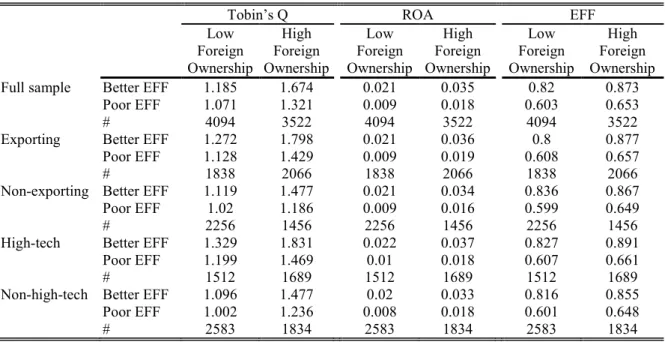
Table 2. Mean score of Tobin’s Q, ROA and corporate operational efficiency
Tobin’s Q ROA EFF
Low Foreign Ownership High Foreign Ownership Low Foreign Ownership High Foreign Ownership Low Foreign Ownership High Foreign Ownership
Full sample Better EFF 1.185 1.674 0.021 0.035 0.82 0.873
Poor EFF 1.071 1.321 0.009 0.018 0.603 0.653
# 4094 3522 4094 3522 4094 3522
Exporting Better EFF 1.272 1.798 0.021 0.036 0.8 0.877
Poor EFF 1.128 1.429 0.009 0.019 0.608 0.657
# 1838 2066 1838 2066 1838 2066
Non-exporting Better EFF 1.119 1.477 0.021 0.034 0.836 0.867
Poor EFF 1.02 1.186 0.009 0.016 0.599 0.649
# 2256 1456 2256 1456 2256 1456
High-tech Better EFF 1.329 1.831 0.022 0.037 0.827 0.891
Poor EFF 1.199 1.469 0.01 0.018 0.607 0.661
# 1512 1689 1512 1689 1512 1689
Non-high-tech Better EFF 1.096 1.477 0.02 0.033 0.816 0.855
Poor EFF 1.002 1.236 0.008 0.018 0.601 0.648
# 2583 1834 2583 1834 2583 1834
~ 40 ~
Table 2 above reports the mean score of Tobin’s Q, ROA and corporate operational efficiency. All firms are classified into four different groups. These four portfolios are formed from the intersections of the two foreign ownership and two corporate operational efficiency groups. First, this study is sorted into two groups on the basis of foreign ownership. Based on the framework of Li et al. (2011), high (Low) level of foreign ownership is defined as foreign portfolio investments with more (less) than 5% holdings of a company's shares. Then, each group of High (Low) foreign ownership is split further into equal parts of both Better and Poor corporate operational efficiency (EFF). The findings indicate that companies with high foreign ownership have high Tobin’s Q, ROA and better EFF. Specifically, high foreign ownership and better corporate operational efficiency have the best corporate performance. Interestingly, the exporting and high-tech companies perform better than non-exporting and non-high-tech companies. The results imply that foreign ownership, corporate operational efficiency and the interaction between them may positively relate to corporate performance. This evidence complements prior literature (Li et al., 2011): large foreign ownership not only mitigates stock return volatility but also enhances corporate operational efficiency and performance.
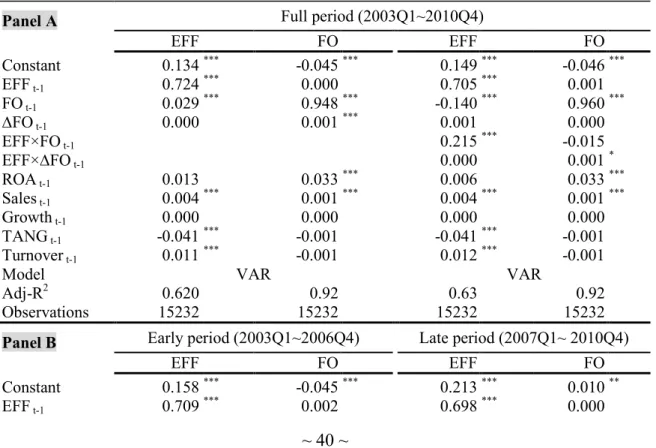
Foreign ownership and corporate operational efficiency are fundamentally intertwined because makeup and actions are jointly endogenous. In order to clarify the relative contribution of these variables, Table 3 uses one lagged design Vector Auto-Regression (VAR) model to estimate the relationship between foreign ownership and corporate operational efficiency. To facilitate the effects of comprehensive disclosure, the regression models control several corporate characteristics variables, such as quarter profit return (ROA), the natural log of quarter sales (Sales), sales growth rate (Growth), tangibility ratio (TANG), quarter equity turnover rate (Turnover) and quarterly fixed effects.
Table 3 The relationship between foreign ownership and corporate operational efficiency Panel A Full period (2003Q1~2010Q4)
EFF FO EFF FO Constant 0.134 *** -0.045 *** 0.149 *** -0.046 *** EFF t-1 0.724 *** 0.000 0.705 *** 0.001 FO t-1 0.029 *** 0.948 *** -0.140 *** 0.960 *** ∆FO t-1 0.000 0.001 *** 0.001 0.000 EFF×FO t-1 0.215 *** -0.015 EFF×∆FO t-1 0.000 0.001 * ROA t-1 0.013 0.033 *** 0.006 0.033 *** Sales t-1 0.004 *** 0.001 *** 0.004 *** 0.001 *** Growth t-1 0.000 0.000 0.000 0.000 TANG t-1 -0.041 *** -0.001 -0.041 *** -0.001 Turnover t-1 0.011 *** -0.001 0.012 *** -0.001
Model VAR VAR
Adj-R2 0.620 0.92 0.63 0.92
Observations 15232 15232 15232 15232
Panel B Early period (2003Q1~2006Q4) Late period (2007Q1~ 2010Q4)
EFF FO EFF FO
Constant 0.158 *** -0.045 *** 0.213 *** 0.010 **
~ 41 ~
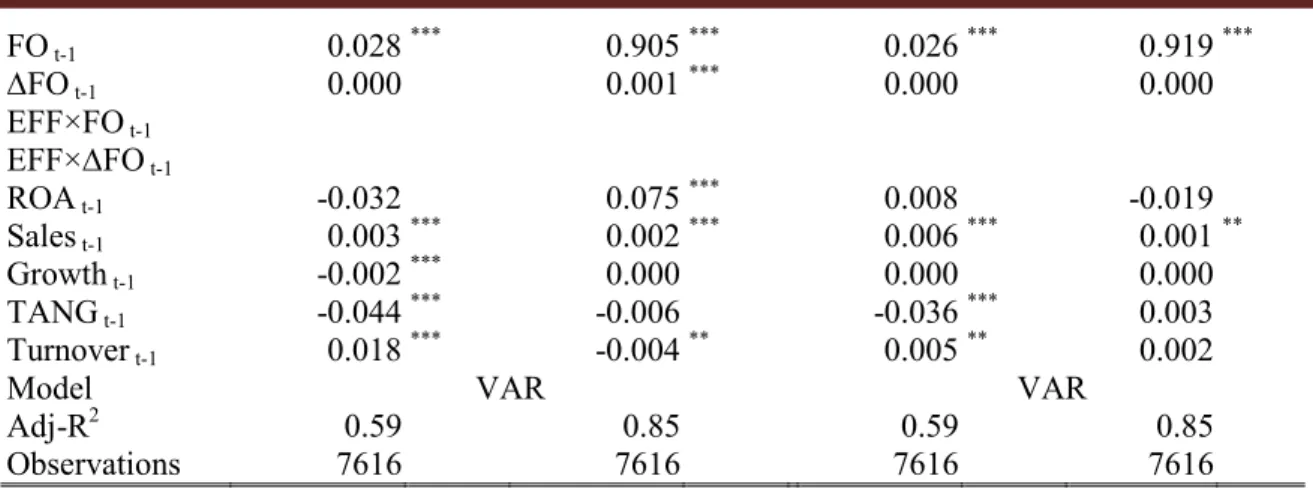
FO t-1 0.028 *** 0.905 *** 0.026 *** 0.919 *** ∆FO t-1 0.000 0.001 *** 0.000 0.000 EFF×FO t-1 EFF×∆FO t-1 ROA t-1 -0.032 0.075 *** 0.008 -0.019 Sales t-1 0.003 *** 0.002 *** 0.006 *** 0.001 ** Growth t-1 -0.002 *** 0.000 0.000 0.000 TANG t-1 -0.044 *** -0.006 -0.036 *** 0.003 Turnover t-1 0.018 *** -0.004 ** 0.005 ** 0.002Model VAR VAR
Adj-R2 0.59 0.85 0.59 0.85
Observations 7616 7616 7616 7616
Notes: *, **, *** indicate significance at 10%, 5%, and 1% levels, respectively; t-1: lag one quarter.
The results show that corporate operational efficiency has been enhanced by foreign ownership, but fails to find evidence in the opposite direction, suggesting foreign investment decision-making process or philosophies play central roles in corporate operational efficiency. Because foreign investors could provide expertise monitoring over management and have superior disciplinary abilities (Choi et al., 2012; Douma et al., 2006), these findings explain what roles foreign investors play in corporate operational efficiency after more financial liberalization. That is, foreign shareholders are not limited to just speculators. They also play a monitoring or disciplinary role, and thus enhance corporate operational efficiency. With censored data (corporate operational efficiency), this study also checks Tobit model and finds the result similar to VAR model estimates in the EFF regressions. Moreover, if this study splits the sample into two parts (Early period: 2003Q1~ 2006Q4; Late period: 2007Q1~ 2010Q4) or sorts into four groups (high-tech versus non-high-tech and exporting versus non-exporting companies), the results are generally consistent with the main idea. All of the above results are robust to suggest foreign ownership plays an important role in corporate operational efficiency. Whatever types of companies or periods are selected, high foreign shareholders leads to better corporate operational efficiency, and interaction term (EFF×FO) positively impacted on operational efficiency.
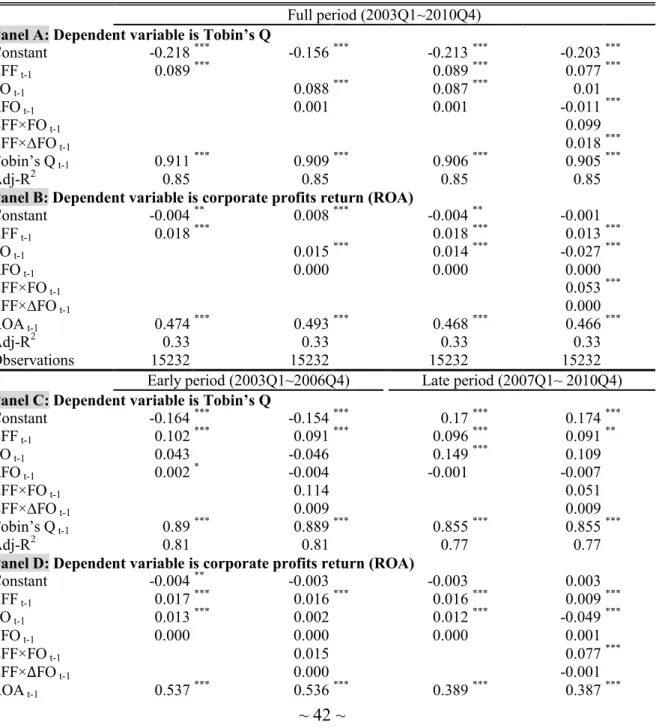
Table 4 shows relationship among corporate performance (Tobin’s Q and ROA), foreign ownership and corporate operational efficiency. The results show the large concentration of foreign ownership and better corporate operational efficiency within a company are likely to trigger high corporate performance. Specially, If independent variables simultaneously include corporate operational efficiency and foreign ownership, the coefficients of corporate operational efficiency are similar, but the coefficients of foreign ownership decreased (see, Panel A: from 0.088 to 0.087; Panel B: from 0.015 to 0.014). Moreover, If this study adds interaction term to the regression models, the coefficients of foreign ownership become insignificant or negative relationship, but the interaction variable (EFF×∆FO) significantly positively impacts on Tobin’s Q. Additionally, ROA are significantly positively correlated with the interaction variable (EFF×FO). Furthermore, if this study splits the sample into two parts, the coefficient of change in foreign ownership significantly positively impacts on Tobin’s Q during the early period, whereas the coefficient of foreign ownership significantly positively impacts on Tobin’s Q during the late period. The interaction term (EFF×FO) significantly positively influences on ROA.
Taken together (see Tables 3 and 4), the results seem to warrant three evidences: (1) high level of foreign ownership leads to better corporate operational efficiency; (2) the impact of corporate
~ 42 ~
operational efficiency is superior to that of foreign ownership; and (3) the interaction terms
positively impact on ROA or Tobin’s Q. These findings suggest a possible channel through which
high foreign ownership significantly positively affects corporate operating efficiency, and then better operational efficiency triggers high corporate performance. These findings on the valuation effect of foreign ownership are consistent with two potential roles. First, foreign shareholders may simply self-select into corporate value. They may be short-term investors acting like traders or speculators, holding or selling the stocks according to their information. Moreover, due to foreign ownership have quality of research and possess superior stock selection ability, the change in foreign ownership or the interaction variable (EFF×∆FO) positively affect Tobin’s Q.
Table 4 Corporate performance, foreign ownership and corporate operational efficiency
Full period (2003Q1~2010Q4)
Panel A: Dependent variable is Tobin’s Q
Constant -0.218 *** -0.156 *** -0.213 *** -0.203 *** EFF t-1 0.089 *** 0.089 *** 0.077 *** FO t-1 0.088 *** 0.087 *** 0.01 ∆FO t-1 0.001 0.001 -0.011 *** EFF×FO t-1 0.099 EFF×∆FO t-1 0.018 *** Tobin’s Q t-1 0.911 *** 0.909 *** 0.906 *** 0.905 *** Adj-R2 0.85 0.85 0.85 0.85
Panel B: Dependent variable iscorporate profits return (ROA)
Constant -0.004 ** 0.008 *** -0.004 ** -0.001 EFF t-1 0.018 *** 0.018 *** 0.013 *** FO t-1 0.015 *** 0.014 *** -0.027 *** ∆FO t-1 0.000 0.000 0.000 EFF×FO t-1 0.053 *** EFF×∆FO t-1 0.000 ROA t-1 0.474 *** 0.493 *** 0.468 *** 0.466 *** Adj-R2 0.33 0.33 0.33 0.33 Observations 15232 15232 15232 15232
Early period (2003Q1~2006Q4) Late period (2007Q1~ 2010Q4)
Panel C: Dependent variable is Tobin’s Q
Constant -0.164 *** -0.154 *** 0.17 *** 0.174 *** EFF t-1 0.102 *** 0.091 *** 0.096 *** 0.091 ** FO t-1 0.043 -0.046 0.149 *** 0.109 ∆FO t-1 0.002 * -0.004 -0.001 -0.007 EFF×FO t-1 0.114 0.051 EFF×∆FO t-1 0.009 0.009 Tobin’s Q t-1 0.89 *** 0.889 *** 0.855 *** 0.855 *** Adj-R2 0.81 0.81 0.77 0.77
Panel D: Dependent variable is corporate profits return (ROA)
Constant -0.004 ** -0.003 -0.003 0.003 EFF t-1 0.017 *** 0.016 *** 0.016 *** 0.009 *** FO t-1 0.013 *** 0.002 0.012 *** -0.049 *** ∆FO t-1 0.000 0.000 0.000 0.001 EFF×FO t-1 0.015 0.077 *** EFF×∆FO t-1 0.000 -0.001 ROA t-1 0.537 *** 0.536 *** 0.389 *** 0.387 ***
~ 43 ~
Adj-R2 0.38 0.38 0.26 0.27
Observations 7616 7616 7616 7616
Notes: All regression models control: Sales, Growth, TANG, Turnover, and quarter fixed effects; not
shown. *, **, *** indicate significance at 10%, 5%, and 1% levels, respectively. t-1: lag one quarter.
Second, consistent with the idea of Huang and Shiu (2009), foreign investors could play positive a monitoring or disciplinary role that can dynamically influence ROA, especially during the late period. Foreign shareholders could exert direct or indirect influencing managers’ actions through intervention, meetings with managers, more analyst coverage, voicing their interests to corporate management, or voting with their feet, and foreign board membership (Aggarwal et al., 2011; Choi et al., 2012; Parrino et al., 2003). These evidences also complement prior literature that discusses the impact of foreign ownership on corporate performance (Bae et al., 2011; Douma et al., 2006; Huang and Shiu, 2009; Ferreira and Matos, 2008) and enhance to understand on the effects of foreign portfolio investments. Simply stated, foreign investors are not only speculators but also monitoring or disciplinary roles, and thus improve corporate operational efficiency and performance.
This study argues that listed companies may have heterogeneous performance. Table 5 indicates that the coefficients of the EFF of high-tech and exporting companies are stronger significantly positively associated with Tobin’s Q and ROA. In particular, the interaction variables (EFF×∆FO) are positively correlated with Tobin’s Q, especially companies with high-tech and exporting orientation. Due to companies with large sales abroad or high-tech orientation are more likely to be familiar to foreign investors, foreign shareholders can monitor these companies more easily. The results support that the influences of high-tech and exporting companies are greater than the others. It is notable that significant differences are found to exist between high-tech (exporting) and non-high-tech (non-exporting) companies.
Table 5. The industries effects
Exporting Non-exporting High-tech Non-high-tech
Panel A: Dependent variable is Tobin’s Q
EFF t-1 0.187 *** 0.187 *** 0.066 *** 0.051 ** 0.153 *** 0.151 *** 0.065 *** 0.043 * FO t-1 0.071 ** 0.107 0.126 *** -0.077 0.105 *** 0.126 0.082 *** -0.154 ∆FO t-1 0.001 -0.017 *** 0.001 0.008 0.001 -0.016 *** 0.000 0.002 EFF×FO t-1 -0.043 0.262 -0.024 0.305 * EFF×∆FO t-1 0.026 *** -0.010 0.024 *** -0.003 Tobin’s Q t-1 0.902 *** 0.901 *** 0.904 *** 0.903 *** 0.899 *** 0.898 *** 0.907 *** 0.907 *** Adj-R2 0.85 0.85 0.85 0.85 0.85 0.85 0.85 0.85
Panel B: Dependent variable is corporate profits return (ROA)
EFF t-1 0.029 *** 0.024 *** 0.011 *** 0.008 *** 0.032 *** 0.026 *** 0.011 *** 0.008 *** FO t-1 0.012 *** -0.021 ** 0.019 *** -0.014 0.012 *** -0.034 *** 0.017 *** -0.006 ∆FO t-1 0.000 0.000 -0.000 -0.001 0.000 0.000 0.000 -0.001 EFF×FO t-1 0.042 *** 0.042 ** 0.059 *** 0.030 * EFF×∆FO t-1 0.000 0.001 -0.000 0.002 * ROA t-1 0.460 *** 0.459 *** 0.448 *** 0.447 *** 0.512 *** 0.510 *** 0.402 *** 0.402 *** Adj-R2 0.36 0.36 0.32 0.32 0.41 0.41 0.27 0.28 Observations 7808 7808 7424 7424 6400 6400 8832 8832
Notes: All regression models control: Sales, Growth, TANG, Turnover, and quarter fixed effects; not
Submitted on 06/Feb./2013
Article ID: 1923-7529-2013-03-34-14 Tung-Hao Lee, and Jiun-Kai Huang
~ 44 ~
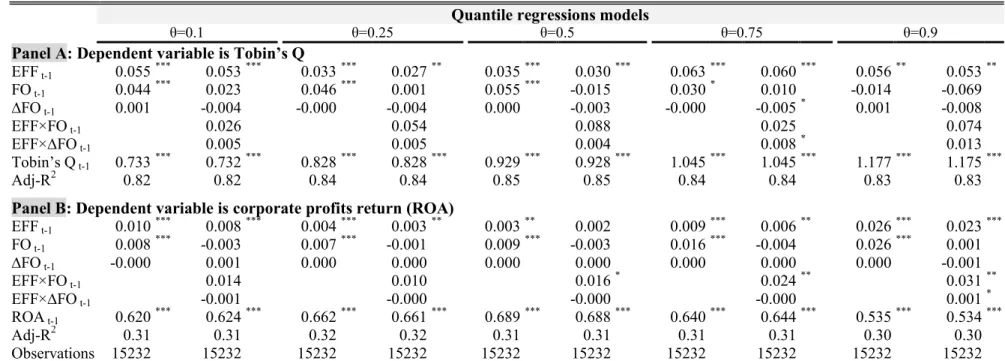
Table 6 The heterogeneity effects Quantile regressions models
θ=0.1 θ=0.25 θ=0.5 θ=0.75 θ=0.9
Panel A: Dependent variable is Tobin’s Q
EFF t-1 0.055 *** 0.053 *** 0.033 *** 0.027 ** 0.035 *** 0.030 *** 0.063 *** 0.060 *** 0.056 ** 0.053 ** FO t-1 0.044 *** 0.023 0.046 *** 0.001 0.055 *** -0.015 0.030 * 0.010 -0.014 -0.069 ∆FO t-1 0.001 -0.004 -0.000 -0.004 0.000 -0.003 -0.000 -0.005 * 0.001 -0.008 EFF×FO t-1 0.026 0.054 0.088 0.025 0.074 EFF×∆FO t-1 0.005 0.005 0.004 0.008 * 0.013 Tobin’s Q t-1 0.733 *** 0.732 *** 0.828 *** 0.828 *** 0.929 *** 0.928 *** 1.045 *** 1.045 *** 1.177 *** 1.175 *** Adj-R2 0.82 0.82 0.84 0.84 0.85 0.85 0.84 0.84 0.83 0.83
Panel B: Dependent variable is corporate profits return (ROA)
EFF t-1 0.010 *** 0.008 *** 0.004 *** 0.003 ** 0.003 ** 0.002 0.009 *** 0.006 ** 0.026 *** 0.023 *** FO t-1 0.008 *** -0.003 0.007 *** -0.001 0.009 *** -0.003 0.016 *** -0.004 0.026 *** 0.001 ∆FO t-1 -0.000 0.001 0.000 0.000 0.000 0.000 0.000 0.000 0.000 -0.001 EFF×FO t-1 0.014 0.010 0.016 * 0.024 ** 0.031 ** EFF×∆FO t-1 -0.001 -0.000 -0.000 -0.000 0.001 * ROA t-1 0.620 *** 0.624 *** 0.662 *** 0.661 *** 0.689 *** 0.688 *** 0.640 *** 0.644 *** 0.535 *** 0.534 *** Adj-R2 0.31 0.31 0.32 0.32 0.31 0.31 0.31 0.31 0.30 0.30 Observations 15232 15232 15232 15232 15232 15232 15232 15232 15232 15232
Notes: All regression models control: Sales, Growth, TANG, Turnover, and quarter fixed effects; not shown. *, **, *** indicate significance at 10%, 5%,
~ 45 ~
This study also adopts the quantile regression models to reveal the whole spectrum of heterogeneous corporate performance responses to corporate operational efficiency and foreign ownership effort, and checks for the sensitivity of the main results. This study establishes 5 quantiles (θ = 0.1, 0.25, 0.5, 0.7 and 0.9). The results, reported in Table 6, are generally consistent with the main idea. The quantile regressions can examine the differential impact across the entire performance distribution. That is, the research results are more comprehensive, informative and robust.
5. Conclusion
In accordance with the changing behavior of foreign shareholders, listed companies can no longer ignore that the voice of foreign investors has become an extremely important factor in considering companies’ operating and management. Hence, with more liberalization, the growing involvement of foreign ownership is likely to have induced a significant change in corporate operating strategies. High foreign ownership leads to better corporate operational efficiency. Furthermore, better operational efficiency within a company is more likely to trigger high performance. This gives additional insights into research showing that foreign ownership positively relates to connect with subsequent high corporate performance. Thus this study provides some clues to the extant diverse findings concerning the impact of foreign shareholders on corporate operational efficiency and performance.
Unlike listed companies in developed stock markets, the ownership structure in Taiwan is characterized by the dominance of widely dispersed individual investors. Individual investors are uninformed, highly volatile or trade frequently and more inclined to heed rumors. As opposed to individual investors, foreign institutional shareholders have the resources to conduct fundamental research. They play two roles, but not mutually exclusive: a speculator or a positive governance role. When monitoring benefits exceed costs (such as high-tech and exporting companies), they have potential ability and incentive to control or influence managers’ operating decisions to increase corporate operational efficiency or value. These findings might explain or complement somewhat empirical evidence about the monitoring or disciplinary role of foreign ownership. In general, it is worth exploring in the particular ways or more depth how foreign shareholders exert their influence. The research findings can be applied to other emerging markets. Taiwan case maybe established a paradigm for developing countries to follow. It also provides policy implications for other emerging markets that deregulate foreign investment restrictions.
References
[1] Aggarwal, R., Erel, I. Ferreira, M. and Matos, P. (2011), “Does governance travel around the world? Evidence from institutional investors”, Journal of Financial Economics, 100(1): 154-181.
[2] Aggarwal, R., Klapper, L. and Wysocki, P.D. (2005), “Portfolio preferences of foreign institutional investors”, Journal of Banking and Finance, 29(12): 2919-2946.
[3] Almazan, A., Hartzell, J.C. and Starks, L.T. (2005), “Active institutional shareholders and costs of monitoring: evidence from executive compensation”, Financial Management, 34(4): 5-34. [4] Bae, K.H. and Goyal, V.K. (2010), “Equity market liberalization and corporate governance”,
~ 46 ~
[5] Bae, K.H., Ozoguz, A. Tan, H. and Wirjanto, T.S. (2012), “Do foreigners facilitate information transmission in emerging markets?” Journal of Financial Economics, 105(1): 209-227.
[6] Bae, S.C., Min, J.H. and Jung, S. (2011), “Trading behavior, performance, and stock preference of foreigners, local institutions, and individual investors: evidence from the Korean stock market”, Asia-Pacific Journal of Financial Studies, 40(2): 199-239.
[7] Banker, R.D. and Natarajan, R. (2008), “Evaluating contextual variables affecting productivity using Data Envelopment Analysis”, Operations Research, 56(1): 48-58.
[8] Barber, B.M., Lee, Y.T., Liu, Y.J. and Odean, T. (2009), “Just how much do individual investors lose by trading?” The Review of Financial Studies, 22(2): 609-632.
[9] Bekaert, G., Harvey, C.R. and Lundblad, C. (2005), “Does financial liberalization spur growth?”
Journal of Financial Economics, 77(1): 3-55.
[10] Bekaert, G., Harvey, C.R. and Lundblad, C. (2011), “Financial openness and productivity”,
World Development, 39(1): 1-19.
[11] Bozec R., and Dia, M. (2007), “Board structure and firm technical efficiency: evidence from Canadian state-owned enterprises”, European Journal of Operational Research, 177(3): 1734-1750.
[12] Burns, N, Kedia, S. and Lipson, M. (2010), “Institutional ownership and monitoring: evidence from financial misreporting”, Journal of Corporate Finance, 16(4): 443-455.
[13] Chen, X., Harford, J. and Li, K. (2007), “Monitoring: Which institutions matter?” Journal of
Financial Economics, 86(2): 279-305.
[14] Choi, H.M., Sul, W. and Min, S.K. (2012), “Foreign board membership and firm value in Korea”, Management Decision, 50(2): 207-233.
[15] Douma S., George, R. and Kabir, R. (2006), “Foreign and domestic ownership, business groups, and firm performance: evidence from a large emerging market”, Strategic Management Journal, 27(7): 637-657.
[16] Ferreira, M.A. and Matos, P. (2008), “The colors of investors’ money: the role of institutional investors around the world”, Journal of Financial Economics, 88(3): 499-533.
[17] Hadani, M., Goranova, M. and Khan, R. (2011), “Institutional investors, shareholder activism, and earnings management”, Journal of Business Research, 64(12): 1352-1360.
[18] Hartzell, J.C. and Starks, L.T. (2003), “Institutional investors and executive compensation”,
Journal of Finance, 58(6): 2351-2374.
[19] Huang, R.D. and Shiu, C.Y. (2009), “Local effects of foreign ownership in an emerging financial market: evidence from qualified foreign institutional investors in Taiwan”, Financial
Management, 38(3): 567-602.
[20] Hung, J.H. and Tseng, T.Y. (2009), “Impact of the QFII scheme on investment-cash flow sensitivity”, Asia-Pacific Journal of Financial Studies, 38(3): 311-335.
[21] Hutchinson, M. and Gul, F.A. (2004), “Investment opportunity set, corporate governance practices and firm performance”, Journal of Corporate Finance, 10(4): 595-614.
[22] Jeon, J.Q. and Ryoo, J. (2013), “How do foreign investors affect corporate policy? Evidence from Korea”, International Review of Economics and Finance, 25(1):52-65.
[23] Jeon, J.Q., Lee, C. and Moffett, C.M. (2011), “Effects of foreign ownership on payout policy: evidence from the Korean market”, Journal of Financial Markets, 14(2): 344-375.
~ 47 ~
[24] Kane, G.D. and Velury, U. (2004), “The role of institutional ownership in the market for auditing services: an empirical investigation”, Journal of Business Research, 57(9): 976-983. [25] Kim, E.H. and Singal, V. (2000), “Stock market openings: experience of emerging economies”,
Journal of Business, 73(1): 25-66.
[26] Kim, I.J., Eppler-Kim, J., Kim, W.S. and Byun, S.J. (2010), “Foreign investors and corporate governance in Korea”, Pacific-Basin Finance Journal, 18(4): 390-402.
[27] King, M.R., and Santor, E. (2008), “Family values: Ownership structure, performance and capital structure of Canadian firms”, Journal of Banking and Finance, 32(11): 2423-2432. [28] Ko, K., Kim, K. and Cho, S.H. (2007), “Characteristics and performance of institutional and
foreign investors in Japanese and Korean stock markets”, Journal of the Japanese and
International Economies, 21(2): 195-213.
[29] Lee, D.W. and Park, K.S. (2009), “Does institutional activism increase shareholder wealth? evidence from spillovers on non-target companies”, Journal of Corporate Finance, 15(4): 488-504.
[30] Li, D., Nguyen, Q.N., Pham, P.K. and Wei, S.X. (2011), “Large foreign ownership and firm-level stock return volatility in emerging markets”, Journal of Financial and Quantitative
Analysis, 46(4): 1127-1155.
[31] Margaritis, D. and Psillaki, M. (2010), “Capital structure, equity ownership and firm performance”, Journal of Banking and Finance, 34(3): 621-632.
[32] Mitton, T. (2006), “Stock market liberalization and operating performance at the firm level”,
Journal of Financial Economics, 81(3): 625-647.
[33] O’Connor, T. (2012), “Investability, corporate governance and firm value”, Research in
International Business and Finance, 26(1): 120-136.
[34] Parrino, R., Sias, R.W. and Starks, L.T. (2003), “Voting with their feet: institutional ownership changes around forced CEO turnover”, Journal of Financial Economics, 68(1): 3-46.
[35] Poshakwale, S.S. and Thapa, C. (2010), “Foreign investors and global integration of emerging indian equity market”, Journal of Emerging Market Finance, 9(1): 1-24.
[36] Psillaki, M., Tsolas, I.E. and Margaritis, D. (2010), “Evaluation of credit risk based on firm performance”, European Journal of Operational Research, 201(3): 873-881.
[37] Puckett, A. and Yan, X. (2011), “The interim trading skills of institutional investors”, Journal
of Finance, 66(2): 601-633.
[38] Ramalingegowda, S. and Yu, Y. (2012), “Institutional ownership and conservatism”, Journal of
Accounting and Economics, 53(1-2): 98-114.
[39] Sueyoshi T., Goto, M. and Omi, Y. (2010), “Corporate governance and firm performance: evidence from Japanese manufacturing industries after the lost decade”, European Journal of