NOTE
Simplified Description of Adsorption Breakthrough Curves
of 1,1-Dichloro-1-fluoroethane (HCFC-141b)
on Activated Carbon with Temperature Effect
Recovery of HCFC-141b, used as a major alternative solventand foam-blowing agent for CFCs in industrial applications, has received great attention due to its gradual phase out. This paper describes an investigation of the adsorption breakthrough of HCFC-141b vapor on a commercial activated carbon. A simple theoretical model developed by Yoon and Nelson was applied to investigate the breakthrough behavior of HCFC-141b on an acti-vated carbon column. The values of parameters k* (a rate con-stant) andt (the time required for 50% adsorbate breakthrough) in the Yoon and Nelson model were determined at four different concentration levels (i.e., 399, 734, 1139, and 1954 ppmv) and five temperature ranges (i.e., 283, 293, 298, 303, and 313 K), respec-tively. These values were used to calculate the entire (0 –100%) breakthrough curve (plot of percentage breakthrough versus time) regarding the adsorption of HCFC-141b on activated carbon col-umns. It was found that the calculated theoretical breakthrough curves are in high agreement with the corresponding experimental data. Also, the rate constant k* can be reasonably represented by the empirical Arrhenius equation. The results obtained are appli-cable for the scale-up design of adsorption columns in the HCFC adsorption on activated carbon adsorbent. © 1999 Academic Press
Key Words: adsorption breakthrough; HCFC-141b; activated carbon; temperature effect.
INTRODUCTION
Recently, under the terms of the Montreal Protocol in Substances that Deplete the Ozone Layer, the production and use of hydrochlorofluorocarbons (HCFCs) such as 1,1-dichloro-1-fluoroethane (HCFC-141b) will gradually be phased out by the year 2030 or earlier (1). Because they have physicochemical properties similar to those of chlorofluorocarbons (CFCs) and relatively low ozone depletion potential (ODP), HFCs are currently considered excellent interim substitutes for CFCs in industrial applications (2). HCFC-141b, one of the most widely used HCFCs, is currently used as a popular substitute for CFC-113, which was the cleaning agent employed in the electronic and precision-machining industries, and is an excellent replacement for CFC-11, which was the foaming agent in the manufacturing of polyurethane insulation (3). Therefore, it is necessary to adopt the so-called maximum achievable control technology (e.g., adsorption) for the emission control and recovery of HCFC-141b.
Fixed-bed adsorption has been applied widely in separation and recovery of vapors of volatile organic compounds (VOCs) (4). In general, it has been recognized that activated carbon is the most practical adsorbent for the sepa-ration applications due to its large internal surface area and pore volume (5). To design such an adsorption process, it is important to understand the
thermodynamic characteristics between the adsorbent and the adsorbate. In addition, knowledge of adsorption kinetics or dynamic behavior in a fixed bed is also valuable in calculating adsorption separation processes. However, the numerical computation of mass and heat balance equations for each granular adsorbent, in addition to the balances for the bed, greatly complicates the task regarding the breakthrough curve (5).
Many theoretical or empirical equations have been proposed for modeling the breakthrough curves in fixed-bed adsorption (6). Measured breakthrough times (i.e., times to reach defined effluent concentrations) for adsorbate re-moval from flowing air by activated charcoal have been fitted to the modified Wheeler equation (7), the Mecklenburg equation (8), and the Yoon and Nelson equation (9, 10). Of these, the Wheeler equation was derived originally for catalysis with bed poisoning, and the Mecklenburg equation was proposed for predicting gas mask filtration. These theoretical approaches are relatively complicated and not entirely satisfactory (9). The Yoon and Nelson equation was developed by a simple model addressing the adsorption and the break-through of adsorbate vapors or gases with respect to activated charcoal. The Yoon and Nelson model not only is less complicated than the Wheeler and Mecklenburg equations but also requires no detailed data concerning the characteristics of the adsorbate of interest, the type of activated charcoal, or the physical properties of the adsorption bed. That is, the applications of both modified Wheeler and Mecklenburg equations require the values of a number of parameters, which are not easy to obtain or estimate. Moreover, the Yoon and Nelson model has been successfully applied to describe the breakthrough curves for different organic adsorbate vapors at several different adsorbate concentrations. It was noted that the new model agrees with experimental data over the entire range of adsorbate breakthrough percentages (i.e., 0 –100%), whereas the breakthrough curves derived by the Wheeler and Mecklenburg equations have approximately the same shape as the corresponding experi-mental curves for 0 – 40% breakthrough (9, 10).
In contrast to the successful application of these theoretical or empirical equations to the breakthrough behavior in respirator cartridges with coconut-based charcoal at constant room temperature, there appears to be relatively little information in the literature concerning the effect of the adsorption temperature on the breakthrough behavior and adsorption kinetics. Therefore, the purpose of this paper is to apply a simple model with two parameters suggested by Yoon and Nelson for modeling the breakthrough curves of HCFC-141b through beds of activated carbon with the consideration of the effect of temperature.
MATERIALS AND METHODS
The laboratory adsorption system has been described previously (3). HCFC-141b vapor, constantly generated from a thermostat impinger apparatus, was diluted with dehumidified dry air for all experiments. Activated carbon from coconut with mesh numbers of 20/30 (average particle diameter of 0.718 mm) (Taipei Chemical Co., Taipei, Taiwan) was dried at 378 K in a vacuum oven for at least 24 h before testing. Its main physical characteristics, as measured by an automatic volumetric analyzer (ASAP 2000, Micromeritics) using ni-Journal of Colloid and Interface Science 214, 455– 458 (1999)
Article ID jcis.1999.6192, available online at http://www.idealibrary.com on
455 0021-9797/99 $30.00
Copyright © 1999 by Academic Press All rights of reproduction in any form reserved.
trogen adsorption at 77 K, are as follows: BET surface area of 994 m2 /g, average pore diameter of 15.6 Å, and total pore volume of 0.508 cm3
/g. The experimental runs were performed at HCFC-141b concentration levels of 399 –1954 ppmv and adsorption temperatures of 283, 293, 298, 303, and 313 K, which were maintained by a refrigerated circulating-water bath (60.1 K accuracy). The feed, consisting of a ca. 2900 cm3
/min gas stream with HCFC-1414b vapor in air, was composed by means of a mass flow controller (Model HCFC, Hastings Co.) and passed through a fixed-bed adsorption column of 1.5-cm inner diameter. The linear (superficial) velocity of 0.27 m/s thus obtained is in the practical range of 0.25– 0.50 m/s (11). In the present study, breakthrough measurements have been made with a constant contact time of ca. 0.15 s based on 2.52 g of activated carbon for all experiments.
A small amount (i.e., 0.1 cm3
) of the effluent sample of HCFC-141b vapor in air was taken into a gas-tight microsyringe at suitable time intervals (i.e., 2–10 min) during breakthrough measurements. The concentrations of HCFC-141b were measured by a gas chromatograph with a flame ionization detector (FID). Analytical instruments and conditions were described previously (3). When the effluent concentration of the adsorbate HCFC-141b reached its specified influent concentration (i.e., 100% of breakthrough), the concentration measurement of the effluent gas was stopped.
As an applicable approximation, the breakthrough analysis is described as follows according to the model of Yoon and Nelson (9). Consider the gas adsorption kinetics in the fixed bed of adsorbent. Some of the adsorbate molecules are adsorbed on adsorption sites and others pass through the adsor-bent bed. Yoon and Nelson (9) introduced Q as the probability for adsorption and P as the probability for breakthrough. The relationship between Q and P is therefore
P5 1 2 Q 5 Cb/Ci, [1]
where Cb and Ci are the breakthrough (effluent) concentration (kg/m3 ) and influent concentration (kg/m3
) of the adsorbate, respectively. Since the rate of adsorption is proportional to the rate of molecular collisions with unoccupied adsorption sites (12), it is reasonably assumed that the rate of change in the breakthrough concentration, dCb/dt, is proportional to Cband to the number of adsorptive sites. Therefore
2dQ/dt 5 k9Q~1 2 Q!, [2]
where k9 is a rate constant (min21). To obtain an explicit expression, the solution of the differential equation [2] is solved by using the integration approach (9).
,n12 Q 5Q k9~t 2 t!, [3] wheret is the time required to obtain 50% breakthrough (i.e., Q 5 0.5). Rearranging Eq. [3], one obtains an expression for the breakthrough (sam-pling) time (t) in terms of the influent concentration (Ci) and the breakthrough concentration (Cb): t5t 11 k9 ,n Cb Ci2 Cb . [4]
According to Eq. [4], the value of k9 can be obtained from the slope of the plot ,n [Cb/(Ci 2 Cb)] versus breakthrough time t, and the value of t (50% breakthrough time) can be determined as the time at Q5 0.5 (i.e., Cb5 Ci/2). Following the determination of k9 andt, one may generate the complete breakthrough curve for a given set of experimental conditions by applying Eq. [4]. Yoon and Nelson (9) further introduced the following relationship:
k5 k9t, [5]
where k is a proportionality constant for a given adsorbate and specified type of adsorbent. They indicated that k is independent of adsorbate concentration and flow rate. On the other hand, both k9 and t are dependent on the concentration of the adsorbate and the flow rate (9).
RESULTS AND DISCUSSION
In this study, the relationship between sampling time (t) and breakthrough fraction (i.e., Cb/Ci) was investigated for each concentration of HCFC-141b at various temperatures. It should be noted that breakthrough fraction is a
FIG. 1. Typical plots of,n[Cb/(Ci2 Cb)] versus sampling time (t) for
HCFC-141b adsorption on activated carbon at 293 K (symbols: experimental data; solid lines: calculated from Eq. [4]).
TABLE 1
Values of the Theoretical Parameters k*, t, and k for Adsorption of HCFC-141b on Activated Carbon at Various Temperatures and Inlet Concentrationsa Concentration (ppmv) Temperature (K) k9 (min21) t (min) k R2 399 283 0.0918 147.7 13.562 0.9932 293 0.1022 131.3 13.414 0.9894 298 0.1076 112.1 12.058 0.9837 303 0.1172 106.5 12.482 0.9944 313 0.1214 84.6 10.270 0.9949 734 283 0.1448 92.1 13.338 0.9883 293 0.1499 80.0 11.995 0.9921 298 0.1526 70.9 10.814 0.9886 303 0.1599 66.9 10.704 0.9965 313 0.1723 56.0 9.642 0.9901 1139 283 0.1933 59.8 11.561 0.9925 293 0.2144 56.3 12.070 0.9874 298 0.2202 52.9 11.659 0.9985 303 0.2253 49.0 11.034 0.9953 313 0.2433 42.9 10.431 0.9926 1954 283 0.2558 39.9 10.218 0.9963 293 0.2770 36.6 10.142 0.9965 298 0.2909 35.5 10.048 0.9689 303 0.3075 33.0 10.160 0.9816 313 0.3444 28.6 9.863 0.9945
aMass of activated carbon used in this study is 2.526 0.01 g.
function of sampling time according to Eq. [4]. A typical illustration of the application of Eq. [4] is depicted in Fig. 1 based on the experimental data of breakthrough for HCFC-141b in the concentration range 399 –1954 ppmv at 293 K. As predicted by the Yoon and Nelson model of Eq. [4], the plots of Fig. 1 yield straight lines with a slope of k9 and intercept of 2k. As shown in Fig. 1, the model appears to fit the experimental data reasonably well. Thus, the rate constant k9 and 50% breakthrough timet can be calculated by fitting a straight line. The least-squares method has been used to give these values as listed in Table 1. The values of k, computed from Eq. [5], are also listed in Table 1. As expected from the Yoon and Nelson model (9, 10), both k9 andt are dependent on the adsorbate inlet concentration. As shown in Table 1, the rate constant k9 increases with increasing adsorbate inlet concentration, whereas the 50% breakthrough timet decreases. Table 1 also presents the values of k9 and t at various adsorption temperatures at adsorbate concentrations of 399 –1954 ppmv. It was found that k9 andt are significantly influenced by the adsorption temperature; i.e., the value of k9 increases with increasing adsorption temper-ature, while the value oft decreases. This is consistent with the results based on the Yoon and Nelson analysis, namely, that the calculated 10% break-through times for several solvents were diminished between 1 and 10% with each 10°C rise in temperature (13). The value of k, on the other hand, seems to be independent of the adsorbate inlet concentration and adsorption temper-ature, as shown in Table 1. It is noted that the preceding results concerning the concentration effects were consistent with those of Yoon and Nelson’s exper-iments (9, 10). The mean and standard deviation values of k were thus determined to be 11.273 and 1.249, respectively.
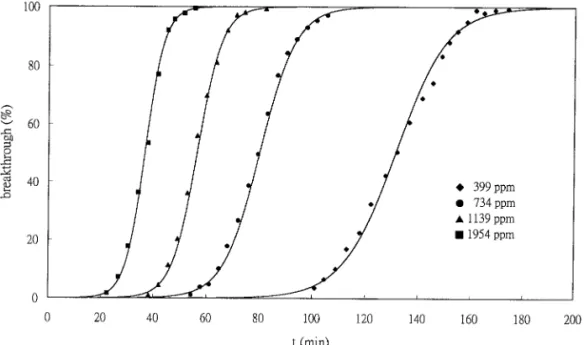
Following the determination of the values of k9 and t, the complete breakthrough curves can be generated for a given set of experimental condi-tions by substituting the determined values of k9 andt (Table 1) into Eq. [4]. The calculated theoretical curves are compared with the corresponding exper-imental data in Fig. 2. It is demonstrated that the agreement between the Yoon and Nelson model and the experimental data is high in the present study. This is reasonable if one notes that the solid lines in Fig. 1 represent the lines of best fit, which have good correlation (R2
5 0.97–0.99, as shown in Table 1). Using the Arrhenius relationship as follows (14), one may examine the effect of adsorption temperature (T) on the rate constant (k9).
,n k9 5 2E/~RT! 1 ,n k0, [6]
where k0is a constant (min21), E is the activation energy (J/mol), R is the ideal
gas law constant (58.314 J/(mol K)), and T is the adsorption temperature (K). A plot of,n k9 versus 1/T resulted in a straight line with a slope of 2E/R and an intercept of,n k0. Figure 3 presents the Arrhenius plots of the rate constant k9 versus the adsorption temperature T for the adsorption of HCFC-141b on activated carbon. In all cases, reasonably good linear plots were obtained with correlation coefficients (R2
) of 0.9648, 0.9351, 0.9849, and 0.9846 for the adsorbate concentrations of 399, 754, 1139, and 1954 ppmv, respectively, while the activation energies obtained from the kinetic analysis were 7.21, 4.28, 5.46, and 7.31 kJ/ mol, respectively. As expected, the mean value and standard deviation (i.e., 6.076 1.46 kJ/ mol ) of the activation energy of adsorption calculated on the basis of adsorption rate constant k9 at five temperatures is low compared with the value of the latent heat of vaporization (i.e., 26.03 kJ/mol ) of HCFC-141b. This indicates that the adsorption mech-anism seems to be predominantly physical in nature in the case of activated carbon.
FIG. 2. Typical breakthrough curves of HCFC-141b adsorption on activated carbon at various concentrations and 293 K (symbols: experimental data; solid lines: calculated from Eq. [4]).
FIG. 3. Arrhenius plots of rate constant (k9) at various adsorbate concen-trations of 399, 734, 1139, and 1954 ppmv for HCFC-141b adsorption on activated carbon. R25 0.9648, 0.9351, 0.9849, and 0.9846, respectively.
457
NOTECONCLUSIONS
From the experimental results and data regression, a simple two-parameter (i.e., k9 andt) model proposed by Yoon and Nelson provided good correlation of the effects of HCFC-141b vapor concentration and adsorption temperature on breakthrough curves of adsorption through an activated carbon column. The parameters calculated from fits of the experimental data with the model were used to generate theoretical breakthrough curves. The calculated theoretical breakthrough curves agree with the corresponding experimental data. It was also found that the rate constant k9 can be reasonably fitted by the Arrhenius equation.
ACKNOWLEDGMENTS
The authors acknowledge the financial support of the National Science Council of Taiwan for this project (Contract No. NSC 86-2211-E-041-003).
REFERENCES
1. Schanffler, S. M., Pollock, W. H., Atlas, E. L., Heidt, L. E., and Daniel, J. S., Geophys. Res. Lett. 22, 819 (1995).
2. Hayman, G. D., and Derwent, R. G., Environ. Sci. Technol. 31, 327 (1997).
3. Tsai, W. T., Chang, C. Y., and Ho, C. Y., Adsorp. Sci. Technol. 16, 67 (1998).
4. Graham, J. R., and Ramaratnam, M., Chem. Eng. 100 (Suppl. 2), 6 (1993). 5. Yang, R. T., “Gas Separation by Adsorption Processes.” Butterworths,
Stoneham, MA, 1987.
6. Wood, G. O., Am. Ind. Hyg. Assoc. J. 48, 703 (1987).
7. Wheeler, A., and Robell, A., J. Catal. 13, 299 (1969). 8. Klotz, I. M., Chem. Rev. 39, 241 (1946).
9. Yoon, Y. H., and Nelson, J. H., Am. Ind. Hyg. Assoc. J. 45, 509 (1984). 10. Yoon, Y. H., and Nelson, J. H., Am. Ind. Hyg. Assoc. J. 45, 517 (1984). 11. Parmele, C. S., O’Connell, W. L., and Basdekis, H. S., Chem. Eng. 86(12),
58 (1979).
12. Adamson, A. W., “Physical Chemistry of Surfaces,” 5th ed. Wiley, New York, 1990.
13. Yoon, Y. H., and Nelson, J. H., Am. Ind. Hyg. Assoc. J. 35, 514 (1976). 14. Smith, J. M., “Chemical Engineering Kinetics,” 3rd ed. McGraw-Hill,
New York, 1981.
W. T. Tsai* C. Y. Chang†,1 C. Y. Ho† L. Y. Chen† *Department of Environmental Engineering and Health
Chia Nan College of Pharmacy and Science Tainan 717, Taiwan
†Graduate Institute of Environmental Engineering National Taiwan University
71 Chou-Shan Road Taipei 106, Taiwan
Received November 30, 1998; accepted February 25, 1999
1
To whom correspondence should be addressed. E-mail: cychang3@ ccms.ntu.edu.tw.