國
立
交
通
大
學
資訊科學與工程研究所
碩
士
論
文
排 球 影 片 攻 擊 及 攔 網 事 件 之 偵 測 與 分 析
Spiking and Blocking Events Detection and Analysis
in Volleyball Videos
研 究 生:許雋杰
指導教授:李素瑛 教授
i
排球影片攻擊及攔網事件之偵測與分析
研究生:許雋杰
指導老師:李素瑛 教授
國立交通大學資訊科學與工程研究所
摘 要
由於多媒體擷取設備的蓬勃發展,產生了大量的運動影片。對一般的觀眾而 言,只有比賽中的一部分精華事件能引起他們的注意。而教練及球員則希望能夠 針對比賽做戰術分析,像是對手所使用的攻擊戰術和防守策略等。在此篇論文中, 我們提出了一個方法,能夠在排球影片中偵測攻擊及攔網事件,並且對攔網的型 態做分析。首先我們對影片做前置處理,像是利用哨音偵測將影片切成一段一段 連續對打的過程。接著找出球場及網子,進一步找出攻擊及攔網所發生的位置。 然後我們分析網子內移動像素的改變,並且將攔網的區域框出來。而根據攔網區 域的寬度,我們將攔網的型態分成兩種類別,無人攔網或一人攔網,以及兩人或 三人攔網。最後我們可以利用攻擊事件發生的時間以及攔網的位置來做戰術上的 分析,例如時間差及位置差的戰術。而我們的實驗結果顯示出我們提出的方法之 有效性及正確性。 關鍵字:排球影片、攻擊事件、攔網事件、戰術分析、運動影片分析、影像處理ii
Spiking and Blocking Events Detection and Analysis
in Volleyball Videos
Student: Chun-Chieh Hsu Advisor: Prof. Suh-Yin Lee
Department of Computer Science, National Chiao Tung University
Abstract
With the explosive proliferation of multimedia capturing devices, a considerable amount of sports videos have been recorded. For general viewers, only portions of games related to specific topics attract their attention. Coaches and professional players are interested in the high level semantics of events in the tactic perspective, such as the attack and defense tactics executed by opponents. In this thesis, we propose an approach for spiking events detection and blocking pattern classification for real volleyball videos. First, we perform video pre-processing such as whistle detection to segment the entire videos into video clips for rallies. Second, the camera calibration is performed to find the court region. To discover the positions of spiking and blocking, we further detect the location of net. Then, the changes of moving pixels are analyzed along the net. A bounding box is made around the blocking location, and we classify the blocking patterns into two main categories based on the width of bounding box. Finally, tactics analysis is made to discriminate two important tactics in volleyball matches: delayed spiking and alternate position spiking. With the
iii
information of spiking events and blocking locations, we can collect the statistical data and make tactics inference easily. The experimental results on the videos recorded by NCTU school volleyball team are promising and demonstrate the effectiveness of our proposed scheme.
Keyword: volleyball video, spiking event, blocking event, tactic analysis, sports video analysis, image processing
iv
Acknowledgment
I greatly appreciate the kind guidance of my advisor, Prof. Suh-Yin Lee. She also gives sincere help whenever I am upset or in trouble. I could not complete this thesis without her graceful suggestion and encouragement.
Besides, I want to give my thanks to my friends and all members in the Multimedia Information System Laboratory for suggestion and instruction, especially Mr. Hua-Tsung Chen and Mr. Chien-Li Chou.
Finally, I would like to express my appreciation to my parents for their supports and consideration. This thesis is dedicated to them.
v
Table of Contents
Abstract (in Chinese) ... i
Abstract ... ii
Acknowledgment ... iv
Table of Contents ... v
List of Figures ... vii
List of Tables ... ix
Chapter 1. Introduction ... 1
Chapter 2. Related Work ... 7
2.1 Camera Calibration ... 7 2.2 Ball/Player Tracking ... 8 2.2.1 Ball Tracking ... 8 2.2.2 Player Tracking ... 9 2.3 Highlight Extraction... 10 2.4 Tactics Analysis ... 11
2.5 Applications in Volleyball Videos ... 12
Chapter 3. Proposed Framework... 14
3.1 Overview of the Proposed Framework ... 14
3.2 Audio Event Detection ... 16
3.2.1 Whistle Detection ... 16
3.3 Camera Calibration ... 17
3.3.1 Court Line Pixel Detection ... 19
3.3.2 Feature Line Extraction... 22
3.3.3 Projection Matrix Computation ... 23
3.3.4 Net Recognition ... 24
3.4 Spiking Event Detection ... 26
3.4.1 Jump Moment Extraction ... 27
3.5 Blocking Event Detection ... 31
3.5.1 Blocking Location Detection ... 31
3.5.1.1 Key Frame of Spiking Event ... 32
3.5.2 Blocking Pattern Classification ... 33
3.6 Tactic Analysis ... 35
Chapter 4. Experimental Results... 37
vi
4.2 Experimental Results of Blocking Pattern Classification ... 42
4.3 Tactic Analysis ... 43
Chapter 5. Conclusion and Future Work ... 44
vii
List of Figures
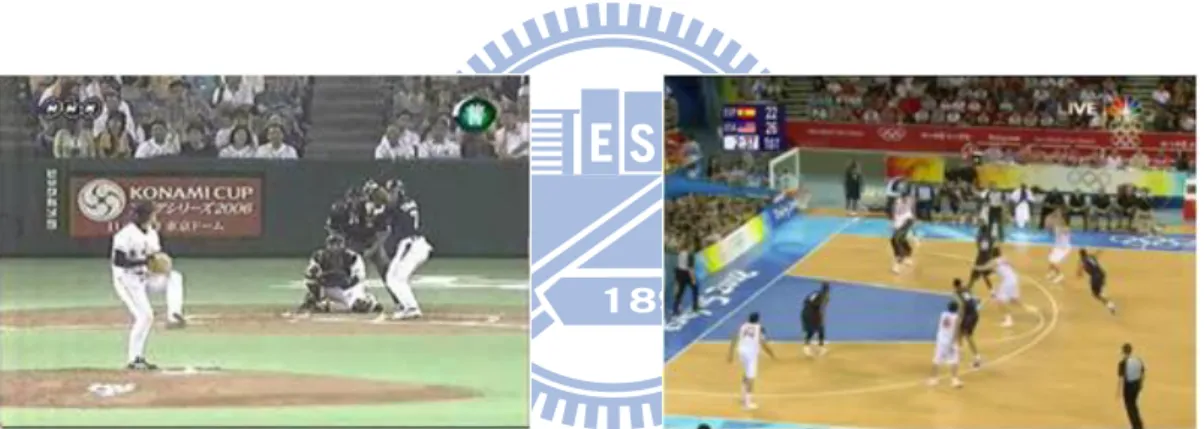
Fig. 1-1. Examples of broadcast videos. ... 2
Fig. 1-2. Videos recorded by coaches, players, or even the audiences. ... 3
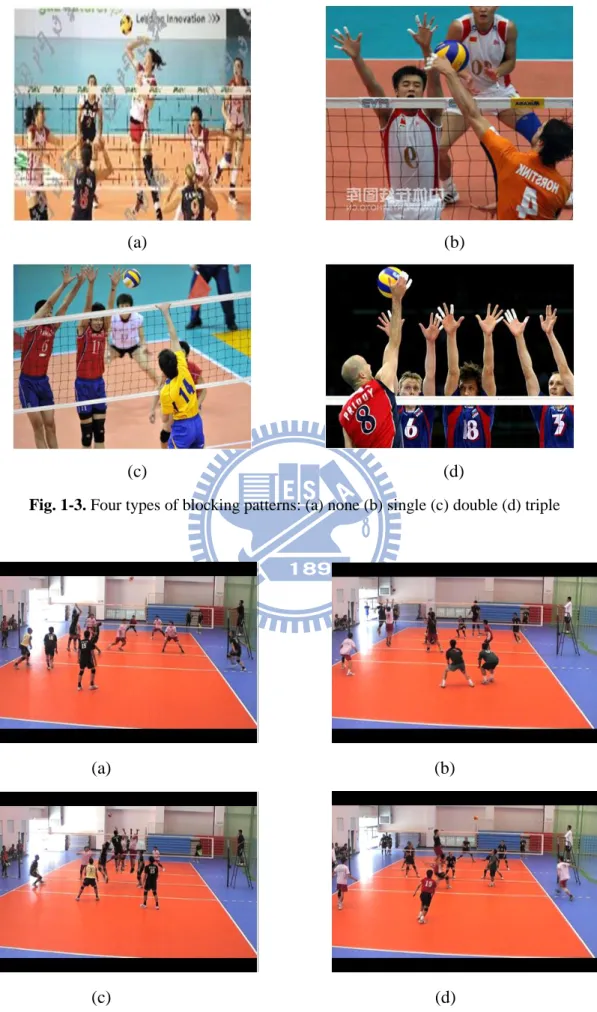
Fig. 1-3. Four types of blocking patterns: (a) none (b) single (c) double (d) triple ... 5
Fig. 1-4. Two important tactics: (a)(b) alternate position spiking (c)(d) delayed spiking ... 5
Fig. 2-1 Ball trajectories in Y-direction and X-direction. ... 12
Fig. 2-2 The basic actions of players. (a) serve (b) reception (c) set (d) attack ... 13
Fig. 2-3 Set type recognition. ... 13
Fig. 3-1. The proposed framework. ... 15
Fig. 3-2. Systematic flow of camera calibration. ... 18
Fig. 3-3. Schematic, magnified view of part of an input image containing a court line [7]. ... 19
Fig. 3- 4. Sample results of white line pixel detection and Hough transform. ... 21
Fig. 3-5. Four sides of the lower half court. ... 23
Fig. 3-6. Sample results of court detection ... 24
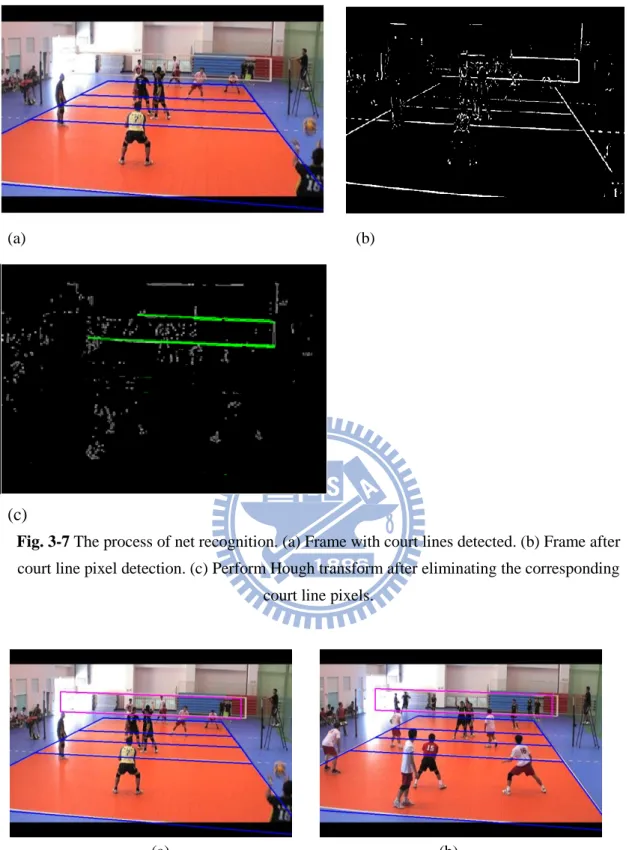
Fig. 3-7 The process of net recognition. (a) Frame with court lines detected. (b) Frame after court line pixel detection. (c) Perform Hough transform after eliminating the corresponding court line pixels. ... 25
Fig. 3-8. Sample results of net detection. (a) Match 1. (b) Match 2. ... 25
Fig. 3-9. Tha analyzed area. (a) Match 1. (b) Match 2. ... 26
Fig. 3-10. Flowchart of spiking and blocking events detection. ... 26
Fig. 3-11. Examples of frame difference images (FDI). ... 28
Fig. 3-12. Continuous changes in sum of moving pixels within each rally. ... 29
Fig. 3-13. The results of jump moment extraction. ... 30
Fig. 3-14. Distribution of the amount of moving pixels along the horizontal restricted area. ... 31
Fig. 3-15. The results of blocking location detection. ... 32
Fig. 3-16. Some examples of two classes. (a) none (b) cloak (c) double (d) triple ... 34
Fig. 3-17. An example of delayed spiking. ... 36
Fig. 3-18. An example of alternate position spiking. ... 36
Fig. 4-1. Examples of detected spiking events ... 38
Fig. 4-2. Examples of false and miss situation. (a) ball (b) jump serve (c) cloak (d) far-net-toss spiking ... 41
viii
ix
List of Tables
Table 4.1: Configuration of spiking event detection. ... 38
Table 4.2: Configuration of blocking pattern classification. ... 39
Table 4.3: Performance of spiking event detection. ... 39
Table 4.4: The result of blocking pattern classification. ... 42
1
Chapter 1. Introduction
With the rapid development of multimedia capturing devices, it becomes easier for people to record their lives. A large amount of multimedia data, such as images and videos are produced and uploaded to the internet. Therefore, analyzing and understanding automatically the complex and compound multimedia data becomes an important issue. Sports video is one of the most popular multimedia data since sports games hold a lot of audiences worldwide. In recent years, sports videos analysis is a flourishing research area. There has been an explosive growth of researches focusing on analyzing sports videos due to the potential commercial benefits and entertainment demands. From a sports-watcher point of view, only some portions in a sports video are worth viewing. These video segments of interest are the semantic events which have certain high-level semantics, such as homeruns in baseball games and goals in soccer games. Various efforts are made for event detection, content understanding, and sports information retrieval, in order to provide the viewers with automatic annotation and enriched visual presentation. Therefore, algorithms have been developed for shot classification, highlight extraction and semantic annotation based on the fusion of audiovisual features and the game-specific rules. In this thesis, we focus on audio and visual features integration and algorithm development for sports video content analysis and understanding. Sports information retrieval, tactics analysis, enriched visual presentation can provide the audience and professionals a further insight into the games.
Generally, sports videos can be roughly classified into two categories [11]: real videos and broadcast videos. Real videos are captured by a single or several fixed cameras. In real videos, the camera is stationary and the background is almost static.
2
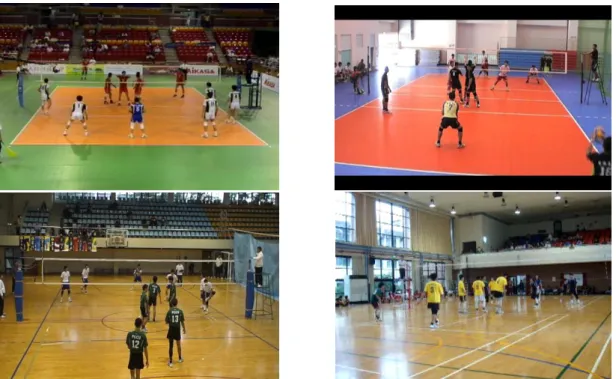
Broadcast videos are obtained from television programs while broadcasting the games. In broadcast videos, the camera motions are inevitable, as shown in Fig. 1-1. The background is usually changing since the cameras always focus on the ball or the moving players. More and more researches are devoted to broadcast videos such as soccer, baseball, and basketball because of the potential commercial benefits and massive audiences. Unlike the sport mentioned above, volleyball games are not so popular since there are only a few channels broadcasting the volleyball games. On the contrary, there are plenty of videos recorded by coaches, players, or even the audiences with a fixed digital camera since the volleyball courts are relatively small so that the scenes can be seen clearly by only one camera, as shown in Fig. 1-2.
3
Fig. 1-2. Videos recorded by coaches, players, or even the audiences.
By recording the volleyball matches, the audiences can enjoy watching the matches they are interested in, and the coaches and professional players can obtain the statistical information about opponent teams‟ and themselves. For the audience, they usually pay their attention to the exciting events, such as splendid spikings and wonderful digs, since it may take a long time to watch the entire matches. It is a trend to design automatic systems for content-based video retrieval and semantic analysis in order to display such selective events and shots. From the coaches‟ and the professional players‟ points of view, analyzing the tactic patterns executed by the opponent teams can help them work out corresponding strategies in the training process or even in the matches. However, it is time-consuming and labor-intensive to manually recognize the tactic patterns and collect the statistical data from a large amount of sport videos. Consequently, establishing a system which can automatically provide tactic patterns recognition and semantic event extraction is required.
4
by a net. Each team tries to score points by grounding a ball on the other team's court under organized rules [15]. In volleyball matches, spiking is the most direct and effective way to get points and it is always the most exciting part in the games. On the other hand, blocking can prevent opponents from getting scores by spiking, and even get points with successful blocking, which means grounding the spiking ball back on the opponents‟ court. The blocking patterns can be classified into four types based on the number of people included: none, single, double, and triple blockings, as shown in Fig. 1-3. The more people participate in blocking, the higher probabilities of successful blocking would make. In addition, marvelous spiking such as delayed spiking and alternate position spiking always results from brilliant set which leads to none or only single blocking, as examples are shown in Fig. 1-4. Delayed spiking utilizes close time and positions between the jumps of two spikers to confuse the blockers. And alternate position spiking avoids too many blockers by making a wide set. Both two tactics need a cloak, which means a player pretends to spike. In other words, the type of set plays an important role in tactics analysis. For this reason, classifying the blocking patterns can help the coaches analyze the successful tactics used by the setters. Therefore, our goal is to propose a system which not only provides specific spiking events detection but also classifies the blocking patterns for the spiking events.
5
(a) (b)
(c) (d)
Fig. 1-3. Four types of blocking patterns: (a) none (b) single (c) double (d) triple
(a) (b)
(c) (d)
6
Although increasing research effort of sports video processing concentrates on ball tracking and trajectory-based tactics analysis, the majority of existing work focuses on tennis and soccer video. Little work was done for volleyball video because it is much complex to track the ball and players in volleyball video due to the high density of players on the court and the frequent ball-player overlaps. In this thesis, we propose a scheme for detecting spiking events and simultaneously classifying blocking patterns by analyzing the moving pixels.
In the proposed scheme, we first determine the play boundary for rallies by conducting whistle detection. Taking the output video clips as input data, we then perform the camera calibration to find the correspondence between the image court model and the real world court model. And with the camera calibration, we further detect the location of net. Since the spiking events take place above the net, we analyze the moving pixels above the net and detect the spiking events. After detecting the spiking events, we further analyze the blocking patterns when the spiking occurs. The proposed scheme enhances the accuracy of the subsequent analysis by preprocessing the video clips. A moving pixels analysis based algorithm is designed for easily computing and efficiently analyzing the blocking patterns.
The remaining of this thesis is organized as follows. In Chapter 2, we introduce the related work about sports videos analysis. Chapter 3 describes the methods we proposed. The experimental results are presented and discussed in Chapter 4. Finally, we make conclusions and discuss future work in Chapter 5.
7
Chapter 2. Related Work
In this chapter, we introduce the methods for camera calibration, ball/player tracking, highlight extraction, and tactics analysis, and then show some recent researches on volleyball video analysis.
2.1 Camera Calibration
For semantic analysis, we need to find the correspondence between real-world coordinates and coordinates in the video frame. Various camera calibration algorithms are based on planar reference objects [6, 7]. Feature points on a plane appearing in different views are required for these plane-based calibration techniques. Farin et al. [6, 7] propose a camera calibration algorithm for sports videos using court model. The algorithm begins with a model initialization step. The court line pixels are identified by utilizing the constraints of color and local texture, and then Hough transform is performed to extract the court lines. The intersection points of the court lines are extracted as the feature points to compute the camera projection matrix. For the subsequent frames, an abbreviated calibration algorithm is used to predict the camera parameter from the previous frames. Yu et al. [19] propose a frame grouping technique according to the camera viewpoints. A group-wise data analysis is performed to obtain a more stable estimation of the camera parameters. To minimize the reprojection disparity, a Hough-like search is employed.
8
2.2 Ball/Player Tracking
In reality, significant events are mainly resulted from ball-player and player-player interaction. For this reason, balls and players are the most frequently tracked objects in sports video.
2.2.1 Ball Tracking
Yu et al. [21] present a trajectory-based algorithm for ball detection and tracking in soccer video. To detect ball candidates, the ball size is estimated from feature objects, such as goalmouth and ellipse. Potential trajectories are generated from ball candidates by a Kalman filter based verification procedure. The true ball trajectories are finally selected from the potential trajectories according to a confidence index. Chen et al. [1, 2] propose a physics-based algorithm for ball tracking. In [4], ball tracking and 3D trajectory reconstruction in basketball videos and shooting location statistics can be obtained. The proposed scheme incorporates domain knowledge and physical characteristics of ball motion into object tracking to overcome the problem of 2D-to-3D inference. A trajectory-based ball tracking framework for broadcast baseball videos is proposed in [1]. The physical characteristic of ball motion is utilized for automatic ball tracking and pitching evaluation. The characteristic that ball trajectory presents in a near parabolic curve in video frames is exploited in ball position prediction and trajectory extraction.
9
2.2.2 Player Tracking
Soudeh et al. [13] present a novel approach for tracking the ball and players for indoor soccer games. To begin with, the ground lines are segmented and eliminated. Then, the remaining non-field pixels are considered and labeled as players and the ball. To track players and the ball, a fast level set contour is used. The proposed method can solve the problem of occlusion. Pallavi et al. [11] propose a graph-based approach for detecting and tracking multiple players in broadcast soccer videos. First, they remove the non player regions to determine the position of each player in each frame. Then a region growing algorithm is used to group the remaining pixels for the purpose of identifying probable player candidates. A directed weighted graph is constructed, where the nodes represent probable player candidates and each edge links two candidates in two consecutive frames. Finally, dynamic programming is applied to find the trajectory of each player. Liu et al. [10] present a scheme to perform automatic multiple player detection, unsupervised labeling and efficient tracking in broadcast soccer videos. Player detection is achieved by combining the dominant color based background subtraction and a boosting detector with Haar features. They then collect hundreds of player samples with the player detector, and learn the codebook based player appearance model by unsupervised clustering algorithm. Then multiple players tracking with Markov chain Monte Carlo (MCMC) data association is performed based on detection and labeling.
10
2.3 Highlight Extraction
Xiong et al. [18] propose to use a visual object detection algorithm and an audio classification algorithm to find semantic objects in video frames and audio track for sports highlights extraction. Cheng et al. [3] extract baseball highlights based on audio-motion integrated cues. They propose a novel representation method based on likelihood models to better describe different audio and motion characteristics in baseball game. A hidden Markov model (HMM) is applied to model and detect the transition of the integrated representation for highlight segments. Yang et al. [22] propose a method for highlight extraction based on goal-mouth detection since the appearance of goal-mouth points to a high likelihood of exciting actions in soccer videos. Su et al. [12] present a real-time highlight extraction system based on a model-indexing decision approach in baseball games. The system contains caption extraction, caption identification, content recognition and model-indexing decision. Song et al. [14] fuse multi-modal features including audio and visual for highlight extraction in sports video Slow-motion replay is detected as visual features and audience cheers are audio features. They fuse audio-visual features to detect highlight events through using a special “and” operation.
11
2.4 Tactics Analysis
Chang et al. [5] design a Wild-Open Warning (WOW) system to help basketball coaches and players in revealing possible tactics of their opponents. The proposed system can automatically extract semantic objects such as the court and the players in the video, and calibrate the players‟ positions to real-world court coordinates. While the position of an offensive player satisfies three predefined criteria, wild-open warning is provided. Hu et al. [8] develop a quadrangle candidate generation algorithm and refine the model fitting score to ameliorate the court-based camera calibration technique to be applicable to broadcast basketball videos. A CamShift-based tracking method is used to extract player trajectories. And with the calibrated results, player trajectories can be mapped to the real-world court coordinates. Further analysis such as detecting wide open event, retrieving target video clips based on trajectories, and inferring implicit/explicit tactics can be made with the player position and trajectory information in the court coordinate. Zhu et al. [24] propose a novel approach to extract tactic information from the attack events in broadcast soccer video. The attack events are extracted by using the analysis and alignment of web-casting text and broadcast video. Two tactic representations, aggregate trajectory and play region sequence are constructed. Then a weighted graph is constructed via the analysis of temporal-spatial interaction among the players and the ball. A hierarchical coarse-to-fine framework is provided for discovering the tactic patterns.
12
2.5 Applications in Volleyball Videos
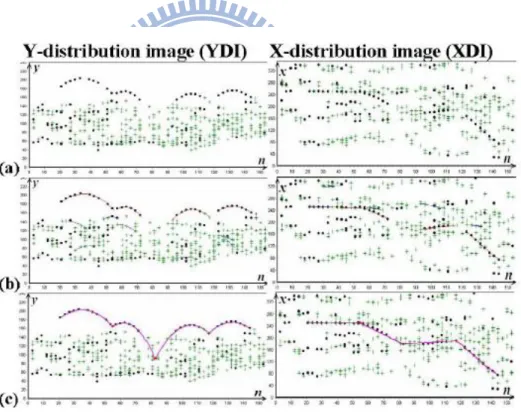
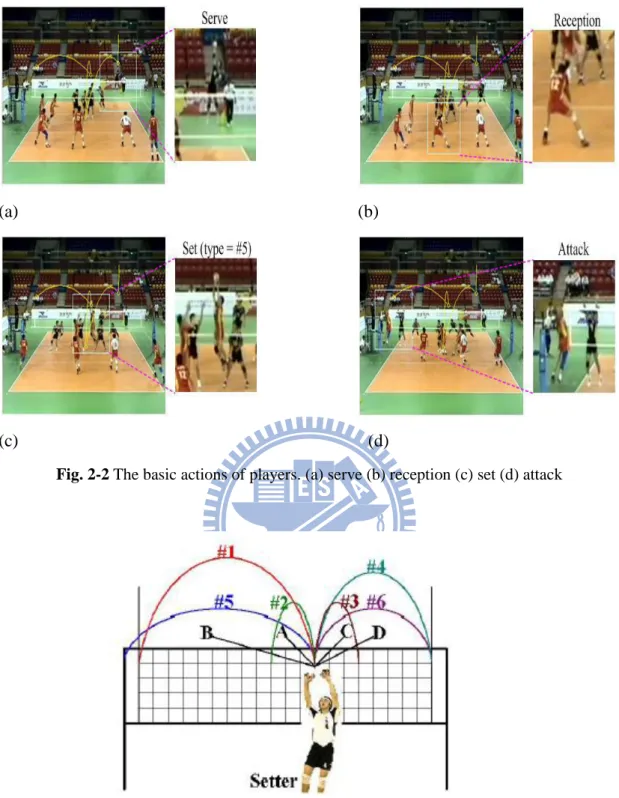
Chen et al. [2] present a physics-based scheme for ball detection and trajectory extraction in volleyball videos. In volleyball game, players are not allowed to hold the ball so that the ball trajectories almost show in parabolic curves. A 2D distribution analysis is proposed using the physical characteristic that the ball moves parabolically in Y-direction and straight in X-direction as time goes on, as shown in Fig. 2-1. The basic actions of players can be detected at the transitions of the ball trajectory, as shown in Fig. 2-2. And a set type can be recognized by the set curve, as shown in Fig. 2-3.
13 (a) (b)
(c) (d)
Fig. 2-2 The basic actions of players. (a) serve (b) reception (c) set (d) attack
Fig. 2-3 Set type recognition.
Although attack events can be detected based on ball trajectory in this work, it only detects the player who really spiked. The cloak is not detected in this work. In fact, further tactic analysis needs detecting the cloak since executing tactics requires interaction between players.
14
Chapter 3. Proposed Framework
In this chapter, we illustrate our proposed framework in details. To begin with, an overview will be given in Section 3.1. In Section 3.2, the audio events detection is described. Next, the camera calibration we used for court and net modeling is explained in Section 3.3. Our approaches for spiking events detection and blocking patterns classification are illustrated in section 3.4 and section 3.5. Finally, we make some tactics analysis in Section 3.6.
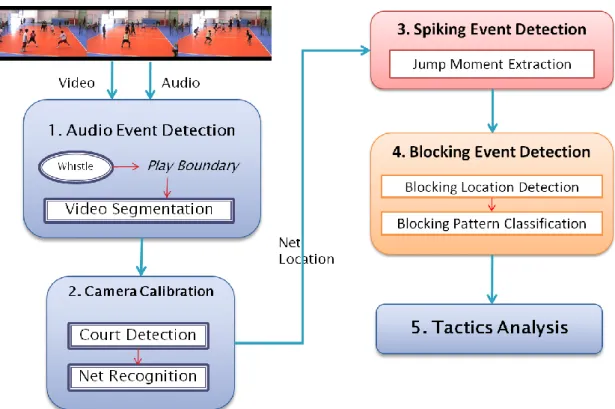
3.1 Overview of the Proposed Framework
Our goal is to detect the spiking events and to classify the blocking patterns. In our proposed framework, both visual and audio features are used for semantic events detection. In addition, we not only highlight the spiking events for the audiences, but also classify the blocking patterns while spiking. Consequently, the proposed framework can provide the highlight scenes for the audience and tactic analysis for the professional users.
In volleyball videos, it is exhausted and time-consuming to analyze the whole videos since only some portions in the plays are worth watching. Thus, we perform video pre-processing to divide the entire videos into video clips. The start and end of each rally must be determined by whistle in the volleyball matches. Whistle is one of the most indicative audio events for segmenting volleyball games. As a result, we start with whistle detection to determine the play boundaries for rallies.
15
For the extracted video clips, we need to find the correspondence between the court in the video and the real world court. The camera calibration is performed to find the court region. Actually, spiking and blocking events occurred above the top of net. Therefore, we further detect the location of net. Then we analyze the changes of moving pixels along the horizontal net, to mine the patterns of spiking and blocking. With the spiking events and blocking locations, we can analyze the patterns of two important tactics in volleyball matches. The proposed framework is illustrated in Fig. 3-1.
16
3.2 Audio Event Detection
Not all significant semantic events, such as whistle, can be detected by only using visual features. Thus, audio features are also considered for detecting significant semantic events.
3.2.1 Whistle Detection
Volleyball matches can be divided into rallies by whistle. For whistle detection, ZCR (Zero Crossing Rate) is an effective and easy-to-calculate feature for distinguishing the audio signals [16, 17]. A zero crossing occurs when successive samples of discrete-time signals have different algebraic signs. ZCR counts the number of times an audio signal crosses its zero axis, as defined in Eq. (3-1) [25]:
(3-1) where
s(k) : discrete time audio signal;
n : time index of the zero crossing rate; w(k): rectangle window of length Nz ;
(3-2)
The frequency of whistle is higher than other signals in the matches, so a peak can be found in ZCR when the referee is blowing the whistle. The duration of a whistle is about 200 to 800 ms by observation, so the widow length NZ is set to the average, 500
17
between a time duration of α times the window length (α x NZ, α=10) is computed,
and then the peak index is defined as the difference between the ZCR of each window and the mean ZCR. Finally, the whistle is decided by a certain threshold. After the detection of the whistles, the entire volleyball matches can be divided into several video clips, and each video clip contains a rally.
3.3 Camera Calibration
The object positions are semantically important because the object movement or location tell much about the current action. For further analysis, it is required to obtain the positions of objects on the court in the world. Camera calibration converts the coordinates in the video frame to real-world coordinates or vice versa [6, 7].
Since volleyball courts can be assumed to be planar, camera calibration describes a plane-to-plane mapping (a homography) H mapping from a position p in the world coordinates to the image coordinates p‟. Writing positions as homogeneous coordinates p = (x, y, 1) and p‟ = (u, v, 1), the transformation Hp = p‟ is defined in Eq. (3-3). (3-3)
This is an eight-parameter perspective transformation. At least four point-correspondences between the position in image plane and the world coordinates are required to obtain the homography matrix. The volleyball court does not have obvious point features. In fact, the detection of lines is more robust than locating the
18
accurate positions of specific points. For this reason, the intersections of lines are utilized to establish point-correspondence.
Fig. 3-2 depicts the systematic flow of camera calibration. We start with detecting the white line pixels by the constraints of color and local texture. To extract the court lines, the Hough transform is applied to the detected white line pixels. Thus, the straight lines such as court lines can be obtained. Then, the intersection points of court lines are calculated. With the corresponding points, the transformation can be obtained and the camera parameters can be then derived. The location of net can be further recognized by vanishing points theorem. The calibration is only calculated at the beginning of the videos, since the camera is fixed and the background is almost the same in the whole game.
19
3.3.1 Court Line Pixel Detection
The court lines are always in white color for visual clarity. Unfortunately, there may be other white objects in the images such as parts of the stadium and the uniforms of the players. If all white pixels were considered, the subsequent line detection using Hough transform would produce too many candidates, making the calculating process time-consuming and error-prone. Hence, additional constraints should be applied to the white pixels [7].
Fig. 3-3. Schematic, magnified view of part of an input image containing a court line [7].
Assuming that court lines are typically not wider than τ pixels (τ = 6 in our framework), we check whether the brightness at a distance of τ pixels from four sides of the candidate pixel is considerably darker than the candidate pixel, as shown in Fig. 3-3 . The candidate pixel is only classified as court line pixel if both pixels marked „H‟ or both pixels marked „V‟ are darker than the candidate pixel. As a result, the white line pixels are classified as court line candidates according to Eq. (3- 4).
20 (3-4)
In Eq. (3-4), (x, y) indicates if a pixel (x, y) is a court line candidate ( (x, y) = 1) or not ( (x, y) = 0), g(x, y) means the luminance of a pixel at position (x, y), and σd is
the luminance threshold. The first line in the equation corresponds to the test if darker pixels can be found at some horizontal distance, assuming that the court line is mostly vertical. The second line performs the analogous test in the vertical direction, assuming the court line is almost horizontal. This process prevents most of the pixels in white regions or white uniforms being detected as white line pixels, as shown in Fig. 3- 4(a) (b).
21
(a) Original frame
(b) After white line pixel detection
(c) After Hough transform
Fig. 3- 4. Sample results of white line pixel detection and Hough transform.
To improve the accuracy and efficiency of the subsequent Hough transform for line detection, the line-structure constraint [7] is applied to exclude the white pixels in finely textured regions. The structure matrix S[9] computed over a small window of size 2b+1 (b= 2 in our case) around each candidate pixel (px, py), as defined in Eq.
(3-5), is used to recognize texture regions.
22
Depending on the two eigenvalues of matrix S, called λ1 and λ2 (λ1 ≥ λ2), the texture can be classified into textured (λ1, λ2 are large), linear (λ1 » λ2) and flat (λ1, λ2 are small). On the straight court lines, the linear case will apply to retain the white pixels only if λ1 > αλ2. Most linear cases can be recognized when α = 4 in our experiments.
3.3.2 Feature Line Extraction
A standard Hough transform is performed on the detected white line candidate pixels to extract the court lines, as shown in Fig. 3-4(c). The parameter space (θ, d) is used to represent the line, where θ is the angle between the line normal and the horizontal axis, and d is the distance of the line to the origin. For all (θ, d), an accumulator matrix is constructed and sampled at a resolution of one degree for θ and one pixel for d. Line candidates can be determined by extracting the local maxima in the accumulator matrix, since a line in (x, y) space corresponds to a point in (θ, d) space.
23
3.3.3 Projection Matrix Computation
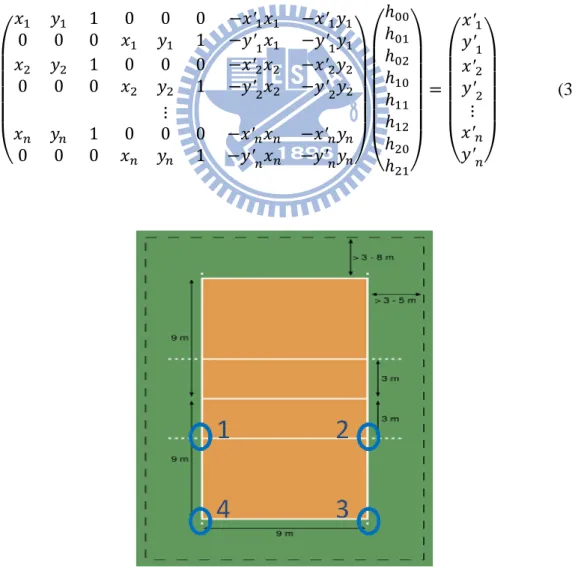
By adopting the algorithm of finding line-correspondence [7], the court line intersections on the court plane can be obtained and it is effective in 2D-to-2D court model mapping. We calculate the intersection points and solve the equation system defined as Eq. (3-6), which is rewritten from Eq. (3-3). Note that this makes use of the normalization h22 = 1. There are eight variables h00, h01, …, h21 so we need at least
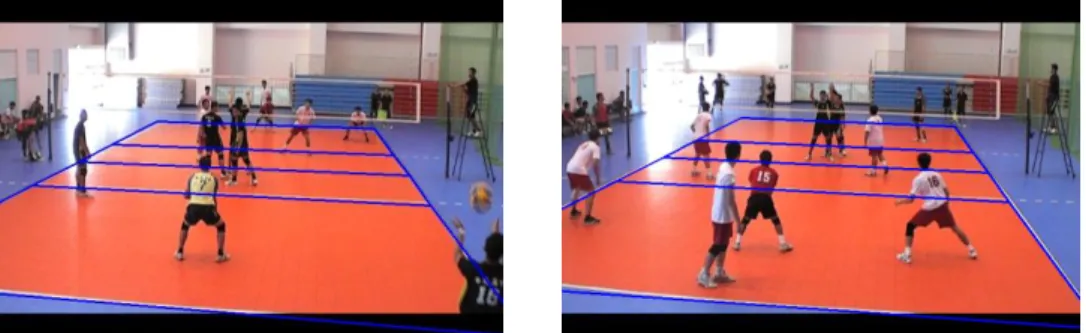
four points (n≥4) in order to form more than eight equations.Here we use the four sides of the lower half court to solve the equation system, as shown in Fig. 3-5. A sample result is presented in Fig. 3-6.
(3-6)
24
Fig. 3-6. Sample results of court detection
3.3.4 Net Recognition
In order to detect the spiking events and classify the blocking patterns, the location of net is essential. In section 3.3.3, we have detected the court lines in video frames, as shown in Fig. 3-7 (a). We eliminate the corresponding court line pixels in the result of court line pixel detection, as shown in Fig. 3-7(b). Besides, for simplicity, we draw two vertical segments above the center line as the two vertical makers of net. Then, Hough transform is performed on the area between two vertical lines above the center line, as shown in Fig. 3-7(c). The detected two nearly horizontal lines are regarded as two horizontal markers of net. Fig. 3-8 shows two detection results at slightly different angles of nets in two matches.
25
(a) (b)
(c)
Fig. 3-7 The process of net recognition. (a) Frame with court lines detected. (b) Frame after
court line pixel detection. (c) Perform Hough transform after eliminating the corresponding court line pixels.
(a) (b)
26
3.4 Spiking Event Detection
After detecting the location of net, further analysis can be made. Since the spiking and blocking events occurred above the upper horizontal marker of net, the area to be analyzed should be moved higher than net. For example, we move area of the net to the higher location in our experiment. Fig. 3-9 shows two analyzed areas at slightly different angles of nets in two matches. In fact, blocking always accompanies spiking. For this reason, in order to classify the blocking patterns, the spiking events should be extracted first. The flowchart of spiking and blocking events detection is presented in Fig. 3-10.
(a) (b)
Fig. 3-9. Tha analyzed area. (a) Match 1. (b) Match 2.
27
3.4.1 Jump Moment Extraction
Moving pixels analysis is used to detect the spiking events and only the area mentioned above is considered. Frame difference method is applied to moving pixels analysis, since there is no camera motion in our case. A Frame Difference Image (FDI) is a binary image formed by comparing every three successive frames (the intensity information is used). A pixel value of FDI is set to 255 if a significant difference occurs at the pixel location, and otherwise, the pixel value of FDI is set to 0, as defined in Eq. (3-7), where n is the frame sequence number and Td is a threshold.
(3-7)
Morphological operations are then performed to remove noises and make the regions filled. Fig. 3-11 presents the examples of frame difference images. Fig. 3-11(a) are examples about spiking with two blockers, and (b) are their frame difference images.
28
(a) Original frames (b) FDI
Fig. 3-11. Examples of frame difference images (FDI).
Both spiking and blocking need the action of jump. The exact moment of jump is indispensable for spiking events detection and blocking patterns classification. In other words, we can detect spiking events by extracting frames of the jump moment. By observation, the sum of moving pixels within the analyzed area has obvious change while the players are jumping. As shown in Fig. 3-12, the peaks of continuous changes in sum of moving pixels at each rally are discovered.
29
Fig. 3-12. Continuous changes in sum of moving pixels within each rally.
The frames corresponding to peaks at each rally are analyzed. In frames corresponding to peaks, we take the columns along the analyzed area into account if it contains moving pixels more than a threshold TCMP. If the number of columns Ncol is
more than another threshold TNC, the frame is regarded as jump frame, as shown in
Fig. 3-13(a). In our experiment, , and
. The parameter is chosen since a net (9 m)
can be roughly occupied by 18 men and each man occupies about length of net. The retrieved frames of jump moment extraction are shown in Fig. 3-13(b). If the peak of continuous change in sum of moving pixels within the analyzed area satisfies the conditions, we extract the corresponding frame as frame with jump.
30
(a) The resulting peak in succesicve frames. (b) The corresponding frames with jump.
31
3.5 Blocking Event Detection
Based on the extracted frames with jump, further analysis to detect the blocking events at that moment can be made. First, where the spiking and blocking occur should be located. Second, the blocking patterns will be classified into two main categories. Finally, we can make some tactics analysis with spiking events and blocking locations.
3.5.1 Blocking Location Detection
For the extraction of the frames with jump, the distribution of the amount of moving pixels along the horizontal restricted area is computed, as illustrated in Fig. 3-14. As mentioned above, only the restricted area higher than the upper horizontal marker is considered since the spiking and blocking always happen there. We first find the column where the maximum of the distribution occurs. From that column, the leftest and most right columns containing moving pixels are regarded as the block boundaries. A search distance Sdis should be constrained in case of locating the noises
not belonging to blocking. We set the threshold to be length of 3 men since at most 3 men block at the same time. And we make a bounding box to surround the boundary, called blocking region. As shown in Fig. 3-15, we depict the blocking region in the frames with jump. in our experiment.
32
Fig. 3-15. The results of blocking location detection.
3.5.1.1 Key Frame of Spiking Event
The frames with jump of the same spiking events may be detected more than once. For this reason, we use the occurring time and blocking location to extract key frames. If two frames of the spiking event are detected in near time and the blocking locations are close, we choose the highest Blocking Region Density (BRD) frame as key frame to represent the spiking event. Blocking Region Density (BRD) is defined as Eq. (3-8).
33
3.5.2 Blocking Pattern Classification
We can classify the blocking patterns after detecting the blocking location. In fact, the more people participate in blocking, the higher probability of successful blocking would be. Consequently, the blocking patterns can be classified based on the number of people included. In our proposed scheme, the blocking patterns are classified into two main categories based on width of blocking region: none/single, and twice/triple. None or single blocker involved may result from brilliant tactics or may just a cloak. On the contrary, twice or triple blockers involved means that the success rates of spiking are lower than none or single. Fig. 3-16 gives some examples of two classes. We verify which class the frames with jump belong to by their widths of blocking region by Eq. (3-9), where F means the extracted frame with jump. ClassA
represents none/single, and ClassB is twice/triple.
34
(a) (b)
(c) (d)
35
3.6 Tactic Analysis
Delayed spiking and alternate position spiking are two basic kinds of important tactics in volleyball matches. For this reason, we try to find the patterns of two kinds of tactics based on domain knowledge. Delayed spiking utilizes close time and positions between the jumps of two spikers to confuse the blockers. Alternate position spiking avoids too many blockers by making a wide set. To discriminate the two kinds of tactics, we can use the occurring time of two spiking events and distance between two blocking locations. In both two tactics, the occurring time of two spiking events is very close. But the distance between two blocking locations in delayed spiking is shorter than alternate position spiking.
By observation, the occurring time of two spiking events in both two kinds of tactics are within 1.5 seconds. We can further discriminate the two kinds of tactics by the distance between two blocking locations. We select a threshold Tsp to discriminate
the two kinds of tactics. Tsp is width of 4 men which is about two meters, since the
alternate position spiking needs a longer distance between two blocking location to avoid too many blockers. For example, inFig. 3-17, the two spiking events occurred within 0.3 second and the distance between two spiking events is less than the width of 4 men, so it is a delayed spiking. And in Fig. 3-18,the two spiking events occurred within 1 second and the distance between two spiking events is more than the width of 4 men, so it is an alternate position spiking.
36
Fig. 3-17. An example of delayed spiking.
37
Chapter 4. Experimental Results
In this chapter, the experimental results of spiking event detection, blocking pattern classification, and tactic analysis are presented in the following sections. Some discussion and events analysis are also provided. For all experimental steps, we use AVI video sequences and implement the analysis in pixel domain. The resolution of all sequences is 720 × 480. In section 4.1, the results of spiking event detection are illustrated. The outcomes of blocking pattern classification are shown in section 4.2. Finally, we try to make some tactic analysis in section 4.3.
4.1 Experimental Results of Spiking Event Detection
We use three sets of different matches and extract 73 clips with obvious spiking events. There are 25 clips in set1, 25 clips in set2 and 23 clips in set3. The matches are recorded by NCTU volleyball school team. The performance of spiking event detection can be evaluated by precision and recall, defined as [20]
,
Established correspondences denote the total number of retrieved jump frames candidates, and actual correspondences represent the number of ground truth. In the experiment, the moving pixel threshold TCMP is height of analyzed area, and the
number of columns threshold TNC is width of analyzed area. A net is 9 meters long,
and it can be roughly occupied by 18 men. Therefore, we set the parameter to be . Table 4.1 shows our configuration. And some examples of detected spiking events are
38 shown in Fig. 4-1.
Table 4.1: Configuration of spiking event detection.
Parameter Symbol Value
Moving pixel threshold TCMP height of analyzed area
Number of columns threshold TNC
width of analyzed area
Fig. 4-1. Examples of detected spiking events
Although the key frames in same spiking event are extracted, there are still too many jump frame candidates. As a result, we try to filter out those frames using appropriate thresholds. We use the width of blocking region and blocking region density (BRD) defined in Eq. (3-9). The extracted frames with small width of blocking region or large width of blocking region but with low BRD are discarded. The thresholds are chosen empirically. Configuration of search distance is illustrated in Table 4.2. Table 4.3 illustrates the performance of spiking event detection before and after filtering. The ground truth is the number of actual spiking events by observation. The retrieved candidates mean retrieved frames of spiking events based on our scheme and the number of retrieved candidates after filtering is also provided. The number of correct jump frames represents the retrieved frames in ground truth. Precision and recall are used to evaluate the performance, defined as the following
39
metric. From Table 4.3, the precision of spiking event detection is about 34.4% before filtering, but it can reach 86.8% after filtering.
Table 4.2: Configuration of blocking pattern classification.
Parameter Symbol Value
Search distance Sdis
Blocking distance threshold
1.5 length of man
Table 4.3: Performance of spiking event detection.
Set 1 Set 2 Set 3 Total
# of ground truth 44 57 46 147
# of retrieved candidates 113 133 135 381
# of retrieved candidates(filtered) 47 59 45 151
# of correct jump frames 41 50 40 131
Precision (%) 36.3 37.6 29.6 34.4
Precision (filtered) (%) 87.2 84.7 88.9 86.8
40
Error cases of incorrectly detected spiking events may be caused by ball and jump serve, as shown in Fig. 4-2(a)(c). The detection of ball while it passes through the analyzed area may lead to false alarm since we just use the moving in the analysis. Since there is no depth information, the pattern between spiking and jump serve is hard to discriminate. The problem may be solved by excluding the several frames in the beginning of each rally because the serve just happens at the start of the rally. On the other hand, Error cases of unsuccessfully detected spiking events may result from cloak and far-net-toss spiking, and examples are shown in Fig. 4-2(b)(d). Cloak is a kind of tactics which a player pretends to spike in order to protect other spikers from being blocked by too many blockers. However, sometimes the player executing a cloak may not jump as high as a real spiking. As a result, some cloaks will not be detected because we only focus on the area higher than net. Far-net-toss spiking is hard to detect since the ball is set to be far from net. Consequently, the location of spiking seems occur lower than our analyzed area without depth information.
41
(a) (c)
(b) (d)
Fig. 4-2. Examples of false and miss situation. (a) ball (b) jump serve (c) cloak (d)
42
4.2 Experimental Results of Blocking Pattern Classification
Based on the correctly detected spiking events, the experiment of blocking pattern classification can be made. ClassA represents none/single, and ClassB is
twice/triple. As illustrated in section 4.1, a man has about width of net. Accordingly, we set width of blocking region threshold to be the width of 1.5 men, as illustrated in Table 4.2. Table 4.4 presents the results of blocking pattern classification.
From Table 4.4, the accuracy of classification for ClassA (none/single) is about
81.4%, the accuracy of classification for ClassB (twice/triple) is 91.1% and overall
accuracy of classification is about 84.7%. Error cases of blocking pattern classification may result from separated spikers and blockers. If the blockers are not aligned with the spiker, the width of blocking region will be too long to be correctly classified into the right class. Examples are shown in Fig. 4-3. The spiker in Fig. 4-3 is separated from the blocker, making the width of blocking region too long to be ClassA.
Table 4.4: The result of blocking pattern classification.
Set 1 Set 2 Set 3 Total Overall Class A B A B A B A B
# of ground truth 21 20 32 18 33 7 86 45 131 # of correctly classified 18 18 24 17 28 6 70 41 111 Accuracy (%) 85.7 90 75 94.4 84.8 85.7 81.4 91.1 84.7
43
Fig. 4-3. Error cases of blocking pattern classification.
4.3 Tactic Analysis
We manually select clips containing two tactics from clips with correctly detected spiking events. In fact, both two kinds of tactics contain a cloak. But as mentioned in section 4.1, a cloak will not be detected if the height of jump is not enough. Accuracy is used to evaluate the performance. We check whether the clips with one of two tactics are correctly recognized. In our experiment, if the cloak is detected, the delayed spiking and alternate position spiking can be identified more precisely, as shown in Table 4.5.
Table 4.5: The results of tactics analysis.
# of clips # of clips (cloak detected) # of correctly recognized Accuracy (%) Accuracy (cloak detected) (%) Delayed spiking 9 7 6 66.7 85.7 Alternate position spiking 26 20 18 69.2 90
44
Chapter 5. Conclusion and Future Work
Little work on content analysis and event detection has been done for volleyball video because it is much complex to track the ball and players in volleyball video due to the high density of players on the court and the frequent ball-player overlaps. We propose a system that can automatically detect spiking and blocking events without ball tracking. Whistle detection is applied to perform video preprocessing. With extracted video clips, camera calibration technique is exploited to detect court and net. After locating net, moving pixel analysis is applied to detect spiking events. And we analyze the spiking events for the purpose of finding blocking patterns. According to occurring time of spiking events and blocking location, we can recognize two important tactics, delayed spiking and alternate position spiking in volleyball matches. Since the camera is fixed, the patterns of spiking and blocking are too similar to be discriminated. As a result, multiple cameras might be able to resolve the problem and will be the focus of future work. With multiple cameras, we may not only separate blocking from spiking events but also identify the two teams of players. After separating blocking from spiking, we can collect statistical data precisely. And more accurate tactics analysis can be made with the information of two teams available. Tracking players in volleyball videos is difficult since the court is relatively small and occlusion occurs frequently. If an effective and efficient tracking algorithm can be proposed, we can analyze the behavior of players in the matches. In addition, if ball detection and tracking are also applied, we can collect more statistics and analyze the tactics further.
45
Bibliography
[1] H. T. Chen, H. S. Chen, M.H. Hsiao, W. J. Tsai, and S. Y. Lee, “A Trajectory-Based Ball Tracking Framework with Visual Enrichment for Broadcast Baseball Videos,” Journal of Information Science and Engineering, Vol. 24, pp. 143-157, 2008.
[2] H. T. Chen, H. S. Chen and S. Y. Lee, "Physics-Based Ball Tracking in Volleyball Videos with its Applications to Set Type Recognition and Action Detection," in Proceedings of IEEE International Conference on Acoustics, Speech and Signal Processing , pp. 1097-1100, 2007.
[3] C. C. Cheng and C. T. Hsu, “Fusion of Audio and Motion Information on HMM-Based Highlight Extraction for Baseball Games,” IEEE Transactions on Multimedia, Vol. 8,No. 3, pp. 585-599, 2006.
[4] H. T. Chen, M. C. Tien, Y. W. Chen, W. J. Tsai, and S. Y. Lee, “Physics-Based Ball Tracking and 3D Trajectory Reconstruction with Applications to Shooting Location Estimation in Basketball Video,” Journal of Visual Communication and Image Representation, Vol. 20, No. 3, pp. 204-216, 2009.
[5] M. H. Chang, M. C. Tien, and J. L. Wu, “WOW: Wild-Open Warning for Broadcast Basketball Video Based on Player Trajectory,” in Proceedings of the 17th ACM international conference on Multimedia, pp. 821-824, Beijing, China, 2009.
[6] D. Farin, J. Han and P. H. N. de With, “Fast Camera Calibration for the Analysis of Sport Sequences,” in Proceedings of IEEE International Conference on Multimedia and Expo, 2005.
[7] D. Farin, S. Krabbe, P. H. N. de With and W. Effelsberg, “Robust Camera Calibration for Sport Videos Using Court Models,” SPIE Storage and Retrieval Methods and Applications for Multimedia, Vol.5307, pp. 80-91, 2004.
[8] M. C. Hu, M. H. Chang, J. L. Wu, and L. Chi, “Robust Camera Calibration and Player Tracking in Broadcast Basketball Video,” IEEE Transactions on Multimedia, Vol. 13, No. 2, pp. 266-279, 2011.
[9] B. Jähne, Digital Image Processing: Springer Verlag, 2002.
[10] J. Liu, X. Tong, W. Li, T. Wang, Y. Zhang, and H. Wanga, “Automatic Player Detection, Labeling and Tracking in Broadcast Soccer Video,” Pattern Recognition Letters, Vol. 30, No. 2, pp. 103-113, 2009.
[11] V. Pallavi, J Mukherjee, A.K. Majumdar and Shamik Sural, “Graph-Based Multiplayer Detection and Tracking in Broadcast Soccer Videos,” IEEE Transactions on Multimedia, Vol. 10, No. 5, pp. 794-805, August 2008.
46
[12] Y. M. Su, C. F. Chen and C. Y. Chen, “Extracting the Highlight Events of Baseball Videos Using a Model-indexing Decision Approach," in Proceedings of International Conference on Language and Image Processing, pp. 509-513, 2008.
[13] K. B. Soudeh and S. Reza, “Effective Tracking of the Players and Ball in Indoor Soccer Games in the Presence of Occlusion,” in Proceedings of the 14th International CSI Computer Conference, pp. 524-529, 2009.
[14] Y. Song, and W. Wang, “Unified Sports Video Highlight Detection Based on Multi-feature Fusion,” in Proceedings of International Conference on Multimedia and Ubiquitous Engineering, pp. 83-87, 2009.
[15] Volleyball on Wikipedia, http://en.wikipedia.org/wiki/Volleyball
[16] M. Xu, L. Duan, L. Chia, and C. Xu, “Audio Keyword Generation for Sports Video Analysis,” in Proceedings of the 12th annual ACM international conference on Multimedia, New York, NY, USA, 2004.
[17] M. Xu, N. C. Maddage, C. Xu, M. Kankanhalli, and Q. Tian, "Creating Audio Keywords for Event Detection in Soccer Video," in Proceedings of IEEE International Conference on Multimedia and Expo vol.2, pp. II-281-284, 2003. [18] Z. Xiong, R. Radhakrishnan, A. Divakaran and T. S. Huang, "Highlights Extraction from Sports Video Based on an Audio-Visual Marker Detection Framework." in Proceedings of IEEE International Conference on Multimedia and Expo, 2005.
[19] X. Yu, N. Jiang, L. Cheong, H. W. Leong, and X. Yan, “Automatic Camera Calibration of Broadcast Tennis Video with Applications to 3D Virtual Content Insertion and Ball Detection and Tracking,” Computer Vision and Image Understanding , pp. 643–652 , 2009.
[20] A. Yilmaz, O. Javed, M. Shah, “Object Tracking: A Survey,” ACM Computing
Surveys, Vol. 38, No. 4, 2006.
[21] X. Yu, H. W. Leong, C. Xu, and Q. Tian, “Trajectory-Based Ball Detection and Tracking in Broadcast Soccer Video,” IEEE Transactions on Multimedia, Vol. 8, No.6, pp.1164-1178, December 2006.
[22] Y Yang, S. Lin, Y. Zhang, and S. Tang, "Highlights Extraction in Soccer Videos Based on Goal-Mouth Detection." in Proceedings of Signal Processing and Its Applications, pp. 1-4, 2007.
[23] B. Zhang, W. Dou, and L. Chen, "Ball Hit Detection in Table Tennis Games Based on Audio Analysis." in Proceedings of 18th IEEE International Conference on Pattern Recognition, Vol. 3, pp. 220-223, 2006.
[24] G. Zhu, Q. Huang, C. Xu, Y. Rui, S. Jiang, W. Gao and H, Yao, “Trajectory Based Event Tactics Analysis in Broadcast Sports Video,” in Proceedings of the 15th
47
international conference on Multimedia, pp.58-67, Augsburg, Germany, 2007. [25] T. Zhang, and C. C. J. Kuo, “Audio Content Analysis for Online Audiovisual Data Segmentation and Classification,” IEEE Transactions on Speech and Audio Processing, Vol. 9, No. 4, pp. 441-457, 2001.