國立交通大學
機械工程學系
碩士論文
以微機電製程製作微型 PDMS 質子交換膜燃料
電池之實驗研究
The Experimental Study on Micro PDMS PEMFC
by Using MEMS Technology
研 究 生:許義嘉
指導教授:陳俊勳 教授
以微機電製程製作微型 PDMS 質子交換膜燃料
電池之實驗研究
The Experimental Study on Micro PDMS PEMFC Manufactured by Using MEMS Technology
研究生:許義嘉 Student:Chih-Wei Cheng 指導教授:陳俊勳 Advisor:Chiun-Hsun Chen 國 立 交 通 大 學 機 械 工 程 學 系 碩 士 論 文 A Thesis
Submitted to Department of Mechanical Engineering College of Engineering
National Chiao Tung University In Partial Fulfiillment of the Requirements
For the Degree of Master of Science In Mechanical Engineering
June 2010
Hsinchu, Taiwan, Republic of China
i
The Experimental Study on Micro PDMS PEMFC Manufactured by Using MEMS Technology
以微機電製程製作微型 PDMS 質子交換膜燃料電池之實驗研究 學 生 :許 義 嘉 指 導 教 授 : 陳 俊 勳 國立交通大學機械工程學系
摘要
本文主要為研究以微機電製程製作微型 PDMS 質子交換膜燃料電 池之實驗測試。探討反應面積為 2 公分×2 公分的單電池。第一部分 是 PDMS(聚二甲基矽氧烷)單電池之研究,實驗參數包括集電片開孔 形狀、對流方式、以及組裝時鎖合扭力的影響;第二部分是 PDMS 平 板電池堆的研究,實驗參數包括鎖合扭力以及燃料供應方式的影響; 另外,單電池及電池堆都經由長時間放電測試以觀察其耐久度。最後, 本論文也將 PDMS 微型燃料電池與矽微型燃料電池做性能的比較與分 析。 由實驗結果可知在相同開孔率之集電片下,不論陰極採用呼吸式 或是強制對流式 (有流場板)之單電池,其性能皆隨集電片之開孔數 增加而提升;強制對流方式的單電池比較適合高電流密度輸出使用, 而呼吸式燃料電池較適合低電流長時間輸出使用;電池組裝之鎖合壓 力必須在不使流道結構變型的情況下增加才能有效提升其性能;對於 本實驗之電池堆設計,由於陰極端的空氣提供速率有限,因此增加燃 料流量並無法有效改善濃度極化現象;另外,電池堆中之每顆單電池 因為燃料供應順序不同而會有不同性能表現;單電池與電池堆經過十 四小時長時間測試後,都有良好的耐久度;經比較後,不論陰極採用 呼吸式或是強制對流式,PDMS 基材之單電池皆比矽基材之單電池性 能表現佳;由於 PDMS 基材有比較少的積水現象,因此比矽基材更適 合用在呼吸式微型燃料電池上。 關鍵字:微機電,PDMS,微型質子交換膜燃料電池,開孔率,鎖合壓 力ii
ABSTRACT
This study fabricated micro PDMS (Polydimethyl Siloxane) PEMFC (Proton Exchange Membrane Fuel Cell) by using the MEMS (Micro Electro Mechanical Systems) technology. The active area of the membrane is 2cm×2cm. Firstly, a series of performance experiments on a single micro PDMS PEMFC was carried out. The experimental parameters included current collector shape, convection type and clamping force, respectively. Secondly, a planar PEMFC stack was designed and assembled to test the performance. The experimental parameters consisted of clamping force and fuel supply condition. In addition, both the single cell and the stack were tested for durability. Finally, a comparison between PDMS-based PEMFC and silicon-based one was made.
The experimental results show that both the performances of the air-breathing and forced convection cells increase with an increase of the circle numbers from one to twenty-five on the current collector under the same current collector open ratio; The forced convection cell is a better choice for long-time high current-density output whereas the air-breathing cell is more suitable for lower current density output; An appropriate clamping torque should be considered carefully to enhance the performance but without narrowing down the fuel flow channels; The increase of flow rate is not a best way to improve the concentration loss in this air-breathing stack experiment because of the limiting air supply, and each cell in the same stack has different performance under series arrangement; Both the single micro PDMS fuel cell and the cell stack can maintain a stable power output for a long time use up to 14 hours; The PDMS-based PEMFC has a better performance than that of the silicon-based one under both forced oxygen supply and the air-breathing ways; PDMS is a better material than silicon for micro air-breathing fuel
The Experimental Study on Micro PDMS PEMFC Manufactured by Using MEMS Technology
Student: Yi-Ja Hsu Advisor: Prof. Chiun-Hsun Chen
Department of Mechanical Engineering National Chiao Tung University
iii
cell because it is with less water flooding effects.
Keywords: MEMS, PDMS, Micro PEMFC, Open Ratio, Clamping Force
iv
Acknowledgements
曾經徬徨,曾經失望,曾經面對未知的挑戰排回躊躇,曾經跌 於險阻的路途灰心喪志。但很幸運的,我–許義嘉,一個呆呆蠢蠢 的平凡學生,也終於完成了碩士學位。這期間得到了好多人幫助, 我才能克服挫折而成長。謝謝你們的相伴,要感謝的人太多了,所 以就感謝天吧……開玩笑的,我還是要一一點名出來。 感謝我的指導教授 陳俊勳,除了論文的指導外,您不時耳提 面命要我對自己負責,相信我能做得更好,我想這才是兩年中獲得 的最大的淬煉。感謝阿貴學長在燃料電池研究上不厭其煩的教導, 因為你不疾不徐的從容態度,才使我因挫折而沮喪擔憂的心情得到 舒緩。致瑋學長的開路減少我的絆倒機會,長新立下的好榜樣讓我 有努力目標,也感謝堂原學長在實驗上的協助。感謝金輝學長,你 常主動提供研究上與生活上的建議,使我的研究之路更順遂。感謝 云婷與聖容學妹,妳們讓我感受笑聲與溫暖,也讓我分享生活的快 樂悲傷,更讓我有依依不捨的心情。感謝信錡、瑋琮,你們讓我感 到並肩作戰、同甘共苦的溫馨,這場仗打得並不寂寞。感謝實驗室 其他成員:彥成、達叔、家維學長,嘉軒、世庸、宗翰、黃鈞,你 們都是我實驗室生活的愉快回憶。 感謝郭勅君、大玉米和姿妤,失落的時候有你們在,抱怨的時v 候有你們在,炫耀的時候有你們在,與你們一起渡過的日子,讓我 的學生生涯好精彩。感謝濃眉團:小傑、當肯、豪瓜、毛毛、堯琦, 在同儕們相繼分道揚鑣之際,你們的陪伴讓我在吉他社得到溫馨 感,也感謝吉他社歷屆成員們這六年的陪伴。感謝小玄子,我重要 的同鄉和玩伴。感謝也許星期三,和小馬、BB 你們一起表演,生活 變得很充實,也讓我重新思考浪漫、夢想的重要性。 感謝我的父母親,雖然這六年來總是因為相聚遙遠,無法常常 回家,但愛你們的心一直不會變。感謝妹妹,不論生病還瑣事,妳 的照顧是我的避風港。感謝奶奶一家人,你們總以我為榮,給予我 精神支持。感謝台北的華姑,讓我假日有回家的感覺。 我沒提到的朋友,你們都是我生命中重要的過客,成就了這本 論文,也成就了我目前為止小小的人生,感謝你們。 對於前途、對於夢想,總在不斷探索中前進,就算現在無法得 到答案,至少得到了一份能力與一股信念:實現夢想的能力,相信 自己的信念。碩士學位並不值得說嘴,但這期間擁有的回憶,卻足 以讓我炫耀一輩子。 P.S.也感謝我的娛樂夥伴:Friends 影集、吉他,排遣我心煩意亂 的煩躁時光。
vi
Contents
ABSTRACT (CHINESE) ... i
ABSTRACT (ENGLISH) ... ii
Contents ... iv
LIST OF TABLE... x
LIST OF FIGURES ... xi
Chapter 1 ... 1
Introduction ... 1
1.1 Motivation and Background: ... 1
1.2 Literature Review: ... 4
1.3 Scope of Present Study ... 13
Chapter 2 ... 18
Fundamentals of Fuel Cell ... 18
2.1 History of Fuel Cell: ... 18
2.2 Principle of the Fuel Cell ... 19
2.2.1 Thermodynamics ... 19
2.2.2 Kinetics ... 20
2.2.2.1 Activation Losses ... 21
2.2.2.2 Ohmic Losses ... 22
2.2.2.3 Concentration Losses ... 22
2.3 Type of Fuel Cells ... 23
2.3.1 SOFC ... 26
2.3.2 MCFC ... 26
2.3.3 PAFC ... 26
vii
2.3.5 PEMFC ... 27
2.4 Fuel Cell Stack ... 28
2.5 Principle of PEMFC ... 28
2.6 Structure of PEMFC ... 29
2.6.1 Bipolar Plate, Current Collector, and End Plate ... 29
2.6.2 Gas Diffusion Layer (GDL) ... 29
2.6.3 Gasket ... 29
2.6.4 Proton Exchange Membrane (PEM) ... 30
2.6.5 Active Layer ... 30
Chapter 3 ... 33
Experimental Apparatus and MEMS Fabrication Processes ... 33
3.1 Processes of Fabricating the Flow Field Plates ... 33
3.1.1 Mask Design ... 33
3.1.2 RCA Clean ... 33
3.1.3 Deposition of block layer Al ... 35
3.1.4 Fabrication of Photolithography (the first mask) ... 35
3.1.5 Removing the Block Layer Al ... 37
3.1.6 Dry etching of Si ... 37
3.1.7 Strip (Remove PR ) ... 37
3.1.8 Repeat 3.1.4~3.1.7 with the second mask ... 38
3.1.9 Micromolding PDMS on the silicon flow field mold ... 38
3.2 Assembly and Components of micro PEMFC ... 39
3.2.1 Components of Micro PEMFC ... 39
3.2.2 MEA and GDL ... 39
3.2.3 Assembly of Micro PEMFC ... 39
viii
3.2.5 Assembly of Air-Breathing Micro PEMFC ... 40
3.2.6 Assembly of Air-Breathing Micro PEMFC stack ... 40
3.3 Test Station ... 41
3.4 Process of Fuel Cell Testing ... 43
3.5 Uncertainty Analysis ... 43
3.5.1 Analyses of the Propagation of Uncertainty in Calculations ... 44
3.5.2 The Uncertainty of Test Station Apparatus ... 45
3.5.2.1 The Uncertainty of HP 6060B Electronic Load: uv,uA ... 45
3.5.2.2 The Uncertainty of Mass Flow Controller ... 46
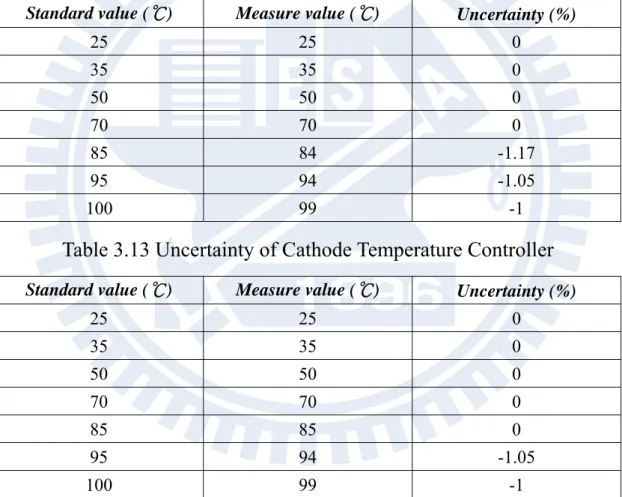
3.5.2.3 The Uncertainty of Temperature Controller ... 49
3.5.3 The Uncertainty of Fuel Cell Power Density ... 50
Fig. 3.17 Assembly of the Micro Air-breathing PEMFC Single Cell ... 58
Chapter 4 ... 62
Results and Discussion ... 62
4.1 Single Micro PDMS PEMFC ... 62
4.1.1 Reference Case ... 62
4.1.2 Effect of Current Collector Shape ... 66
4.1.3 Effect of Convection Type ... 69
4.1.4 Clamping Force Effect ... 71
4.1.4.1 Micro Air-breathing PDMS PEMFC ... 71
4.1.4.2 Comparison of PDMS- and Silicon-Base Cells ... 72
4.1.5 Durability Test of Single Micro PDMS PEMFC ... 72
ix
4.2.1 Effect of Clamping Force ... 73
4.2.2 Effect of Fuel Supply condition ... 74
4.2.2.1 Effect on the Whole Stack ... 74
4.2.2.2 Effect on Each Cell ... 75
4.2.3 Stack Durability Test ... 75
4.3 Comparison between Silicon Base and PDMS Base ... 76
4.3.1 Forced Oxygen Supply ... 76
4.3.2 Air-breathing ... 77
4.3.3 Liquid Water Produced by Thermal Effect ... 78
Chapter 5 ... 93
Conclusions and Recommendations ... 93
5.1 Conclusions ... 93
5.2 Recommendations ... 95
Reference ... 96
x
LIST OF TABLE
Table 2.1 The Five Major Types of Fuel Cells [26] ... 25
Table 3.1 the Steps of RCA Clean Process... 34
Table 3.2 Parameter of Track MK-8 ... 36
Table 3.3 The properties of MEA ... 39
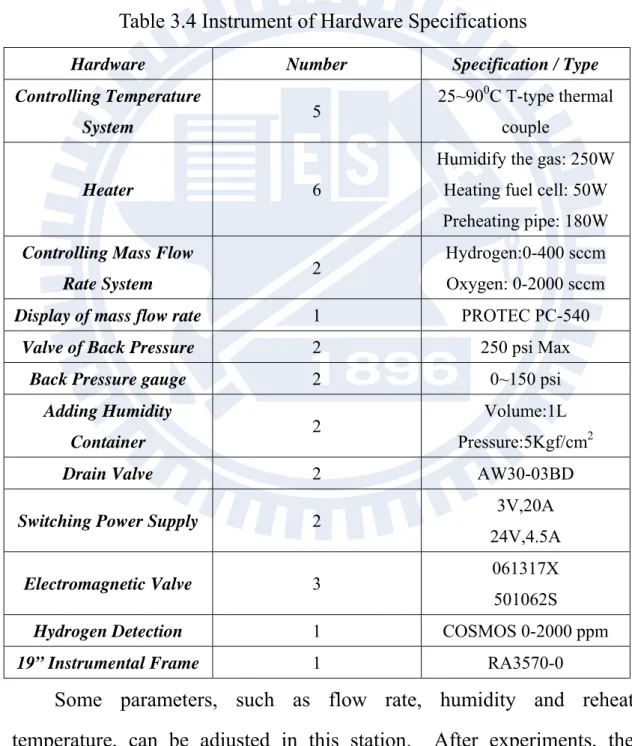
Table 3.4 Instrument of Hardware Specifications ... 41
Table 3.5 Function of Software ... 42
Table 3.6 One or More PEMFC Testing Range ... 42
Table 3.7 Uncertainty of Electronic Load Potential Meter ... 45
Table 3.8 Uncertainty of Electronic Load Current Meter ... 46
Table 3.9 Uncertainty of Anode MFC ... 48
Table 3.10 Uncertainty of Cathode MFC ... 48
Table 3.11 Uncertainty of Air Bleeding MFC ... 48
Table 3.12 Uncertainty of Anode Temperature Controller ... 49
Table 3.13 Uncertainty of Cathode Temperature Controller ... 49
Table 3.14 Uncertainty of Cell Temperature Controller ... 50
Table 3.15 The Measuring Uncertainty of Fuel Cell ... 50
Table 4.1 Testing Conditions of Reference case ... 64
Table 4.2 Experimental Results of Five Different Current Collector for Air-breathing Cell ... 69
Table 4.3 Testing Conditions ... 76
xi
LIST OF FIGURES
Fig. 1.1 Global Fossil Carbon Emissions in Recent Years ... 14
Fig. 1.2 The Petroleum’s Price in Recent Year ... 14
Fig. 1.3 Portable Power Sources, Ranged from KW to W ... 15
Fig. 1.4 (a) Bipolar Plate Design and (b) Monolithic Design [2] ... 15
Fig. 1.5 Comparison of Power Densities for Bilayer and Monolithic Design [2] ... 16
Fig. 1.6 Unit Cell Cathode Plate Designs for the Rectangular, Triangular and Circular Opening Geometries at Various Opening Ratios [15] ... 16
Fig. 1.7 Research Flow Chart ... 17
Fig. 2.1 Typical I-V Curve For a PEMFC ... 31
Fig. 2.2 I-V Curve of Fuel Cell ... 31
Fig. 2.3 Linear Drop in the Middle of the I-V Curve ... 32
Fig. 2.4 Sandwich Structure of PEMFC ... 32
Fig. 3.1 Flow Charts of Flow Field Plate Fabrication ... 51
Fig. 3.2 Mask Design of Flow Field Plate Mold ... 51
Fig. 3.3 Wet Bench ... 52
Fig. 3.4 Spin Drying ... 52
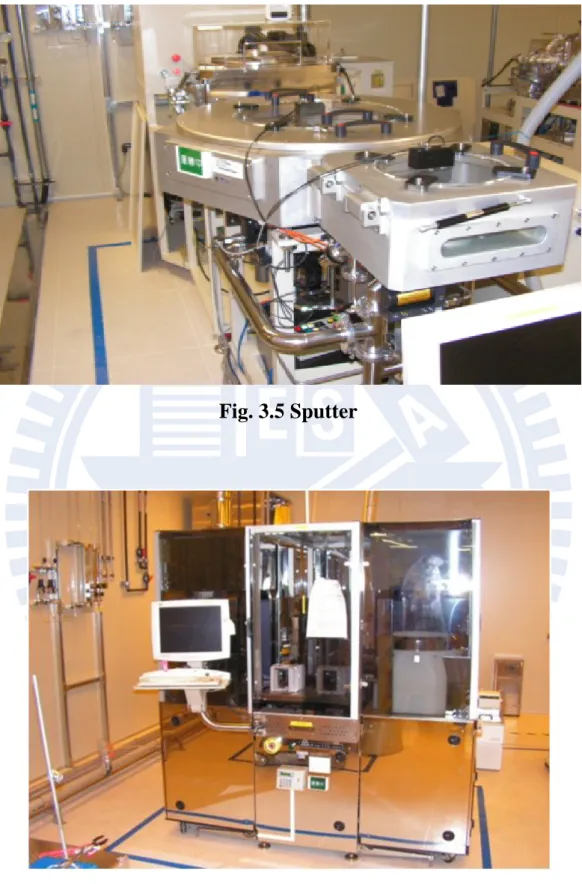
Fig. 3.5 Sputter ... 53
Fig. 3.6 Track MK-8 ... 53
Fig. 3.7 ICP ... 54
Fig. 3.8 Flow Field Plates Mold on the Silicon Wafer ... 54
Fig. 3.9 Vacuum Chamber ... 55
xii
Fig. 3.11 GDL and MEA... 55
Fig. 3.12 Components of a Single Micro Fuel Cell ... 56
Fig. 3.13 Assembly of Micro PEMFC ... 56
Fig. 3.14 Test of a Single Micro PEMFC ... 57
Fig. 3.15 Different Shapes of Current Collector Slice ... 57
Fig. 3.16 Different Shapes of Acrylic Plate ... 58
Fig. 3.18 Test of a Single Micro Air-breathing PEMFC ... 59
Fig. 3.19 Assembly of the Planar Micro PEMFC Stack ... 59
Fig. 3.20 Acrylic Plate and PDMS Flow Field Plate of the PEMFC Stack ... 60
Fig. 3.21 Anode Side of the PEMFC Stack ... 60
Fig. 3.22 Cathode Side of the PEMFC Stack ... 60
Fig. 3.23 Current Collector Slice of the PEMFC Stack ... 60
Fig. 3.24 Test Station ... 61
Fig. 3.25 Components of Test Station ... 61
Fig. 4.1 Performance Curves (I-V, I-P and I-R) for Reference Case ... 79
Fig. 4.2 Resistance Value from the Voltage Divided by the Current ... 79
Fig. 4.3 I-V Curves of Five Different Current Collectors for An Air-breathing Cell ... 80
Fig. 4.4 I-P Curves of Five Different Current Collectors for An Air-breathing Cell ... 80
Fig. 4.5 Comparison of Average Distance of Open Area and Non-open Area among Difference Current Collectors ... 81
Fig. 4.6 I-R Curves of Five Different Current Collectors for An Air-breathing Cell ... 81 Fig. 4.7 I-V Curves of Five Different Current Collectors under Forced
xiii
Convection ... 82
Fig. 4.8 I-P Curves of Five Different Current Collectors under Forced Convection ... 82
Fig. 4.9 I-R Curves of Five Different Current Collectors under Forced Convection ... 83
Fig. 4.10 I-V Comparison of Forced and Natural Convection Effect ... 83
Fig. 4.11 I-P and I-R Comparison of Forced and Natural Convection Effect ... 84
Fig. 4.12 I-V Curves of Clamping Fore Effect on Single Cell ... 84
Fig. 4.13 I-P Curves of Clamping Fore Effect on Single Cell ... 85
Fig. 4.14 I-R Curves of Clamping Fore Effect on Single Cell ... 85
Fig. 4.15 Comparison of PDMS and Silicon Base ... 86
Fig. 4.16 Long Time Test of Single Micro PDMS PEMFC ... 86
Fig. 4.17 I-V Curves of Clamping Force Effect on Micro Planar PEMFC Stack ... 87
Fig. 4.18 I-P Curves of Clamping Force Effect on Micro Planar PEMFC Stack ... 87
Fig. 4.19 I-R Curves of Clamping Force Effect on Micro Planar PEMFC Stack ... 88
Fig. 4.20 I-V Curves of Different Fuel Supply Condition of Micro Planar PEMFC Stack... 88
Fig. 4.21 I-V Curves of Each Cell under Fuel Flow Rate of 60sccm ... 89
Fig. 4.22 I-V Curves of Each Cell under Fuel Flow Rate of 120sccm ... 89
Fig. 4.23 I-V Curves of Each Cell under Dead-end Condition ... 90
Fig. 4.24 Long time test of Planar Micro PDMS PEMFC Stack ... 90 Fig. 4.25 Comparison of PDMS-Based and Silicon-Based PEMFC when
xiv
using Oxygen ... 91 Fig. 4.26 Comparison of PDMS-Based and Silicon-Based PEMFCs when Air-breathing ... 91 Fig. 4.27 Liquid Water on Silicon-based Flow Field Plate and GDL ... 92 Fig. 4.28 No Water on PDMS-based Flow Field Plate and GDL ... 92
1
Chapter 1
Introduction
1.1 Motivation and Background:
Facing the problems that the combustion of fossil fuels releases harmful emissions into the air as shown in Fig. 1.1 that can cause the Greenhouse Effect and threat the health of human beings, the need of clean, no-pollution energy becomes more and more eager. These emissions, such as CO2, CH4, and N2O, etc. not only can penetrate deep
into the lungs and remain there for months or even years, but also can cause severe damage to environment like the acid rain and global warming. Besides, the price of petroleum has been soared due to its rapid depletion in recent years (Fig. 1.2), as a consequence, looking for the alternative energy resources now is a crucial issue for mankind.
In fact, there are several ways by which the emissions by human activities can be curbed, and the dependence on fossil fuels can be reduced without diminishing the living standard. In addition to improving the efficiencies of end-use equipments, vehicle propulsion engines as well as power generation facilities, the increasing applications of renewable or alternative energy sources, such as wind, sun, water, nuclear, bio and hydrogen, should also be take into consideration. Fuel cells, offering the advantage of no or negligible emission of gaseous products, have been expected to be one of the green energy sources in 21st century.
Not only without emission, fuel cells also have some other advantages: high electrochemical performance efficiency, simple stacks design, noise-free, no moving part and low temperature operation, and
2
these characteristics make fuel cells a quite promising energy technology attractive for a variety of applications in recent years. The efficiency is one of the most distinguishing features for fuel cells. Unlike internal combustion engine, fuel cells are not subject to the limit of Carnot efficiency. Indeed, it's commonly supposed that if there were no "irreversibilities" then the efficiency could be 100%.
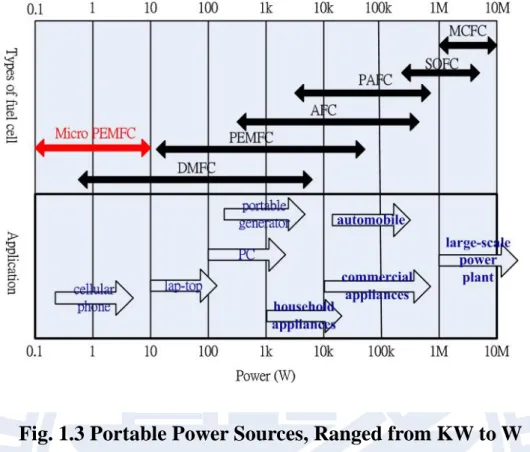
The proton exchange membrane fuel cell (PEMFC), or PEM fuel cell, is the most common-used one among all types of fuel cells due to its relatively low operation temperature. It can serve as a power source from a few watts for powering mobile phones and other electronic equipments, such as personal computer and notebook, right through to several kilowatts for boats and domestic systems, and to tens of kilowatts for cars, to hundreds of kilowatts for buses and industrial Combined Heat and Power (CHP) systems; see Fig. 1.3.
According to fuel type, PEMFC can be divided into two major categories, the hydrogen and the methanol. Comparing methanol with hydrogen, the former has two sever problems, which are slow fuel anode reactions process and fuel crossover (mixed potential), that make its performance lower than the latter one. Moreover, methanol is harmful to human, and its production of CO can poison Pt catalyst. In addition, methanol PEMFC can produce CO2 whereas the product of
hydrogen-oxygen PEMFC is the water only. Therefore, the application of hydrogen fuel in PEMFC is more preferred.
The basic operation of the hydrogen-oxygen fuel cell is very simple. Gaseous hydrogen and oxygen are supplied to anode and cathode, respectively. At the anode, hydrogen gas is catalyzed by Pt and ionizes,
3
releasing electrons and creating hydrogen ion H+, while at the cathode oxygen reacts with electrons coming from the electrode to form water. Followings are the individual and overall reactions:
Anode: 2 Pt 2 2 H ⎯⎯→ H++ e− (1-1) Cathode: 2 2 1 2 2 2O H e H O Heat + − + + → + (1-2) Overall: 2 1 2 2 2 H + O →H O+Heat (1-3)
The conventional fuel cells are in the order of Kilowatt, which is too large for 3C commercial products. Therefore, there are many researches recently to develop micro fuel cells that can be used as a portable power source to meet the power demands of a variety of 3C applications.
The previous efforts were mainly focused on the development of miniature PEMFC. In order to achieve this goal, Cheng [1] intended to make an effort in fabricating the micro fuel cell on silicon-based wafer by using the technology Micro Electro Mechanical System (MEMS) and to see its feasibility. His work found that the material of current collector slices have great influence on the performance of micro PEMFC, and the larger open ratio can obviously promote the micro PEMFC performance.
However, the structure of silicon-based flow field plate is too weak to prevent the problem of crack while assembling, and its nonelastic property easily causes the gas-leaking problem. Therefore, it is necessary to find a better way or better material to replace the silicon-based one, and retain the performance. A new material, Polydimethyl Siloxane (PDMS; (H3C)3SiO[Si(CH3)2O]nSi(CH3)3), is proposed in this work. It
is a group of polymeric organosilicon compounds, whose properties are similar to those of silicones. Owing to its good biocompatibility and flow
4
property, the application of PDMS ranges from contact lenses and medical devices to flow delivery in microfluidic chips, elastic stamp, etc. In this study, it will take the advantage of its good plasticity, elasticity and molding quality to replace the silicon-based flow field plate [1].
1.2 Literature Review:
The flow field structures in fuel cells have to meet several requirements, such as homogeneous fluid distribution, product water removal, good current transport, good under-rib convection and high conductivity. Each factor can considerably influence the performance of fuel cells. However, this work, as mentioned previously, is focused on the effects of flow field structure, cell conductivity and stack assembly on the performance of micro PEMFC.
Yu et al. [2] successfully fabricated a miniature fuel cell on silicon wafers using micro-electronic fabrication techniques, which included photolithography, dry and wet etching, chemical and physical vapor deposition. They found that sputtering different thicknesses of Cu/Au (including 0.5μmAu, 0.2μm Au plated 1.4μm Cu, and 0.9μm Au plated 1.5μm Cu) composite layer on the top of the silicon wafer as a current collector can reduce the resistance, indicating that the cell performance is improved by increasing the thickness of the composite layer on the silicon wafer.
Meyers and Maynard [3] used MEMS techniques to fabricate micro flow channels of PEM fuel cell on silicon substrate. Their designs consisted of bipolar design, similar to the standard cell sandwich commonly used in PEMFC system, and monolithic design, essentially an
5
“unfolded” fuel cell with the anode and cathode on the same substrate (see Fig. 1.4). By making comparison, they found the former shows a better performance than the latter as illustrated in Fig. 1-5. The research also suggested that many system-level issues, like thermal management, air movement, fuel delivery, humidification control, water management, power load management and system integration, must be considered in order to achieve higher performance.
Spiegel et al. [4] used deep reactive-ion etching process to fabricate the serpentine microflow fields in the siliconwafer with the fuel cell channel widths and depths ranging from 20 to 200μm to compare with the conventional ones using traditional CNC machining processes with flow field channel dimensions of 500 and 1000μm. With the same MEA and percentage of active area (channel to rib ratio of 1:1), and under the same test conditions, the fuel cells could have the best performance with the 20-μm of width, depth and rib because such dimensions allowed increase of channel velocity, rapid diffusion and homogenous reactant distribution along the flow channel. Therefore, smaller flow channel dimensions (>100μm) appear to be promising for future micro fuel cell technologies.
Kim et al. [5] used photolithography, anisotropic wet etching, anodic bonding and physical vapor deposition to manufacture a miniaturized PEM fuel cell with silicon separators. A 400μm × 230μm flow channel was made with KOH wet etching on the front side of a silicon separator, and a 550nm gold current collector and 350nm TiNx thin film heater were respectively formed on the front side and the opposite side by PVD. Two separators were assembled with the membrane electrode assembly having
6
a 4cm2 active area for the single cell. With pure hydrogen and oxygen under atmosphere pressure without humidification, the performance of the single fuel cell could lead to 203mW/cm2 at 0.6V at room temperature.
Xiao et al. [6] fabricated a silicon/glass based micro fuel cell system by micromachining technique. The anode and cathode catalyst layers were formed by directly sputtering platinum on the ICP-etched (Inductively Coupled Plasma) high-aspect-ratio columns on silicon substrate. Integrated gold-based micro current collectors were patterned on the silicon and glass surfaces. The high-aspect-ratio columns effectively increased the catalyst surface area, and the micro pillars grown by their etching process further improved the cell performance.
Hsieh et al. [7] developed a novel design and microfabrication for a micro proton exchange membranes with a cross section area of 5cm2 and thickness of about 800μm. It consisted of PMMA flow field plate with narrow and deep channel made by microsystem technology, platinum sputtering deposited on MEA, and an ultra thin copper layer again sputtering deposited on PMMA flow field plate used as a current collector. For the single cell, a reliable power output was obtained.
Hsieh et al. [8] also developed a SU-8 photoresist microfabrication process for micro proton exchange membrane fuel cell flow structures for both anode and cathode flow field plates with a cross section area of 5 cm2 and thickness of about 750μm. The new design for flow field plates would have SU-8 used not only a photoresist but also as a microstructure material. Their fabrication could make a low-cost and high-mass production of small flat single fuel cell with an acceptable power density
7 of about 30mW/cm2 at 0.35V.
Keyur et al. [9] firstly used polydimethylsiloxane (PDMS) as the substrate to fabricate the miniature hydrogen-air PEM fuel cell. In this work PDMS microreactors were fabricated by micromolding on the silicon mold made by photolithography and ICP etching process. Though the performances were still not competitive with standard ones, it did show the feasibility of producing micro PEM fuel cells by using the cheaper base substrates like PDMS in order to minimize their cost.
Song et al. [10] developed a simple and rapid method to fabricate planar PEM fuel cells in PDMS. They patterned a perfluorinated ion-exchange resin, such as a Nafion resin, on a glass substrate using a reversibly bonded PDMS microchannel to generate an ion-selective membrane between the fuel-cell electrodes.
Siu and Chiao [11] used PDMS as the material of gasket and electrode in microbial fuel cell. They used MEMS technology, such as etching and evaporation process, to form the microchannel pattern on the silicon wafer, and molding PDMS on the wafer. Compared with the recent silicon micromachined microbial fuel cell, their result showed the better performance in the average power density and average current density.
Different from the traditional "banded" way, Lee et al. [12] used the "flip-flop" method on the fuel cell stacks. They applied a variety of etching and deposition techniques adopted from microfabrication on glass and silicon substrates in two-cell and four-cell configurations. The current collection was achieved by pattering metal films on an insulating substrate. They found that film thickness is the dominant factor compared
8
to other parameters related to channel topology. Though this new idea can simplify the interconnect design, the fuel may become difficult to supply.
Zhang et al. [13] fabricated a 6-cell PEMFC stack combined with a small hydrogen storage canister. Each cell was made by sandwiching a membrane-electrode-assembly (MEA) between two flow field plates fabricated by a classical MEMS wet etching method using silicon wafer as the original material. The plates were made electrically conductive by sputtering a Ti/Pt/Au composite metal layer on their surfaces. The 6-cells lay in the same plane with a fuel buffer/distributor as their support, which was fabricated by the MEMS silicon–glass bonding technology. The performance obtained a peak power of 0.9W at 250mA/cm2.
Chen et al. [14] designed the 10-cell planar array stack (6cm×6cm× 0.9cm) and compared the performance of the parallel connected one to that of the serial connected one. They found that the parallel connected stack is better because it will not be affected by certain cell with worse performance, and both performances can be enhanced by force convection. They also found the uniformity of each individual cell in serial connected stack that using force convection is better than that using natural convection.
Kim et al. [15] used thin flexible printed circuit board (FPCB) as a current collector in order to reduce an air-breathing monopolar stack's volume. They also designed different patterns of the air-breathing holes on the cathode to find the effect of varying the geometry and opening ratios on stack performance. They found that in cathode the circular-hole pattern with opening ratio of 38% has the best performance, but also
9
causes cathode flooding and unstable output problems. And the rectangular cathode opening pattern with 65% opening ratio was chosen for high performance and voltage stability.
Cha et al. [16] observed the scaling effects of various flow channels in fuel cells with gaseous hydrogen/air reactants from macro feature size (>500μm) to micro one (<100μm). They found that scaling behavior is quite complicated due to highly non-linear convection both in the flow channels and porous electrode. Considering the model predictions, flooding issues, and pressure drop losses, the performance of interdigitated channels decreases as the feature size decreases. Therefore, a good compromise may be found between the reduced pressure drop and reduced performance at intermediate feature sizes depending on operation requirements.
Noponen et al. [17] introduced a measurement system for mapping of current distribution into a free-breathing polymer electrolyte membrane fuel cell. The result showed that the operating temperature has a significant influence on the fuel cell performance. Furthermore, at low cell temperatures the limiting factor is inadequate free convection, and at high temperatures it is drying. They also showed that under some condition this type of fuel cell has fairly homogenous current distribution and therefore does not need any auxiliary pumps or fans to increase the airflow.
Sun et al. [18] applied the technique of current density distribution measurement gasket to measure local current distribution in a PEM fuel cell with serpentine flow field at various humidification temperatures. Their experiments showed the following results: Whether the anode or
10
cathode, the performance or current density can reach the maximum when humidification temperature is equal to the cell temperature. Besides, when the anode and cathode humidification temperatures are equal, if the cell is highly under-humidified, then local current density starts very low and increases monotonously along the channel; if the cell is moderately under-humidified, then the local current density first increases, reaches a maximum, and then decreases along the channel; when the cell is well-hydrated or over-hydrated, the local current decreases monotonically along the channel.
Lee et al. [19] investigated the effect of changing the gas diffusion layer and bolt torque on the performance of a PEM fuel cell at fixed flow rates. The experiment results showed that brittle gas diffusion layer material has higher performance with a less bolt torque because the higher bolt torque may damage the diffusion layer. And when soft material is combined with the more brittle one, the same tendency can be observed. As a result, the bolt torque and the gas diffusion layer type are the important factors for performance of PEM fuel cell.
Fekrazad and Bergman [20] used a three-dimensional model of PEM fuel cell stack to predict the influence of nonuniform stack compression on thermal and electrical contact resistances at the BP-GDL. The result showed that the temperature distribution within the membrane is highly dependent on the clamping pressure distribution. Also, the application of nonuniform clamping pressure distributions can make thermal conditions within the stack to become more uniform. However, it has negligible impact on the fuel cell power output or maximum membrane temperature.
11
methods to investigate effects of different factors on the performance of the micro-PEM fuel cell (μ-PEMFC). Their results showed that among three types of resistance influenced by material, contact and thermal effects, contact resistance caused by the assembling mode of the μ -PEMFC contributes to 19.4% of the total inner resistance, which is much higher than the 2% of the others. Therefore, the designs of new flow field configurations and assembling modes are very important in improving the performance of μ-PEMFCs.
Lin et al. [22] investigated the gas permeability, bulk density, thickness and conductivity of two types of gas diffusion layer (OC14, NC14) as a function of the compressed thickness with an active area of 25 cm2 in a single PEMFC. They found that increasing compression of gas diffusion layer can produce high-quality contact, but excessive compression will damage the carbon fiber, reducing the gas permeability and contact resistance. These results concerning the balance between compression and performance provide vital information for the fabrication of stacks and support for industrial applications.
Chang et al. [23] used a special-designed test rig to measure the thickness, gas permeability, and porosity of a GDL sample under various clamping pressure conditions. Their results showed that at low clamping pressure levels (e.g.< 5 bar), increasing the clamping pressure reduces the interfacial resistance between the bipolar plate and the GDL that enhances the electrochemical performance of a PEM fuel cell. In contrast, at high clamping pressure levels (e.g. >10 bar), although increasing the clamping pressure can reduce the above ohmic resistance, it also narrows
12
down the diffusion path for mass transfer from gas channels to the catalyst layers. Comprising the above two effects does not promote the power density too much but reduces the mass-transfer limitation for high current density.
Zhou et al. [24] developed a model to analyze the effects of assembly pressure, operating temperature and humidity on PEM fuel cell stack deformation, contact resistance, overall performance and current distribution. The modeling results revealed that elevated temperature and humidity enlarge gas diffusion layer and membrane inhomogeneous deformation, increasing contact pressure and reducing contact resistance due to the swelling and material property change of the GDL and membrane. When an assembly pressure is applied, the fuel cell overall performance is improved by increasing temperature and humidity. However, the stack would be more prone to degradation with significant variation of current distribution at elevated temperature and humidity.
Wen et al. [25] experimentally investigated the effects of various combinations of bolt configuration and clamping torque on the corresponding contact pressure distributions and performances of a single PEM fuel cell and a 10-cell stack. Their results showed that, for the single cell under the current experiment conditions, the larger mean contact pressure tends to yield the higher maximum power, regardless of the bolt configuration and the applied torque. The uniformity of the contact pressure distribution, the ohmic resistance and the mass transport limit current have highly linear correlations with the mean contact pressure. However, in the case of the 10-cell stack, the effects of various combinations of bolt configuration and clamping torque on its
13
performance and the mass transport limit current can not be reflected by the stack mean contact pressure only.
1.3 Scope of Present Study
In this thesis, it focuses on the flow field plate of a single micro PEMFC fabricated by using the MEMS technology to observe the feasibility of using PDMS as the material and combining both the gasket and flow field on the same plate. At first, two patterns were designed by AutoCAD to form the shape of flow field plate mold. Followed by several MEMS processes, the flow field plate mold was fabricated on a silicon wafer. And then PDMS molding process was taken to fabricate the PDMS flow field plate. Finally, a single PEMFC was assembled by flow field plates, acrylic plates, current collector slices and membrane-electrode-assembly (MEA). Then, a series of performance experiments on a single micro PEMFC were carried out. The research flow chart can be referred to Fig. 1-7. The experimental parameters include current collector shape, convection type, clamping force, respectively. After these experiments, it also connected several single PEMFCs, whose performance are close to the best one under the optimal combination of the parameters mentioned above, in series to form a cell stack, whose module is used to observe its performance.
14
Fig. 1.1 Global Fossil Carbon Emissions in Recent Years
http://en.wikipedia.org/wiki/Greenhouse_gas
Fig. 1.2 The Petroleum’s Price in Recent Year
15
Fig. 1.3 Portable Power Sources, Ranged from KW to W
http://www.nhu.edu.tw/~society/e-j/63/63-32.htm
16
Fig. 1.5 Comparison of Power Densities for Bilayer and Monolithic Design [2]
Fig. 1.6 Unit Cell Cathode Plate Designs for the Rectangular, Triangular and Circular Opening Geometries at Various Opening Ratios [15]
17
18
Chapter 2
Fundamentals of Fuel Cell
2.1 History of Fuel Cell:
The first demonstration of a fuel cell was by a lawyer and scientist William Grove in 1839, using the reverse experiment that water is being electrolyzed into hydrogen and oxygen. And it did generate a small current that constructs the first concept of fuel cell. Not until 1889, Mond and Langev utilized precious metal, Pt, as the catalyst to develop the first cell under the Grove’s conception such that the formal words of "fuel cell" came up. At that time, their cell could generate 3.5mA/cm2 at 0.7V.
In 1932, Francis Bacon used alkaline electrolyte and Ni as the catalyst to replace Pt to fabricate the alkaline fuel cell different from Mond and Langer's one. After 27 years, both Bacon and Allis-Chalmers company invented the machines powered by fuel cells. These developments helped the commercialization for fuel cell in the future.
During 1960 to 1970, NASA used the fuel cell as the main power source of the spacecraft because its power deliver of 1~10kW was right fit the astronautic need plus the produced water could supply drink to astronauts in the outer space. The development program continued with the invention of a new polymer membrane called Nafion, a registered trademark of DuPont, in 1967. Even after 50 years, however, the cost of manufacture and materials are still too expensive for fuel cells to let them be popular in commercialization. There are still some difficulties to be solved. Fortunately, owing to the mature development of fabrication technologies of MEMS and NANO, the fuel cell now can be minimized
19
into micro scale that can be applied in lots of electronic products.
2.2 Principle of the Fuel Cell
2.2.1 Thermodynamics
Fuel cell is more efficient than heat engines because it converts chemical energy to electrical energy directly. Carnot cycle shows the possible maximum efficiency of a heat engine, which can be expressed as: η TH TL
TH
(2-4)
where TH is the maximum temperature and TL is the rejection temperature of the heat engine. For a typical heat engine that operates at 675K and rejects heat at 325k, the Carnot efficiency limit is 52%.
The ideal efficiency of a fuel cell is given by the ratio of the thermodynamically extractable energy of the reaction to the total heat energy that would have been released by the reaction in combustion: η G
H (2-5) At standard conditions, ΔH0 for the hydrogen/oxygen reaction is -285.83KJ/mole and ΔG0 is -237.14KJ/mole, giving a theoretical efficiency limit of 83%.
Although ΔG0 represents the energy potential that can be extracted by a fuel cell at standard condition, this energy is expressed by the fuel cell as an electrical potential, or voltage (E0):
E ΔGF (2-6) At standard conditions, this equation gives 1.23V, which is referred as the fuel cell open circuit voltage (OCV).
20
ΔG is a function of temperature and pressure, therefore, the fuel cell open circuit voltage changes depending on the operating conditions. These dependencies are described by the Nernst equation:
EN E RT Fln
PH PO
PH O (2-7)
The ideal fuel cell voltage decreases with increasing temperature, but usually the opposite trend is true for the actual fuel cell efficiency due to accelerated electrochemical reaction kinetics at higher temperatures.
2.2.2 Kinetics
An ideal fuel cell would supply an infinite current while maintaining the constant voltage determined by the Nernst equation. But in fact, the actual voltage output of a real fuel cell is less than the ideal thermodynamically predicted voltage. Furthermore, the more current is drawn from a real fuel cell, the more the voltage output of the cell declines, limiting the total power that the fuel cell can deliver. The performance of a real fuel cell device can be summarized with a graph of its current versus voltage characteristics. Such graph, called an I-V curve, shows the real voltage output of the fuel cell for a given current output. An example of a typical I-V curve for a PEMFC is shown in Fig. 2.1.
The voltage output of a real fuel cell is less than the thermodynamically predicted voltage output due to irreversible kinetic losses. The more current is drawn from the cell, the greater these losses. There are three major types of fuel cell losses, which give a fuel cell I-V curve to its characteristic shape as shown in Fig 2.2:
21 1. Activation losses
2. Ohmic losses
3. Concentration losses
An equation for the true fuel cell I-V behavior can thus be written by starting with the thermodynamically predicted voltage output of the fuel cell and then subtracting off the various loss terms:
E EN η IR η (2-8) These three categories of irreversibility are considered one by one in the following sections.
2.2.2.1 Activation Losses
At low current density, the voltage of a fuel cell drops rapidly because of the sluggishness of the electrochemical half reactions occurring at the anode and the cathode electrodes. The oxygen reduction reaction at the cathode is especially sluggish and can account for most of the activation losses. Although the final state of product water is lower in energy than that in the initial reactants, an energy barrier impedes the conversion of reactants into products. A portion of the fuel cell voltage is sacrificed to lower this barrier and thus increases the rate at which reactants are converted into products, allowing the fuel cell to output more current. The relationship between the applied activation overvoltage and the current density output is exponential in nature, and can be described by the Butler-Volmer equation:
i i CO COe F RT CR CRe F RT (2-9)
22
equation can be approximated by a much simpler form, called the Tafel equation:
η RTFln (2-10) Activation losses are minimized by maximizing the exchange current density. The exchange current density is a function of the catalyst material and the total reaction surface area. As mentioned earlier, the electrodes are highly porous to maximize the total reaction surface area. Highly dispersing, nano-scale particles of platinum are mixed into the porous electrode so that they are in intimate contact with the gas phase pores, the electrically conductive electrode, and the ion conductive electrolyte. This maximizes the amount of triple phase boundary, thus maximizing the exchange current density. Platinum is currently the best known catalyst for PEMFC.
2.2.2.2 Ohmic Losses
Ohmic losses arise due to the internal resistance of the materials in the fuel cell to the flow of electrons and protons. These losses are called “Ohmic losses” because they generally follow Ohms law, V=IR. Both the electrically conductive electrodes and the ion conductive electrolyte contribute to the resistance losses. Usually, ionic resistance is dominant in a well-designed fuel cell. The linear drop in the middle of the I-V curve in Fig. 2.3 distinctly manifests the Ohmic loss effects. In fuel cell systems, most of the Ohmic loss arises from the electrolyte.
2.2.2.3 Concentration Losses
At high current density, the voltage output of fuel cell once again drops rapidly and declines quickly to zero. The current density output at
23
zero voltage is known as the short-circuit current, which represents the maximum current that can be produced by the fuel cell. However, at this current level, the voltage output of fuel cell is zero, so the total power delivered by the fuel cell is also zero. Therefore, power peak occurs somewhere in the middle of the I-V curve. The reason for the final steep decline in fuel cell voltage at high current density is due to mass transport limitations. At high current density, the fuel or the oxidant gases are consumed on the reaction surfaces faster than they can be replenished. At a certain limiting current density, the partial pressures of the reactant gases at the reaction surfaces plummet towards zero. From the Nernst equation, it is clear that this dramatic decline in the partial pressures of reactants causes a dramatic decline in output voltage. The voltage drop from this mass transportation limit is:
η A ln 1 (2-11) where A is a fitting parameter (V) and it is obvious that the concentration loss is dominant at high current density. Well-designed flow structures and thin, highly porous electrodes may reduce the concentration overvoltage.
2.3 Type of Fuel Cells
There are five major types of fuel cells as follows. 1. Solid Oxide Fuel Cell (SOFC)
2. Molten Carbonate Fuel Cell (MCFC) 3. Phosphoric Acid Fuel Cell (PAFC) 4. Alkaline Fuel Cell (AFC)
24
While all five fuel cell types are based upon the same underlying electrochemical principles, they all operate at different temperature regimes, incorporate different materials, and often differ in terms of their fuel tolerance and performance characteristics. These are shown in Table 2.1.
25
Table 2.1 The Five Major Types of Fuel Cells [26]
Type of fuel
cell PAFC MCFC SOFC PEMFC AFC
Electrolyte H3PO4 (Li,K)2CO3 (Zr,Y)O2 MEA Polymer
Anode Pt/C Ni+10wt%Cr Ni+(Zr,Y)O2 Pt/C, Pt-Ru/C Pt/C
Cathode C NiO (La,Sr)MnO3,LaC
oO3 Pt/C Pt/C Ion H+ CO32- O2- H+ OH- Reaction of anode H2 Æ 2H2O+ 2e - H2+CO32-ÆH 2O+CO2+2e -H2+O2-ÆH2O+2e -H2 Æ 2-H2O+ 2e -H2 + 2OH- Æ 2H2O+ 2e -CO+O2-ÆCO2+2e -Reaction of cathode 1/2O2+2H++ 2e-ÆH2O
1/2O2+CO-2+2e-ÆCO32- 1/2O2+2e
-ÆO2- 1/2O2+2H++ 2e-ÆH2O 1/2O2+2H2O+ 2e-Æ2OH -Operating temperature 160~190 oC 600~700 oC 900~1,000 oC 30~80 oC 90~100 oC Fuel compatibility H2 H2, CH4 H2, CH4, CO H2, methanol H2 Advantage CO durability, combined heat and power high power, combined heat and power, reform the fuel in cell
high power, combined heat and
power, air as oxidant, reform
the fuel in cell
high density power, air as oxidant, operating in room temperature, fast activation, Operating in room temperature, fast activation Disadvantage operating in high temperature, high cost, low efficiency device can be corroded operating in high temperature, damaging in high temperature high cost, infecting by CO
high cost, fuel is only H2 Application distributed generation large-scale power plant, distributed generation large-scale power plant, distributed generation, automobile industry domestic appliances, portable source, automobile spaceship
26
2.3.1 SOFC
Solid oxide fuel cell (SOFC) is a complete solid-state device that uses an oxide ion-conducting ceramic material as the electrolyte, and includes a lanthanum manganate cathode and a nickel zirconia anode. SOFC works in the region of 800 to 1100 . ℃ This means that high reaction rates can be achieved without expensive catalysts, and that gases such as natural gas can be used directly, or “internally reformed” within the fuel cell, without the need for a separate unit. This type of fuel cell addresses all the problems and takes full advantage of the inherent simplicity of the fuel cell concept. Therefore, it is a promising option for high-powered applications, such as industrial uses or central electricity generating stations.
2.3.2 MCFC
The electrolyte of the molten carbonate fuel cell is a binary molten mixture of lithium and potassium, or lithium and sodium carbonates. It has the potential to be fueled with coal-derived fuel gases or natural gas. Unlike the other fuel cells, carbon dioxide must be supplied to the cathode, and thus converted to carbonate ions. The high temperature achieves a good reaction rate by using a comparatively inexpensive catalyst-nickel. Therefore, MCFC is also a high-temperature fuel cell like SOFC.
2.3.3 PAFC
The phosphoric acid fuel cell (PAFC) uses a phosphoric acid as an electrolyte to conduct proton which is like Nafion membrane in the PEMFC. In PAFC, the electrochemical reactions take place on highly
27
dispersed electrocatalyst particles supported on carbon black. Phosphoric acid is the inorganic acid that has high thermal, chemical, and electrochemical stability. It also contains high volatility (above 150℃) to be adopted as an electrolyte for fuel cells. Due to its low freezing point (42℃) of the pure phosphoric acid, PAFC is usually maintained above such temperature. Unlike PEMFC, the operating temperature of PAFC is normally around 180 to 200℃ that has greater tolerance of CO (up to 1%). PAFC is the first one to be produced in commercial quantities and enjoys widespread terrestrial use.
2.3.4 AFC
The electrolyte of the alkaline fuel cell is an alkaline solution, such as potassium hydroxide, and is operated at about 200℃. AFC is used by NASA on spacecraft, and it is now finding new applications in hydrogen-powered vehicles.
2.3.5 PEMFC
The proton exchange membrane fuel cell capitalizes on the essential simplicity of the fuel cell. The electrolyte is an ion conduction polymer to move H+ ion pass through the supporting ionomer structure. PEMFC appears to be more adaptable to automobile use than PAFC. PEMFC works at low temperature which can start quickly. The thinness of the MEA makes the compact design without corrosive fluid in the fuel cell. These cells are the best candidates for light-duty vehicles, buildings, and much smaller applications. A very attractive solution to the hydrogen supply problem is to use methanol as a fuel instead. Such cell is called
28
direct methanol fuel cell (DMFC). It also uses a polymer membrane as an electrolyte.
The thesis is interested in state-of-the-art PEMFC science and technology, because it is simple structure, runs at relatively low temperature, widely practicability and high efficiency.
2.4 Fuel Cell Stack
The voltage of a single fuel cell is fixed by its particular electrochemical reaction, about 0.7V when drawing a useful current. This means that to produce a useful voltage many cells have to be connected in series. Such a collection of fuel cells in series is known as a “stack”. The stack design and number of single cell depend on the power needed.
2.5 Principle of PEMFC
PEM fuel cells use a proton-conducting polymer membrane as an electrolyte. They are low temperature fuel cells, generally operating at 85-105℃. The reaction in a PEM fuel cell are the same as in a PAFC as they both employ an acidic electrolyte Equations (2.1) and (2.2). The anode reaction consists of hydrogen oxidation to protons; the protons migrate through the membrane to the cathode. At the cathode, oxygen is reduced and then recombines with the protons to form water.
Anode: 2 Pt 2 2 H ⎯⎯→ H++ e− (1-1) Cathode:1 2 2 2 2 2O H e H O Heat + − + + → + (1-2) Overall: 2 1 2 2 2 H + O →H O+Heat (1-3)
Different from the conventional battery, the fuel cell is a device that transforms chemical energy into electricity that does not participate in the
29
reaction. As the active material stored in fuel cell is used up, the device must be stop using and resupplied with the chemical material to work; in other word, the fuel cell is just a transformation machine.
2.6 Structure of PEMFC
A PEMFC, shown in Fig. 2.4, is simply like a sandwich structure. Each component is described as follows:
2.6.1 Bipolar Plate, Current Collector, and End Plate
In a single fuel cell stack, several fuel cells are assembled in series. The bipolar plate is the electronically conductive plate positioned next to the anode end of one cell and the cathode end of another cell. In general, each surface of the bipolar plate contains grooved channels with inlet and outlet as flow path of the fuel and oxidant, respectively. The current collectors are next to the bipolar plates to collect the electric current and connect to the outside load. The end plates keep all the parts of the cell fixed.
2.6.2 Gas Diffusion Layer (GDL)
The gas diffusion layer (GDL) is usually made of carbon paper or cloth with a porous structure treated with hydrophobic agent. It has to meet several requirements, such as electronic conductivity, heat conductivity, fluid permeability, wet ability, and mechanical stability.
2.6.3 Gasket
The gasket is made of Teflon-PTFE, whose characteristics are able to endure the high temperature, corrosion, and etc. It also can avoid the gas spreading out from the gas diffusion layer (GDL) because GDL has a
30
thickness. So the gasket plays an important role in sealing.
2.6.4 Proton Exchange Membrane (PEM)
The “core” of a fuel cell comprises a solid perfluorsulphonic acid polymer, usually named as Nafion from DuPont. It functions as a path for protons. The protons are transferred by migration and convection with water. The membrane, therefore, not only needs to be maintained hydrous but also is free from flooding.
2.6.5 Active Layer
The active layer contains the porous catalyzing material and is positioned between PEM and GDL. For a PEMFC, active layer is usually the platinum (Pt) metal in the anode and cathode. The function of Pt metal is to activate the electrochemical reactions.
31
Fig. 2.1 Typical I-V Curve For a PEMFC
32
Fig. 2.3 Linear Drop in the Middle of the I-V Curve
33
Chapter 3
Experimental Apparatus and MEMS
Fabrication Processes
3.1 Processes of Fabricating the Flow Field Plates
The fabrication of micro PEMFC is different from the conventional way, especially in the flow field plate. Instead of being manufactured by machine tool like CNC, the micro PEMFC adopts the MEMS fabrication. The overall fabrication includes two processes: (1) process of fabricating silicon flow field mold; (2) process of micromolding PDMS on silicon flow field mold. Figure 3.1 shows the steps of fabrication process for flow field plate, and the details are given as follows:
3.1.1 Mask Design
The mask is designed by AutoCAD. In this work, it designs the flow field plate combining with the gasket on the same plate. The flow field plates should have different heights on different patterns, so it needs two different masks to complete the whole pattern, including the edge part (the gasket part), and the flow channel part. The area of flow field is about 3cm2 (1.7cm×1.7cm); see Fig. 3.2.
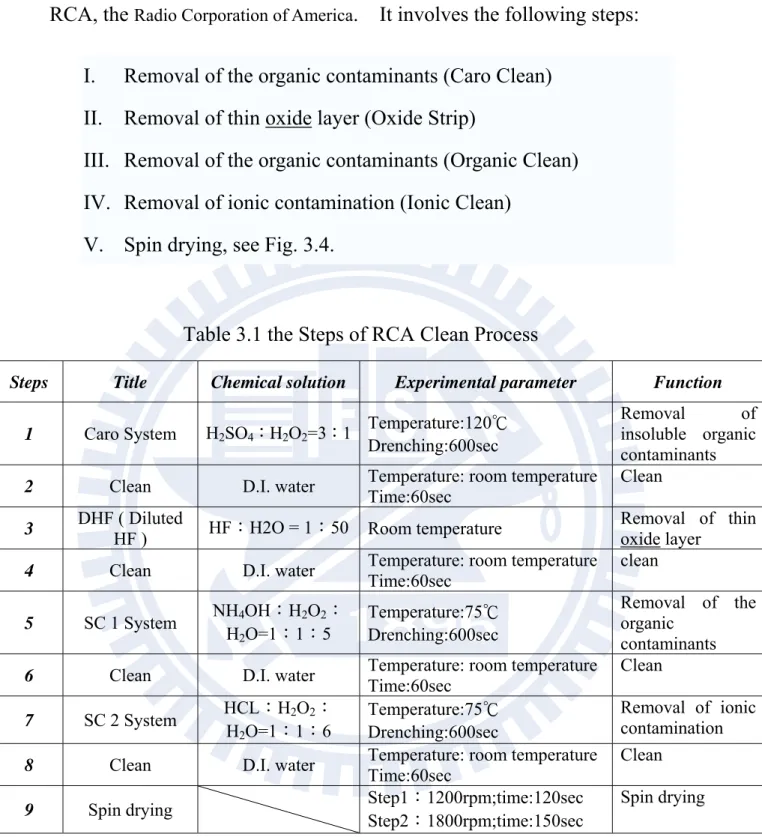
3.1.2 RCA Clean
The RCA (Radio Corporation of America) clean, as shown in Table 3.1, in the wet bench (Fig. 3.3) is a standard set of wafer cleaning steps which needs to be performed before the high-temp processing steps (oxidation, diffusion, CVD) of silicon wafers in semiconductor manufacturing.
34
RCA, the Radio Corporation of America. It involves the following steps:
I. Removal of the organic contaminants (Caro Clean) II. Removal of thin oxide layer (Oxide Strip)
III. Removal of the organic contaminants (Organic Clean) IV. Removal of ionic contamination (Ionic Clean)
V. Spin drying, see Fig. 3.4.
Table 3.1 the Steps of RCA Clean Process
Steps Title Chemical solution Experimental parameter Function
1 Caro System H2SO4:H2O2=3:1 Temperature:120℃
Drenching:600sec
Removal of insoluble organic contaminants
2 Clean D.I. water Temperature: room temperature
Time:60sec
Clean 3 DHF ( Diluted
HF ) HF:H2O = 1:50 Room temperature
Removal of thin oxide layer
4 Clean D.I. water Temperature: room temperature
Time:60sec clean 5 SC 1 System NH4OH:H2O2: H2O=1:1:5 Temperature:75℃ Drenching:600sec Removal of the organic contaminants
6 Clean D.I. water Temperature: room temperature
Time:60sec Clean 7 SC 2 System HCL:H2O2: H2O=1:1:6 Temperature:75℃ Drenching:600sec Removal of ionic contamination
8 Clean D.I. water Temperature: room temperature
Time:60sec
Clean
9 Spin drying Step1:1200rpm;time:120sec
Step2:1800rpm;time:150sec
35
3.1.3 Deposition of block layer Al
To protect Si substrate from the later step of ICP etching process, it deposits Al thin film about 300nm by the sputter (see Fig. 3.5) as a block layer at first. Sputter deposition is a method of depositing thin films by sputtering, driven by momentum exchange between the ions and atoms in the material due to collisions. Ions in the plasma are accelerated by the electric field between two electrodes, causing the ion bombardment, and sputter the atoms on the target, e.g., Al. Then sputtered atoms are ejected into the gas phase plasma and transferred to the substrate by diffusion to complete deposition.
3.1.4 Fabrication of Photolithography (the first mask)
The step is important in the all of fabrication processes to define the pattern, which it uses the first mask to form the edge side of flow channel plate mold that should be etched at the next two steps, such as Al and ICP etching. It is fabricated by Track MK-8 (Fig. 3.6), whose functions include coating PR (photo resist), exposure, development processes. This is a serial process which can lower the experimental uncertainty in the pattern work. Table 3.2 shows the parameters of Track MK-8.
36
Table 3.2 Parameter of Track MK-8
Wafer flow
No Function Step 1 Step2 Step3 Step 4 Step5 Step6
1 NEB Resist Coatiog
Unit
Cassette AD(2-3) COL(2-6) COAT(2-1) HP(2-8) Cassette Unit 1-1,1-2,1-3, 1-4 90℃ 23℃ 4400rpm 110℃, 120sec 1-1,1-2,1-3, 1-4 2 DSE Resist Coating Unit
Cassette AD(2-3) COL(2-6) COAT(2-1) HP(2-8)
Unit Cassette 1-1,1-2,1-3, 1-4 90℃ 23℃ 2000rpm 95℃, 120sec 1-1,1-2,1-3, 1-4 8 G-line Resist Coating Unit
Cassette AD(2-3) COL(2-6) COAT(2-1) HP(2-8)
Unit Cassette 1-1,1-2,1-3, 1-4 90℃ 23℃ 5000rpm 90℃, 60sec 1-1,1-2,1-3, 1-4 20 I-line Resist Coatiog
Unit
Cassette AD(2-3) COL(2-6) COAT(2-1) HP(2-8)
Unit Cassette 1-1,1-2,1-3, 1-4 90℃ 23℃ 3435rpm 90℃, 90sec 1-1,1-2,1-3, 1-4 5 NEB Resist Develop Unit
Cassette HP(2-4) COL(2-9) DEV(2-2) DHP(2-7)
Unit Cassette 1-1,1-2,1-3, 1-4 105℃, 120sec 23℃ 60sec 110℃, 120sec 1-1,1-2,1-3, 1-4 4 DSE Resist Develop
Unit
Cassette HP(2-4 ) COL(2-9) DEV(2-2) DHP(2-7)
Unit Cassette 1-1,1-2,1-3, 1-4 115℃, 120sec 23℃ 60sec 115℃, 60sec 1-1,1-2,1-3, 1-4 11 G-line Resist Develop Unit
Cassette HP(2-5) COL(2-9) DEV(2-2) DHP(2-7)
Unit Cassette 1-1,1-2,1-3, 1-4 120℃, 60sec 23℃ 60sec 120℃, 90sec 1-1,1-2,1-3, 1-4 21 I-line Resist Develop
Unit
Cassette HP(2-4) COL(2-9) DEV(2-2) DHP(2-7) Cassette Unit 1-1,1-2,1-3, 1-4 110℃, 60sec 23℃ 60sec 120℃, 90sec 1-1,1-2,1-3, 1-4
37
3.1.5 Removing the Block Layer Al
This step is to define the pattern that should be etched by the next step of ICP etching. The block layer of Al is etched by Al etchant under a etching rate of 660nm/min.
3.1.6 Dry etching of Si
After removing Al, the wafer can be dry etched by the inductively coupled plasma (ICP) etcher (see Fig. 3.7). ICP is a type of high density plasma source in which the energy is supplied by electrical currents, produced by electromagnetic induction, that is, by time-varying magnetic fields. Its advantages are the high aspect ratio and the higher etching speed than the low density plasma one. The process of ICP etching contains four steps in one cycle: (1) Increase the flow rate of C4F8 gas to
form a polymeric passivation layer on the surface and sidewall of the structure. Meanwhile the ion bombardment of Ar+ keeps working in this step and also in the second and third ones. (2) Decrease the flow rate of C4F8 and gradually increase the one of SF6 gas. This step is to etch the
passivation layer on the structure surface, helping the third step of deep etching. (3) Shut down the flow of C4F8 and increase intensively the SF6
gas flow rate. The fluorine ion, F+, tends to react with Si, forming evaporable compound which can be drained away by the vacuum to complete the etching process.
3.1.7 Strip (Remove PR )
For the positive photo resist, removing the remaining PR not used is called strip. Two ways of stripping are often been utilized: wet and dry. For wet stripping, organic solution like acetone or inorganic solution like
38
vitriol and hydrogen peroxide are being used. However, the inorganic solution will react with the metal, so in this step it adopts the acetone for stripping.
3.1.8 Repeat 3.1.4~3.1.7 with the second mask
The second mask is mainly used to form the flow channel part. The following steps are nothing different from the steps mentioned previously that include the Photolithography, removing the Block Layer Al, dry etching the Si, and strip. The silicon flow field plate mold is done after all these fabrication processes are finished (Fig. 3.8).
3.1.9 Micromolding PDMS on the silicon flow field mold
The molding process takes advantage of the fact that PDMS is a fluid at room temperature that is easily converted into solid form by cross-linking upon heating. To begin the molding process, a premixed substance of 10:1 weight ratio of Sylgard polymer base and curing agent is slowly poured on the silicon mold wafer, and then the wafer is put into the vacuum chamber (see Fig. 3.9). After degassing for 1 hour to remove bubbles before curing, the PDMS is cured at 60 for 2 hours℃ and peeled-off from the wafer. Now several PDMS flow field plates are completed and they are cut into several individual ones with razor blade. (See Fig. 3.10)
39
3.2 Assembly and Components of micro PEMFC
3.2.1 Components of Micro PEMFC
For a Micro PEMFC, its components include Membrane Electrode Assembly (MEA), Gas Diffusion Layer (GDL), Current collector slices, Flow field plate, and Acrylic plate. Some of them have to be done extra works. For examples, the flow field plates need to be drilled gas inlet and outlet before assembly, and the acrylic plate in air-breathing cell needs an extra hole for natural convection. These components are shown in Figs. 3.11, and 3.12.
3.2.2 MEA and GDL
The MEA used is manufactured by the Asia Pacific Fuel Cell Technologies. Fig. 3.11 shows the picture of the MEA and GDL. Its specifications are listed in Table 3.3.
Table 3.3 The properties of MEA
MEAs DupPontTM Nafion○R
NRE-212
Anode Loading (Pt) 0.3 (mg/cm2)
Cathode Loading (Pt) 0.5 (mg/cm2)
Active area 4cm2 (2cm × 2cm)
3.2.3 Assembly of Micro PEMFC
The single micro PEMFC is assembled by bipolar plates, acrylic plates, current collector slices and membrane-electrode-assembly (MEA). The shape of the structure is like sandwich, as shown in Figs. 3.13 and 3.14. Because such micro PEMFC uses forced convection to transport oxidant (air or pure oxygen) and hydrogen, the sealing problem must be
40 treated carefully.
3.2.4 Different Shapes of Current Collector Slices
The current collector is an important parameter affecting the micro PEMFC performance, so five different shapes of current collector slices under the same open ratio (the rate of the non-conductive area and the total) are designed. The material used is gold-plated copper. (Fig. 3.15)
3.2.5 Assembly of Air-Breathing Micro PEMFC
For Air-breathing Micro PEMFC, air is used as oxidant supply and driven by natural convection on cathode side, so the cathode side does not need any flow field plates. However, the acrylic plate should be designed to match the different shapes of current collector slices, as shown in Fig. 3.16. The acrylic plate and the assembly of the micro air-breathing PEMFC single cell are shown in Figs. 3.17 and 3.18, respectively. After the comparison between the forced convection and natural one, the representative one (9-circles) among these different shapes of current collector slice is chosen to make of a stack in series.
3.2.6 Assembly of Air-Breathing Micro PEMFC stack
In this study, 4-cells planner micro PEMFC stack is taken into investigation. The PDMS flow field plates used in these four cells are fabricated by the micro molding process just like the single cell. The cathode side of acrylic plate is also designed to match the shape of current collector slices. The acrylic plate, current collector slice, and the assembly of micro air-breathing PEMFC stack are shown respectively from Fig. 3.19 to Fig.3.23.

![Fig. 1.5 Comparison of Power Densities for Bilayer and Monolithic Design [2]](https://thumb-ap.123doks.com/thumbv2/9libinfo/8116838.165753/32.892.154.738.206.969/fig-comparison-power-densities-bilayer-monolithic-design.webp)
![Table 2.1 The Five Major Types of Fuel Cells [26] Type of fuel](https://thumb-ap.123doks.com/thumbv2/9libinfo/8116838.165753/41.892.51.868.151.1063/table-major-types-fuel-cells-type-fuel.webp)