E L S E V I E R Materials Science and Engineering A214 (I996) 133-I38
M A T E R I A L S SCIENCE & ENGINEERING
A
Effect of magnesium on mechanical properties of
AlzO3/AI-Zn-
Mg-Cu metal matrix composites formed by squeeze casting
Jer-Horng Hsieh, Chuen-Guang Chao
Institute of Materiab Science and Engineering, National Chiao Tung University, Hsinchu, Taiwan
Abstract
A1203/AI-Zn-Mg-Cu composites containing 2.0 ~ 3.0 wt.% Mg in the matrix alloy have been fabricated by squeeze casting. Light microscopy, scanning electron microscopy and image analysis were used to examine and analyze the details of microstruc- ture and the fracture surface. Tensile tests were utilized to evaluate the mechanical properties. The aging behavior of the composites was studied by using differential scanning calorimetry technique and microhardness tests. The microhardness and ultimate tensile strength (UTS) of the composites increase with increasing Mg content. The maximum microhardness and UTS of the composites occur at 120 °C aging for 24 h.
Keywords: Magnesium; Mechanical properties; Squeeze casting
1. Introduction
In the last decade, a substantial amount of work has been carried out on metal matrix composites. These materials usually combine the high Young's modulus and strength of a ceramic with the ductility of a metal. Most of the alloys that are employed as matrices in metal matrix composites (MMCs) are light alloys, par- ticularly those based on aluminum such as 356 [1], 2xxx[2-5] and 6xxx [6-8] series. However, few studies have reported on the A I - Z n - M g - C u 7xxx series alloys which show the highest strength of all commercial aluminum alloys and are widely used for structural materials in military and civil aircraft. The aging behav- ior for A I - Z n - M g - C u alloys is generally recognized to take place in the following sequence [9-15]:
supersaturated solid solution ~ GP zones ~ rl'(MgZn2)
q (MgZn2)
The GP zones are coherent with the matrix; the interfacial energy is low so that small metastable parti- cles can form. The semicoherent intermediate MgZna phase, r/', has been described as having a monoclinic unit cell while the incoherent equilibrium MgZn2 phase, t7, is hexagonal.
It is recognized that aluminum matrix composites may overage if given the same aging treatment as their unreinforced parent alloy [16]. Nieh and Karlar [17] found an accelerated aging effect owing to B4C rein- forcements in a 6061 aluminum alloy matrix. They suggested that the accelerated aging is primarily owing to the high dislocation density generated from thermal mismatch between the B4C reinforcements and the alu- minum matrix, and the presence of high diffusive inter- faces in the composites. However, Stephens et al. [18] found no accelerated aging effect with large particles, which is consistent with the theory that the increase in dislocation density is inversely proportional to particle size. Dutta et al. [19] reported that the aging kinetics in cast materials is considerably slower than that in pow- der metallurgy processed materials. In addition, Bard- ban and Starke Jr. [20] reported that magnesium plays the role of a reversible vacancy trap in A I - Z n - M g alloys. High magnesium content induces a greater ex- tent of quench clustering, resulting in a large as- quenched hardness difference in alloys with only slightly different magnesium contents. Our recent study [21] also showed that higher magnesium content in- duces a larger amount of GP zones and ~l' phase formation, resulting in increased microhardness of AlzO3/AI-Zn-Mg-Cu composites. In the present
134 J, IH. Hsieh, C,-G. Chao I Materials Science and Engineering A214 (I996) 133-I38 work, magnesium was varied from 2.0 to 3.0 wt.% as an
aid to increased age hardening of MMCs (Al~O3/AI- Z n - M g - C u ) produced by squeeze casting. The aging behavior of composites was studied by using differential scanning calorimetry (DSC) technique and hardness tests. We also studied the effect of magnesium on the mechanical properties of MMCs.
2. Experimental procedure
The composite materials were produced by squeeze casting. The aluminum matrix alloys were prepared to contain 2.0, 2.4 and 3.0 wt.% Mg, respectively, by melting 7075 A1 and an AI-10 w~;.% Mg master alloy. The composition of the AI-10 wt.% Mg alloy is 10.06 wt.% Mg, 0.01 wt.% Fe and 0.03 wt.% Si. The chemical compositions of the matrix alloys analyzed by induc- tively coupled plasma-mass spectrometer (ICP-MS) are listed in Table 1.
The basis of the fabrication technique has been de- scribed in our previous study [3]. The fiber volume fraction (V f) of each composite was 0.1. The preform was preheated at 800 °C and introduced in the mold which was preheated to 300 °C. The liquid aluminum alloy at 800 °C was squeezed into fiber preform by a 40 Mpa hydraulic press to form the composites.
Microstructural characteristizaIion was carried out by using light microscopy and scanning electron mi- croscopy (SEM). Specimens were cut out from the casting as a cylindrical block 5.5 ram in diameter. Spec- imens were solution treated at 480 °C for 48 h, then quenched into water. Aging was carried out in an oil bath at 120 °C for various lengths of times from 4 to 96 h. All of the treated specimens were immediately stored in a refrigerator at - 1 5 ° C . Discs (5.5mm diameter, 1 mm thickness) for DSC were polished and weighed. DSC analysis was performed by using a Du- pont 2910 thermal analyzer. Disc samples were loaded in the DSC cell at room temperature and equilibrated for a few minutes. The heating rate was 10 °C min-1 from 50 to 450 °C. Dry nitrogen was purged through the cell at the rate of 40 ml m i n - ~ to avoid oxidation. Output for all DSC runs was recorded in the instru- mental memory. At least three samples were measured for each heat treatment. In order to evaluate the peak area of the DSC curve, the DSC scan of a sample was
= = : ~ = = .~ I I . t " ~ # . , ,=~,.. i o ," ,~1
t . . i s , , . i ~i ~, 1~, ~ ' "~. \ , ~ ,, '. 5 /
"-etr
4
:,2
"z*-o-%-
, 4 IFig. I. 3-D light micrograph of the composite.
interrupted just as the r/' formation reaction was finish- ing, and the DSC scan of the sample was run again as a baseline, A Vickers microhardness measurement on the matrix (between fibers) of heat-treated specimens was made using a diamond pyramid indenter and 50 g load. At least ten hardness measurements were made for each aging condition to ensure accurate results. Tensile specimens were machined to a gauge length of 13 mm with a cross-section of 2 mm x 4 mm. The ten- sile tests were carried out with an Instron machine with a 3 x I0-4 s - 1. The fracture surfaces were examined by SEM.
3. Results
3.1. Mierostrueture
Fig. 1 shows a 3-D light micrograph of the com- posite. The fibers were randomly distributed in the composite. Fig. 2 shows an etched light micrograph of "heat 3" in the Table 1 in the as-cast condition (a) the monolithic alloy and (b) the composite, Both materials have segregation in dendrite interstices. The dendrite arm spacing of the composite (about 12 gm) is smaller than that of the monolithic alloy (about 20 gm). It is suggested that A1203 fibers acted as obstacles during solidification.
3.2. D S C
Table I
Composition of the matrix alloys
Heat No. Mg (wt.%) Zn (wt.%) Cu (wt.%) AI (wt.%)
Heat 1 3.02 5.47 1.49 Bal
Heat 2 2.39 5.54 1.49 Bal
Heat 3 2.00 5.46 ~.48 Bal
3.2.1. Sohttion treatment
For comparison purposes, results from DSC scans of composites with 2.0 ~ 3.0 wt.% Mg quenched into wa- ter are shown in Fig. 3. The curve from the composite shows three regions: an exotherm between 75 °C and 140 °C owing to the dissolution of GP zones and pre- cipitation of r/' precursors (region 1); three exotherms
Y.-H. Hsieh, C.-G. Chao / Materials Science and Enghwering A214 (1996) 133-I38 135
~,~ . '~ .~
'~l 200 . m
._ol
Fig. 2. Etched light micrographs of the as-cast materials (a) Al-Zn- Mg-Cu alloy (2.0 wt.% Mg) (b) 0.1 V r composite.
between 140 °C and 300 °C (region 2) owing to the ~1' phase formation (peak A), the superimposed reactions of t/' dissolution and I/ formation (peak B) and tl precipitate growth (peak C); and an endotherm between 300 °C and 450 °C owing to the dissolution of 71 precip- itate (region 3). The result is similar to the previous DSC work in 7xxx A1 alloys [14,15]. ~ 0 hr
- -
I[, ~ 48 h r ~ t60 260 36o 4o'0 500 Temperature (%)Fig. 4. Results of the DSC for solution treated composite (2.0 wt.%
Mg) artificially aged at 120 °C for various aging times. Peak B: q'
phase dissolution + r 1 phase formation peak C: ~l phase growth.
3.2.2. Isothermal artificial aghzg
The results (Fig. 4) of DSC measurements on the composite (2.0 wt.% Mg) quenched from 480 °C into water and artificial aged at 120 °C for various aging periods (4, 16, 24, 48 and 96 h) indicate that peak B becomes progressively less and peak C becomes pro- gressively more prominent with increasing in aging time. A similar trend was found in Figs. 5 and 6 for both 2.4 and 3.0 wt.% Mg composites, respectively.
3.3. Mechanical properties 3.3. I. Tensile properties
The Ultimate Tensile Strength (UTS) responses of the composites with 2.0 ,-, 3.0 wt.% Mg as a function of aging time are shown in Fig. 7. All of the composites have the maximum value of UTS at aging for 24 h. The UTS of the composites increases with increasing Mg
t
= region 1 '~ ca 50 100 150 vB [ "~ 1 ~ Mg : 3,0wt % [ ~"~, ~ [ ... M~,2,~t% I ,'l~ i \ / Mg.2,o~,o' y"-"b"--'
/f' i/ region 2 ~ region 3 200 250 300 350 400 Temperature ("C) 450Fig. 3. Results of the DSC for solution treated composites with various Mg contents. o,
f
.Ri
~ h r
_ _ ~ 16hr ~ 48 hr /10;
2&
3&
4'0o
500 Temperature (°C)Fig. 5. Results of the DSC for a solution treated composite (2.4 wt% Mg) artificially aged at I20 °C for various aging times.
136 J.-H. Hsieh, C.-G. Chao / Materials Science and Engineering A214 (I996) I33-138
_ _ ~ . . _ . _ _ _ _ . _ 24 hr . _ ~
i~ 200 3(~ 400
Temperature (°C) 500
Fig, 6. Results of the DSC for a solution treated composite (3.0 wt,% Mg) artificially aged at 120 °C for various aging times,
content. Fig. 8 shows the elongation vs. aging time. The elongation of the composites is about 1 ~ 2%. However, that of the samples with solution treatment is about 3 ~ 5%.
3.4. M a t r i x microhardness
Fig. 9 shows the relationship between microhardness and aging time of the composites with various Mg content. It is assumed that the age-hardening treatment affects only the matrix properties. According to this investigation, the microhardness of the matrix in the composites displays the effect of Mg content on the aging characteristics of composite'. The microhardness of the matrix at peak hardness (aged at 120 °C 24 h) increases with increasing Mg content.
"-" 4 e,.o Composite Mg c o n t e n t • 3.0 wt% • 2.4 wt% • 2.0 wt% • • Q
•
!
!
i0 I00 Aging &he (hr)Fig, 8. Relationship between elongation and aging time &composites with various Mg contents,
4. Discussion
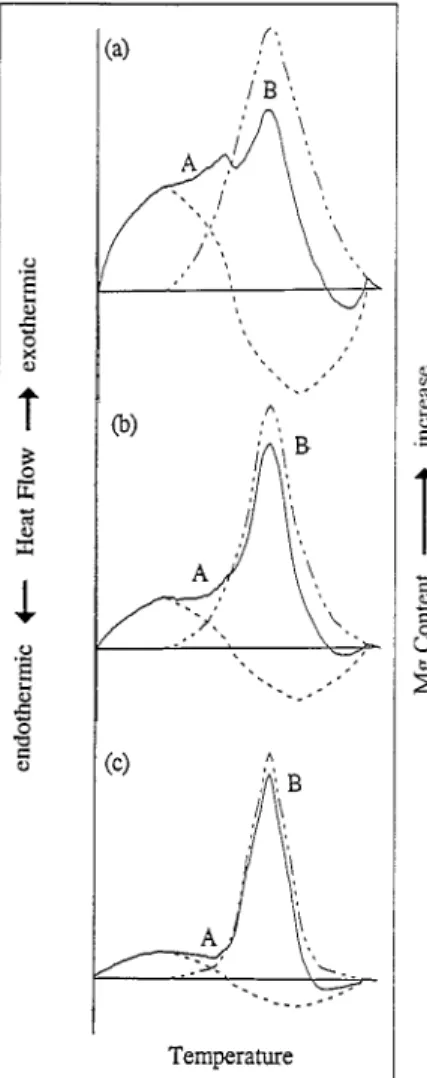
The curves in Fig. 3 show that the enthalpy of ~1' phase formation (peak A) is significantly different. The difference of these curves is owing to superimposed phenomena. Fig. 10 shows a schematic model to ex- plain this difference. The basic assumptions are as follows:
(1) Only ~l' phase formation,
~l'
phase dissolution, ~l phase formation and r/ phase growth occur in re- gion 2. Q. v o5 D,oo I
400 300 200 100iite M'c°n nt
--- - - 3 . 0 wt% 2.4 wt% 2.0 wt% ' ' ' ' ' ; " i ' ' ' ' ' ' " i 0 I0 I00 Aging time (hr)Fig, 7. Relationship between UTS and aging time of composites with various Mg contents. 9 2OO-- 160- 120 - 80 / l w - - - ' ~ _ . ~ / . N "~ / . / /' / / a, / ,~ . . ~ Composite Mg c o n t e n t
/ / " /
• 3,0 b . ) . / ~ 2 , 4 wt% • 2.0 wt% , I , , , ,,i I , ., ~ , , ,i, i 0 I0 I00 A~g time ~ )Fig. 9, Relationship between microhardness and aging time of com- posites with various contents.
J.-H. Hsieh, C.-G. Chao / Materials Science and Engineering A214 (1996) I33-138
I37
(a) f', / B ' /'\,,
,' ),~ (b) ..', /' '1 A ' '\ (C) ,^, Temperaturel
oFig. 10. Schematic model of DSC curve superimposed condition. (2) The Mg solute atom in A1, which has a strong
binding force with vacancies, may assist the precip- itate process [12]. The amount of ~f phase increases with increasing Mg content.
(3) The area of the r/' phase formation peak in the DSC curve is equal to that of the r/' phase dissolu- tion peak.
The dotted line in Fig. 10 represents the peaks before the superimposed condition. The solid line is the final curve after the superimposed condition. Fig. 10 shows that peak A shifts to higher temperature but peak B shifts to lower temperature with increasing Mg content. It also shows that the peak value of peak A is increased and the peak value of peak B is decreased with increas- ing Mg content. The result is very close to that shown in Fig. 3. This indicates that the amount of ~f phase formation increases with increasing Mg content. Fig. 4 ~ 6 show the results of DSC measurements on com- posites with 2.0 ~ 3.0 wt.% Mg content for various aging periods. The r/' phase formation peak (peak A) disappears after artificial aging for 4 h, and an en- dotherm peak occurs between 140°C and 220°C, which is the ~l' phase dissolution peak. During the same time, the value of peak B (r/' phase dissolution + ~l
phase formation) progressively decreases and that of peak C (~1 phase growth) progressively increases.
When the aging time is more than 24 h, the value of peak C is larger than that of peak B, i.e. the amount of r] phase growth is larger than that of ~l phase forma- tion. This indicates that the composites are overaging beyond an aging time of 24 h. These results also match Figs. 7 and 9. The maximum microhardness (Mg 3.0 wt.%, Hv = 181; Mg 2.4 wt.%, Hv = 169; Mg 2.0 wt.%, Hv = 154) and UTS (Mg 3.0 wt.%, 520 Mpa; Mg 2.4 wt.%, 468 MPa; Mg 2.0 wt.%, 429 MPa) of the com- posites occurred at 120 °C aging for 24 h. Fig. 11 shows an SEM image of the broken fiber area of the com- posite. The fracture surface of the composite shows broken fibers within the dimple. This observation indi- cates that the bonding between the matrix and the fibers is good. However, microshrinkage porosity is observed in an SEM fractograph of the composites (see Fig. 12). Since the applied pressure (40 Mpa) is not high enough to eliminate the microshrinkage, the elon- gation of the composites is less than 2%.
5. Conclusion
In our present study, the Mg content from 2.0 to 3.0 wt.% affects the mechanical properties of AI203/Al- Z n - M g - C u composites. The results are summarized as follows:
q
J
Fig. II. SEM image of the broken fiber area of the composite (3.0% Mg) (a) solution treatment (b) aged 96 h.
138 J.-H. Hsieh, C.-G. Chao / Materials Science and Engineerhzg A214 (1996) 133-138
J~ .,,,~/./,, ,qLrV.~.'~. ', J,.-.. :,,_.,.-,~
Fig. 12. (a) SEM fractography of the coraposite (b) enlarge area of microshrinkage.
(1) T h e m i c r o h a r d n e s s a n d U T S o f the c o m p o s i t e s increases with increasing M g content.
(2) T h e m a x i m u m U T S o f the c o m p o s i t e s occurred at 120 °C aging for 24 h. ( M g 3.0 wt.%, 520 M p a ; M g 2.4 wt.%, 468 M P a ; M g 2.0 wt.%, 429 M P a ) (3) T h e m a x i m u m m i c r o h a r d n e s s o f the c o m p o s i t e s
occurred at t20 °C aging for 24 h. ( M g 3.0 wt.%, H v = 181; M g 2.4 wt.%, H v = 169; M g 2.0 wt.%, H v = 154)The elongation o f the c o m p o s i t e s is a b o u t 3 % , - - 5 % after solution t r e a t m e n t and is a b o u t 1% ~ 2% after aging treatment.
Acknowledgements
The authors are pleased to acknowledge financial support of this research by National Science Council, Taiwan, under Grant NSC 82-0405-E-009-410.
References
[1] L. Wei and J.C. Huang, Mater. Sci. Technol,, 9 (1993) 841-852.
[2] P.G. Karandikar and T.W. Chou, J. Mater. Sci,, 26 (1991)
2573-2578.
[3] K.C. Chen and C.G. Chao, Met. Mater. Trans. A, 26,4 (1995)
1035-1043.
[4] T. Christman and S. Suresh, Acta Metall., 36 (7) (1988) 1691-
1704.
[5] H. Jeong, D.K. Hsu, R,E. Shannon and P,K. Liaw, Met. Mater.
Trans. A, 25,4 (1994) 799-809.
[6] C.C. Perng, J.R. Hwang and J.L. Doong, Mater. Sei. Eng., A17I
(1993) 213-221.
[7] D.J, Towle and C.M. Friend, J. Mater. Sei., 27 (1992) 2781-
2791.
[8] L. Salvo and M. Suery, Mater. Sci. Eng., A177 (1994) 19-28,
[9] N.C. Danh, K. Rajan and W. Wallace, Metall. Trails. A, I4,4
(I983) 1843-1850.
[10] P. Bardhan and E.A. Starke Jr., J. Mater. Sei., 3 (1968) 577-
583.
[11] P.N. Adler and R. Delasi, Metall. Trans. A, gA (1977) 1185-
1190.
[12] J.D. Embury and R.B. Nicholson, Acta Metall., 13 (1965) 403-
417.
[13] E. Donoso, Mater. Sei. Eng., 74 (1985) 39=46,
[14] D.J. Lloyd and M. C. Cbaturvedi, J. Mater, Sei,, (1982) 1819-
1824.
[15] J.L. Petty-Galls and R.D. Goolsby, J. Mater. Sei., 24 (1989)
1439-1446,
[16] M. Vogelsang, R.J. Arsenault and R.M. Fisher, Metall. Trans.
A, I7A (1986) 379-389.
[17] T.G. Nieh and R.F. Karlak, Set. Metall., 18 (1984) 25-28.
[18] J.J. Stephens, J.P. Lucas and F.M. Hoskirlg, Set. Metall., 22
(1988) 1307-1312.
[19] I. Dutta and D.L. Bourell, Mater. Sei. El~g., A112 (1989) 67.
[20] G. Honyek, I. Kovacs, J. Lendai, Ng-huy-sinh, T. Ungar, H.
Loftier and R. Gerlach, J. Mater. Sei., 16 (1981) 2701-2709.
[21] M.C. Chou and C.G. Chao, Met. Mater. Trans. A,, accepted for