Influence of PMMA-Chain-End Tethered Polyhedral Oligomeric
Silsesquioxanes on the Miscibility and Specific Interaction with
Phenolic Blends
Chih-Feng Huang,†Shiao-Wei Kuo,*,†Fang-Ju Lin,†Wu-Jang Huang,‡ Chih-Feng Wang,†Wen-Yi Chen,§ and Feng-Chih Chang†
Institute of Applied Chemistry, National Chiao Tung UniVersity, Hsin Chu, Taiwan; Department of EnVironmental Science and Engineering, National Ping-Tung UniVersity of Science and Technology, Ping-Tung, Taiwan; and Department of Chemical Engineering, Yunlin UniVersity of Science and Technology, Yunlin 640, Taiwan
ReceiVed September 4, 2005; ReVised Manuscript ReceiVed October 26, 2005
ABSTRACT: Two different molecular weights of poly(methyl methacrylate) (PMMA) and PMMA containing polyhedral oligomeric silsesquioxane (PMMA-POSS) homopolymers have been prepared via the atom transfer radical polymerization (ATRP) technique. The miscibility and specific interaction behaviors of PMMA-POSS and PMMA with phenolic resin were investigated by differential scanning calorimetry and Fourier transform infrared spectroscopy (FTIR). FTIR results reveal that at least three competing equilibriums are present in the phenolic/PMMA-POSS blend: self-association of phenolic (hydroxyl-hydroxyl), hydroxyl-siloxane inter-association between phenolic and POSS, and hydroxyl-carbonyl interinter-association between phenolic and PMMA. Among these blends, single and higher Tgs of these phenolic/PMMA-POSS blends were observed than the corresponding phenolic/PMMA blends at same composition, revealing that a stronger interassociation interaction of hydroxyl-siloxane than the hydroxyl-carbonyl interaction. Furthermore, we also found the screening effect in phenolic/LPMMA-POSS blends that tends to significantly decrease the hydrogen bond formation of the hydroxyl-carbonyl interassociation.
Introduction
Recently, investigation of nanocomposites based on the hybridization of inorganic materials and organic polymers on a molecular scale has increased dramatically with the rapid growth of nanoscale technologies.1 Nanocomposites, combining the
important properties from inorganic materials and organic polymers, can create new unique properties such as high gas barrier,2solvent resistance,3flame resistance properties, and so
on. Polyhedral oligomeric silsesquioxane (POSS) is a new type of material capable of forming various nanocomposites. Proper-ties of POSS are unique since one or more of the organic groups can be functionalized for polymerization, while the remaining unreactive groups are able to solubilize the inorganic core and allow for control over the interfacial interactions occurring between the POSS and the polymer matrix. POSS units can be incorporated into virtually all types of polymers either by blending,4,5grafting, or copolymerization reactions6-9and results
in enhancements on polymer properties, such as increased thermal stability, reduced flammability, and dielectric constant. Because of their advantageous performance relative to the nonhybrid counterparts, POSS-polymer hybrid materials have attracted great interest recently.10-18
Phenolic/poly(methyl methacrylate) blend is a well-known example of the miscible blend system, and the nature of phase behavior and miscibility in phenolic/PMMA blends have been extensively studied.19,20The miscibility of polymer blends is
commonly ascertained through the measurements of glass transition temperatures (Tg) by differential scanning calorimetry
(DSC). Moreover, FT-IR and NMR spectroscopies are also powerful tools for characterizing detailed structures of polymers and their specific interactions because these features affect local electron densities and resulted in frequency shifts.21-24Recently,
two-dimensional infrared (2D-IR) correlation spectroscopy has been applied widely in polymer science.25-27This novel method
is able to detect the specific interactions between polymer chains by treating the spectral fluctuations as a function of perturbation, such as time, temperature, pressure, and composition. 2D-IR correlation spectroscopy is able to differentiate intra- and intermolecular interactions through the analysis of selected bands from the one-dimensional vibration spectrum.28,29
In this article, we would like to extend our previous study4,19,30,31to the inorganic-organic polymer hybrids
involv-ing a POSS moiety at the chain end synthesized by atom transfer radical polymerization (ATRP), which has been shown to be a versatile technique for the controlled polymerization of many monomers since 1995.32-34 These well-defined PMMA and
PMMA-POSS homopolymers were prepared via ATRP with designed molecular weights (ca. 1× 10⁴and 3× 10⁴g/mol).
Both PMMA-POSS and PMMA were then blended with phenolic resin. It is of particular interest to see the POSS chain-end effect on thermal properties, miscibility behavior, and hydrogen-bonding interactions of the phenolic/PMMA blends. Experimental Section
Materials and Syntheses of the POSS-Cl Initiator. Isobutyl-trisilanol-POSS was obtain from Hybrid Plastics Co. and was used as received. Methyl methacrylate (MMA) monomer was distilled from the calcium hydride and stored under N2. Copper(I) bromide (CuBr) was purified by washing with glacial acetic acid overnight, followed by absolute ethanol and ethyl ether, and then dried under vacuum. Amberlite IR-120 (H form) cation-exchange resin, anisole, N,N,N′,N′′,N′′-pentamethyldiethylenetriamine (PMDETA), methyl †National Chiao Tung University.
‡National Ping-Tung University of Science and Technology. §Yunlin University of Science and Technology.
* To whom correspondence should be addressed.
10.1021/ma051923n CCC: $33.50 © 2006 American Chemical Society Published on Web 12/13/2005
2-bromopropionate (MBP), triethylamine (TEA), and trichloro[4-(chloromethyl)phenyl]silane were all used as received. All solvents were distilled prior to use.
We used the corner-capping reaction to prepare POSS-Cl initiator in which only one corner is functionalized with an atom transfer radical polymerizable group (Scheme l). The initiator, POSS-Cl, was prepared by reacting trichloro[4-(chloromethyl)phenyl]silane (1.00 mL, 5.61 mmol) with isobutyltrisilanol-POSS (4.05 g, 5.11 mmol) in the presence of triethylamine (2.20 mL, 15 mmol) in 30.0 mL of dry THF under argon. The reaction flask was stirred at room temperature for 7.5 h, followed by filtration to remove the HNEt3 -Cl byproduct. The clear THF solution was dropped into a beaker of acetonitrile and rapidly stirred. The resulting product was collected by filtration and dried in a vacuum. (4.61 g, 80%).1H NMR (CDCl3),δ: 7.59 (d, 2H), 7.33 (d, 2H), 4.52 (s, 2H), 1.92-1.62 (m, 7H), 1.09-0.85 (m, 42H), 0.75-0.48 (m, 14H).
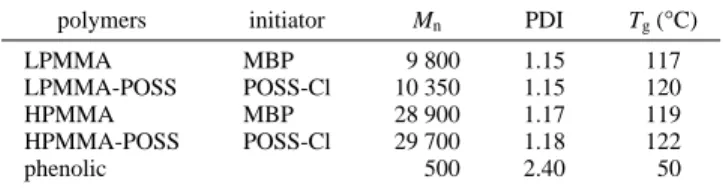
Syntheses of Polymers. To prepare the PMMA-POSS ho-mopolymers, the atom transfer radical polymerization with CuBr/ PMDETA was carried out (Scheme 1).The molecular weights of PMMA-POSS (Mn) 10 350 g/mol and Mn) 29 700 g/mol) were determined by GPC. In accordance with the controlled polymeri-zation characteristics of ATRP, the resulted LPMMA-POSS (Mn ) 10 350 g/mol) homopolymer has narrow polydispersity (PDI ) 1.15), and that of the HPMMA-POSS (Mn) 29 700 g/mol) has also a narrow molecular weight distribution (PDI ) 1.18). Similarly, the PMMA homopolymers were also prepared by ATRP with methylDL-2-bromopropionate monofunctional initiator. The mo-lecular weights of PMMA (Mn ) 9800 g/mol and Mn) 28 900 g/mol) were also determined by GPC. The polydispersity of the LPMMA (Mn ) 9800 g/mol) and the HPMMA (Mn ) 28 900 g/mol) are 1.15 and 1.17, respectively. The phenolic resins was synthesized with sulfuric acid via a condensation reaction and with average molecular weights of Mn ) 500 g/mol and Mw) 1200 g/mol that was described in the previous study.35 Chemical structures of PMMA and phenolic resin are shown in Scheme 2. Symbols and characterizations of these above-mentioned polymers are summarized in Table 1.
Blend Preparations. Desired composition containing PMMA or PMMA-POSS and phenolic was dissolved in THF at a concentration of 5 wt % and stirred for 6-8 h. The solution was allowed to evaporate slowly at 25°C for 1 day on a Teflon plate and dried at 90°C for 3 days to ensure total elimination of the solvent.
Differential Scanning Calorimetry (DSC). Thermal analysis was carried out on a DSC instrument from the DuPont (model 910 DSC-9000 controller) with a scan rate of 20 °C/min and a temperature range of 30-170°C in a nitrogen atmosphere. An ∼5-10 mg sample was weighted and sealed in an aluminum pan. The sample was then quickly cooled to room temperature from the first scan and then scanned between 30 and 280°C at a scan rate of 20 °C/min. The glass transition temperature is taken as the midpoint of the heat capacity transition between the upper and lower points of deviation from the extrapolated glass and liquid lines.
FT-IR and 2D-IR Spectra. FT-IR measurement was made using a Nicolet Avatar 320 FT-IR spectrometer; 32 scans at a resolution of 1 cm-1 were collected with a NaCl disk. The THF solution containing the sample was cast onto a NaCl disk and dried under condition similar to that used in bulk preparation. The sample chamber was purged with nitrogen in order to maintain the film dryness. 2D correlation analysis was performed using “Vertor 3D” software supplied by Bruker Instrument Co. All the spectra applied to the 2D-IR correlation analysis were normalized and negative intensities of auto peaks or cross-peaks in 2D-IR correlation spectra are indicated by shaded regions; positive intensities are indicated by unshaded regions. Synchronous 2D-IR spectra were used to study the specific interactions in these blends.
Results and Discussion
DSC Analyses. The conventional second run DSC thermo-gramsof LPMMA (Mn) 9800 g/mol) or LPMMA-POSS (Mn ) 10 350 g/mol) and phenolic blends with various weight ratios
are shown in parts a and b of Figure 1, respectively. All blends show a composition-dependent single Tg, indicating that these
blends are all fully miscible. Generally, if the Tg-composition relationship is deviated obviously, neither a linear relationship nor the ideal rule of Fox is applicable.36It has been generally
suggested that the Tg relationship to the composition of the
miscible polymer blends follows the Kwei equation:37
where W1and W2are weight fractions of the components, Tg1
and Tg2represent the corresponding glass transition temperatures,
Scheme 1. Synthetic Route To Prepare PMMA-POSS and PMMA Polymers
Tg)W1Tg1+ kW2Tg2
and k and q are fitting constants. The q is a parameter corresponding to the strength of specific interactions in the blend, reflecting a balance between the breaking of the self-association and the forming of the interself-association interactions. As shown in Figure 2, we can obtain k ) 1 and q ) 35 from phenolic/LPMMA-POSS blends and k ) 1 and q ) -37 from phenolic/LPMMA blends using the nonlinear least-squares “best fit” values. These phenolic/LPMMA-POSS blends resulted in
positive deviation while phenolic/LPMMA blends result in negative deviation comparing with that predicted by linear rule, but both show positive deviation by the Fox rule. This result reveals that the incorporation a small amount of POSS on the PMMA chain end significantly shifts thermal properties of the phenolic/LPMMA blend due to stronger interassociation interac-tion exists between LPMMA-POSS and the phenolic resin than that of the phenolic/LPMMA. In higher molecular weight PMMA blend systems, the conventional second run DSC thermograms of HPMMA (Mn) 28 900 g/mol),
HPMMA-POSS (Mn) 29 700 g/mol), and their blends with phenolic are
shown in Figure 3a,b. Similarly, k ) 1 and q ) 22 for the phenolic/HPMMA-POSS blend and k ) 1 and q ) -36 for the phenolic/HPMMA blend were obtained on the basis of the Kwei equation, as shown in Figure 4. Again, the strong Scheme 2. Schematic Diagram Showing Types of Interaction between PMMA and Phenolic
Table 1. Summary of Symbols and Characterizations of Polymers
polymers initiator Mn PDI Tg(°C)
LPMMA MBP 9 800 1.15 117
LPMMA-POSS POSS-Cl 10 350 1.15 120
HPMMA MBP 28 900 1.17 119
HPMMA-POSS POSS-Cl 29 700 1.18 122
phenolic 500 2.40 50
Figure 1. DSC thermograms of phenolic blends with either LPMMA or LPMMA-POSS with different compositions (weight ratio).
Figure 2. Tgvs composition curves based on (a) the Fox rule, (b) the
linear rule, (c) the Kwei equation for the LPMMA-POSS system, and (d) the Kwei equation for LPMMA system: (b) experimental data of LPMMA-POSS blends; (9) experimental data of LPMMA blends.
interassociation interaction between HPMMA-POSS and phe-nolic resin is responsible for the observed positive deviation, implying that the incorporation of the POSS chain end into the higher molecular weight PMMA also affects the interaction between PMMA and phenolic resin. We will quantitatively analyze this influence in later FT-IR analyses. The q value of phenolic/HPMMA blends is -36 and -37 for phenolic/ LPMMA, indicating that the self-association interaction of the phenolic resin is stronger than the interassociation interaction between PMMA and phenolic resin while the effect of PMMA molecular weight is insignificant. The obtained results of the phenolic/PMMA blend are quite agreeable with previous literature.19
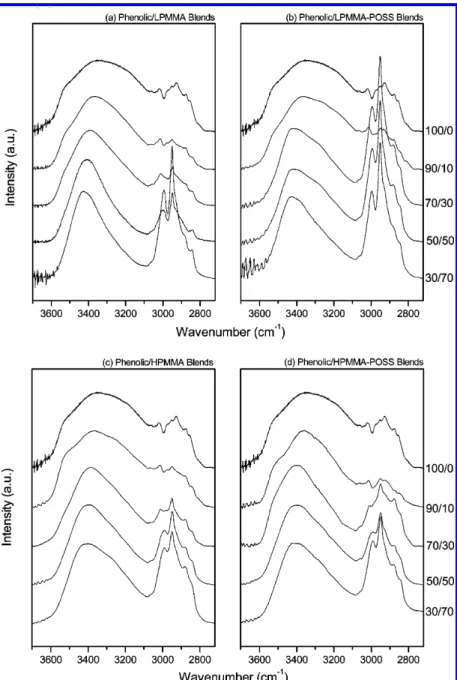
FT-IR Spectra. Chemical structures of PMMA and phenolic are shown in Scheme 2, showing IR vibrations of the free and hydrogen-bonded carbonyls of the PMMA with phenolic. Figure 5 shows the scale-expanded infrared spectra in the hydroxyl-stretching region of various compositions of phenolic/PMMA-POSS blends (Figure 5b,d) and phenolic/PMMA blends (Figure 5a,c) at room temperature. The spectrum of the pure phenolic resin shows a broad band at 3350 cm-1and a shoulder at 3525 cm-1, corresponding to the multimer hydrogen-bonded hydroxyl groups and the free hydroxyl groups, respectively. The intensity of the free hydroxyl bands decreases with the increase of the
PMMA-POSS or the PMMA content in these blends. It is expected that great fraction of these “free” OH groups is consumed by forming the interassociation hydrogen bonds in these blends. In phenolic/PMMA blends, the band (at ca. 3420 cm-1) appears with the increase of the PMMA content as the result of the decrease in the free hydroxyl band. Therefore, it is reasonable to assign this band at 3420 cm-1 as the hydroxyl group bonded to the carbonyl group. In addition, the spectra in the 2700-3700 cm-1region from these blends with PMMA-POSS are broader and more asymmetric than the corresponding blends with PMMA. Meanwhile, we also observe a shoulder at 3325 cm-1, corresponding to the hydroxyl-siloxane interac-tion.39This phenomenon depicts a new distribution of
hydrogen-bonding formation resulting from the competition between hydroxyl-hydroxyl (3350 cm-1), hydroxyl-carbonyl (3420 cm-1), and hydroxyl-siloxane (3325 cm-1) interactions. Cole-man et al. compared the frequency difference (∆ν) between the
hydrogen-bonded hydroxyl absorption and the free hydroxyl absorption to access the average strength of the intermolecular interaction.38Therefore, the hydroxyl-hydroxyl self-interaction
is clearly stronger than the hydroxyl-carbonyl interassociation from Figure 5a,c for phenolic/PMMA blends. These results are consistent with the negative q value of the phenolic/PMMA blend obtained from the Kwei equation. It is interesting to notice that the hydroxyl-siloxane interaction is even stronger than the hydroxyl-hydroxyl interaction and that is reasonable for the positive q value of phenolic/PMMA-POSS blends. The POSS moiety plays the role of nanocage to enhance the Tgwith various
content.31Now we turn our attention to Figure 5b,d, the spectra
of Figure 5b corresponding to blends of LPMMA-POSS which are broader and more asymmetric than those blends with LPMMA. A shoulder corresponding to the hydroxyl-siloxane interaction appears at 3325 cm-1, suggesting that competitive hydrogen-bonding formations exist between hydroxyl-hy-droxyl, hydroxyl-carbonyl, and hydroxyl-siloxane, while the hydroxyl-siloxane is more favorable. The spectra of Figure 5d do not show the shoulder and asymmetric pattern, which is similar to the spectra of phenolic/HPMMA blends of Figure 5c, indicating that most hydrogen-bonding interactions come from the hydroxyl-carbonyl.
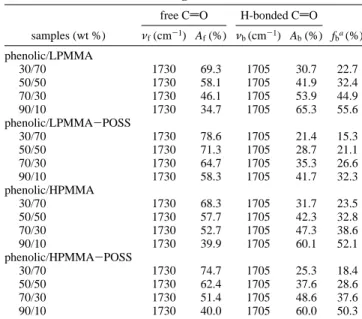
Figure 6 shows the infrared spectra of the carbonyl stretching measured at room temperature ranging from 1670 to 1780 cm-1 for different compositions of the phenolic/PMMA blends (Figure 6a,c) and phenolic/PMMA-POSS blends (Figure 6b,d). For the MMA unit, the IR carbonyl stretching absorptions by free and hydrogen-bonded carbonyl groups are at 1730 and 1705 cm-1, respectively.24It clearly shows that the fraction of
hydrogen-bonded carbonyl in the phenolic/PMMA system is greater than that of the phenolic/PMMA-POSS system as shown in Figure 6, especially in the lower molecular weight PMMA system. A routine procedure of least-squares curve fitting can be applied to the carbonyl stretching region using two Gaussian bands, and a quantitative measure of the fraction of “free” carbonyl groups can be readily determined using the value of absorptivity coefficient 1.5, which is the ratio of these two bands, the free and hydrogen-bonded carbonyl groups in an ester group.40,41
The parameters of the infrared carbonyl band are summarized in Table 2, where the hydrogen-bonded carbonyl fraction of PMMA-POSS or PMMA increases with the increase of the phenolic content. According to Figure 6 and Table 2, we can determine that the fraction of hydrogen-bonded carbonyl under similar composition is in the order phenolic/LPMMA > phenolic/HPMMA ∼ phenolic/HPMMA-POSS > phenolic/ LPMMA-POSS. Indeed, the PMMA tethered with POSS
chain-Figure 3. DSC thermograms of phenolic blends with either HPMMA or HPMMA-POSS with different compositions (weight ratio).
Figure 4. Tgvs composition curves based on (a) the Fox rule, (b) the
linear rule, (c) the Kwei equation for HPMMA-POSS system, and (d) the Kwei equation for HPMMA system: (b) experimental data of HPMMA-POSS blends; (9) experimental data of HPMMA blends.
end changes the interaction between phenolic and PMMA, especially in lower molecular weight PMMA systems.
2D-IR Correlation Analyses. To further understand the influence on Tgand the order of the hydrogen-bonded carbonyl
fraction in these POSS-containing polymer hybrids, the char-acterization of 2D-IR correlation spectra of these blends was carried out. Figure 7a-c shows the synchronous 2D-IR cor-relation maps of phenolic/PMMA and phenolic/PMMA-POSS blends in the range of 1200-1800 cm-1. The molecular weight of PMMA shown in Figure 7 is about 10 000 g/mol. Bands in Figure 7a are mainly 1750 cm-1 for the carbonyl group of PMMA and 1510 cm-1for the phenyl-OH group of the phenolic resin. Two strong auto- and cross-peaks appear between 1510 and 1750 cm-1, indicating the specific interactions between these two groups. Figure 7c shows the effect of POSS presence where the intensity of auto- and cross-peak at 1510 cm-1 from the phenyl-OH group of the phenolic resin becomes weaker after the POSS incorporating into the chain end of PMMA. This result demonstrates that the bulky POSS end group may play a physical constraint for the conformation of the phenolic resin. Therefore, the flipping motions of phenyl-OH rings on the
phenolic resin have a larger external perturbation angular frequency (∼180°). The reduced cross-correlation function (X(τ)) was proposed by Noda:25
In eq 2, the terms,Φ(ν1,ν2) andΨ(ν1,ν2) are regarded as the
real and imaginary parts of the function and are referenced as the cross-peak intensities in asynchronous and synchronous correlation maps. ω is the external perturbation angular
fre-quency. In the case ofω ) 180, the cos(ωτ) equals zero and
sin(ωτ) equals -1.0. Therefore, we expect to obtain the weakest
cross-peak intensity in synchronous correlation maps. Peaks corresponding to the Si-O-Si group of the POSS shown in parts b and c of Figure 7 are at 1250 and 1100 cm-1, respectively. Both of these peaks possess a weak autopeak, indicating that the presence of POSS is in very low concentration in these blends. The entanglement molecular weight of PMMA is ca. 20 000 g/mol.42,43In the following case, as shown in Figure
8a,b, we demonstrate the behavior of POSS in the phenolic/ PMMA blend in which the molecular weight of PMMA is above
Figure 5. FT-IR spectra recorded at room temperature in the 2700-3700 cm-1region of phenolic blends with either PMMA or PMMA-POSS with different compositions (weight ratio).
its entanglement molecular weight at about 30 000 g/mol. Figure 8a has a similar pattern as Figure 7a but shows stronger cross-peaks at several positions: 1750-1510, 1420, and 1510-1200 cm-1. The 1200 and 1420 cm-1correspond to the methyl group and the C-O of PMMA, respectively. Figure 8b also has a similar pattern as Figure 7b. This observation indicates that increasing of the molecular weight of PMMA gives greater interassociation interaction of hydroxyl-carbonyl in the phenolic/ PMMA blend, similar to above-mentioned results. The incor-poration of POSS into PMMA as chain end tends to decrease the interassociation interaction of the hydroxyl-carbonyl be-tween PMMA and phenolic resin from the relatively lower molecular weight of PMMA. When the molecular weight of PMMA is above its entanglement molecular weight, the effect of POSS on the interassociation interaction of hydroxyl-carbonyl between PMMA and phenolic resin becomes insig-nificant.
Specific Interactions Analyses. In our previous study,4,39we
have confirmed the existence of a specific interaction between the siloxane of the POSS moiety and the hydroxyl of the phenolic. To further investigate the above-mentioned phenom-enon, an association model extended to ternary component system has been applied to this phenolic/PMMA-POSS blend. According to the Painter-Coleman association model (PCAM),21
we designate B, A, and C as phenolic, PMMA, and POSS,
respectively, and K2, KB, KA, and KC as their corresponding
association equilibrium constants.
These four equilibrium constants can be expressed as follows in terms of volume fractions
where
ΦB,ΦA, andΦCare the volume fractions of repeat units in the blend,ΦB1,ΦA1, andΦC1are the volume fractions of isolated units in the blend, and rA ) VA/VB and rC ) VC/VB are the
ratios of segmental molar volumes.
The self-association constants of phenolic resin (K2) 23.3
and KB ) 52.3) and the interassociation constant between
phenolic resin and POSS (KC) 38) have been determined in
Figure 6. FT-IR spectra recorded at room temperature in the 1675-1780 cm-1region of phenolic blends with either PMMA or PMMA-POSS with different compositions (weight ratio).
Table 2. Carbonyl Group Curve-Fitting Results of the PMMA or Phenolic/PMMA-POSS Blends with Two Different Molecular
Weightsa
free CdO H-bonded CdO samples (wt %) νf(cm-1) Af(%) νb(cm-1) Ab(%) fba(%) phenolic/LPMMA 30/70 1730 69.3 1705 30.7 22.7 50/50 1730 58.1 1705 41.9 32.4 70/30 1730 46.1 1705 53.9 44.9 90/10 1730 34.7 1705 65.3 55.6 phenolic/LPMMA-POSS 30/70 1730 78.6 1705 21.4 15.3 50/50 1730 71.3 1705 28.7 21.1 70/30 1730 64.7 1705 35.3 26.6 90/10 1730 58.3 1705 41.7 32.3 phenolic/HPMMA 30/70 1730 68.3 1705 31.7 23.5 50/50 1730 57.7 1705 42.3 32.8 70/30 1730 52.7 1705 47.3 38.6 90/10 1730 39.9 1705 60.1 52.1 phenolic/HPMMA-POSS 30/70 1730 74.7 1705 25.3 18.4 50/50 1730 62.4 1705 37.6 28.6 70/30 1730 51.4 1705 48.6 37.6 90/10 1730 40.0 1705 60.0 50.3 aν
f ) wavenumber of free CdO of PMMA, νb ) wavenumber of
hydrogen-bonded carbonyl of PMMA, Af) free CdO area fraction of
PMMA, Ab) CdO area fraction of hydrogen-bonded PMMA, and fb)
fraction of hydrogen-bonded PMMA ) (Ab/1.5)/(Ab/1.5 + Af).
B1+ B1798 K2 B2 (3) Bh+ B1798KB Bh+1(h g 2) (4) Bh+ C1798Kc BhC (5) Bh+ A1798 KA BhA (6) ΦB) ΦB1Γ2
[
1 +KAΦA1 rA + KCΦC1 rC]
(7) ΦA) ΦA1[1 + KAΦB1Γ1] (8) ΦC) ΦC1[1 + KCΦB1Γ1] (9) Γ1)(
1 -K2 KB)
+ K2 KB(
1 1 - KBΦB1)
(10) Γ2)(
1 -K2 KB)
+ K2 KB(
1 (1 - KBΦB1) 2)
(11)our previous study.4The interassociation constant K
Avalue is
determined directly from a least-squares fitting procedure based on the fraction of hydrogen-bonded carbonyl experimentally obtained in the binary phenolic/PMMA blend. In this phenolic/ HPMMA blend, the interassociation constant (KA) 16) obtained
is same as our previous study.19However, when the PMMA
molecular weight is lower than the entanglement molecular weight, we obtain a higher interassociation constant in the phenolic/LPMMA blend (KA) 20) than that in the phenolic/
HPMMA blend (KA ) 16). The smaller molecular weight
PMMA contains a greater fraction of the hydrogen-bonded carbonyl that may come from the greater entropy change and resulted in better miscibility based on thermodynamic reasons.44
Table 3 lists all the parameters required by the Painter-Coleman
association model to estimate thermodynamic properties for these blends. If we know these equilibrium constants (K2, KB, KC, KA) and segment molar volumes, the fraction of
hydrogen-bonded carbonyl group can be calculated from eqs 7-11 using
Figure 7. Synchronous 2D correlation map for (a) phenolic/LPMMA blends in the region from 1200 to 1800 cm-1, (b) phenolic/LPMMA-POSS blends in the region from 400 to 1200 cm-1, and (c) phenolic/ LPMMA-POSS blends in the region from 1100 to 1800 cm-1.
Figure 8. Synchronous 2D correlation map for (a) phenolic/HPMMA blends in the region from 1100 to 1800 cm-1 and (b) phenolic/ HPMMA-POSS blends in the region from 1100 to 1800 cm-1.
Table 3. Summary of the Self-Association and Interassociation Equilibrium Constants and Thermodynamic Parameter of Phenolic/
PMMA and Phenolic/PMMA-POSS Blends at 25°Ca equilibrium constant polymer V MW DP K2 KB KAc KCd phenolicb 84 105 6 23.3 52.3 LPMMA 84.9 100 90 20 HPMMA 84.9 100 280 16 POSS 778.6 872.2 1 38
aV ) molar volume (mL/mol), MW ) molecular weight (g/mol),δ ) solubility parameter (cal/mL)1/2, DP ) degree of polymerization, K
2) dimer
self-association equilibrium constant, KB ) multimer self-association
equilibrium constant, and KA ) interassociation equilibrium constant.
bReference 35.cCalculated by the PCAM model in this study.dReference 4.
fHB) 1 -ΦC1
ΦC
Therefore, the predicted fraction of hydrogen bonding of carbonyl groups shown in Figure 9 can be calculated numeri-cally.
Figure 9 plots the experimental data and the prediction curves by using the PCAM model of PMMA and PMMA-POSS vs the phenolic weight fraction of these four blend systems from the FT-IR of hydrogen-bonded carbonyl region. In these phenolic/PMMA blends, the experimental data are quite agree-able with the prediction from the PCAM model, which are similar to our previous study.19It is worth noting that there is
a large deviation from PCAM prediction curve (KA) 20, KC ) 38) in phenolic/LPMMA-POSS blends shown in Figure 9b
but gives only a relatively smaller deviation from PCAM prediction curve (KA ) 16, KC ) 38) in phenolic/LPMMA
blends. It is interesting to know which parameter based on PCAM is more important to affect the fraction of hydrogen-bonded carbonyl group. In this case, K2and KBare calculated
on the basis of model compounds, KA is calculated from the
hydrogen-bonded carbonyl group of the binary phenolic/PMMA blend, and these parameters are supposed to be constant. Therefore, if the KCvalue becomes larger, such as KC) 1000,
the predicted curve in Figure 9b should also give a larger deviation in this phenolic/LPMMA-POSS blend system. It is reasonable because the POSS content in the LPMMA-POSS homopolymer is below 10 wt %, so the contribution to compete hydrogen bonding with the carbonyl is relatively insignificant. By considering these above-mentioned differences, other factors such as chain connectivity, flexibility, and architecture may also
play important roles to a certain extent according to earlier literature.45A parameter,γ, was introduced and defined as the
fraction of same chain contacts originating from the polymer chain self-bending, primarily through local but also through long-range connectivity effects. The equilibrium constants in eqs 7 and 8 can be redefined as45
These equations are obtained by defining the probability of a B group being next to a B group, i.e.
whereγ is the fraction of intrachain contacts as mentioned above
and (1 -γ)ΦB is a measure of interchain contacts. The
probability of an AB contact, pAB, is then simply (1 - pBB).
Figure 9b compares the experimental data with the predicted curves calculated usingγ values of 0.55, 0.65, and 0.75. The γ
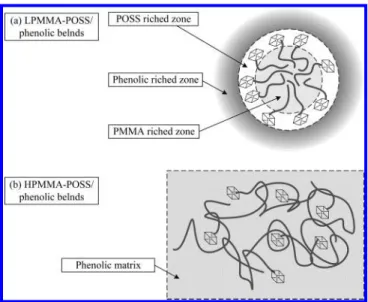
value of 0.65 results in the best agreement between prediction and experiment, implying that about 65% of intrachain with POSS tethered contacts along LPMMA chain. Here, we propose a schematic representation for the phenolic/PMMA-POSS blend in Scheme 3. The chain structure of the LPMMA-POSS acts as a macromolecular surfactant due to lack of entanglement in the LPMMA chain. The POSS and PMMA segment function as hydrophilic and hydrophobic sites, respectively. Further comparison of interassociation equilibrium constant in each functional group, it depicts that the interassociation equilibrium constant between phenolic hydroxyl and POSS siloxane is greater than the interassociations equilibrium constant of hy-droxyl and carbonyl at room temperature. By blending the LPMMA-POSS with phenolic resin matrix, a micelle structure with the POSS shell and the PMMA core is expected as shown in Scheme 3a. This phenomenon can be rationalized by the so-called “screening effect” in phenolic/LPMMA-POSS blends because the interassociation equilibrium constant between hydroxyl and POSS is greater than the interassociation equi-librium constant between hydroxyl and carbonyl. This also manifests why no deviation has been observed between the
Figure 9. PMMA and PMMA-POSS fraction of hydrogen-bonded carbonyl vs phenolic content for blends from FT-IR spectra.
Scheme 3. Proposed Screening Effect Microstructure in Phenolic/PMMA-POSS Blends K˜B) KB
[
γ + (1 - γ)ΦB ΦB]
(13) K˜A) KA[
1 - (γ + (1 - γ)ΦB) ΦA]
) KA(1 -γ) (14) pBB) γ + (1 - γ)ΦB (15)experimental data and the prediction curves in the phenolic/ LPMMA-POSS blend. Thisγ value of 0.65 is lower than the
EPh/dendrimer-like polyester blend (γ ) 0.8)46but higher than
the EMAVPh/PEO blend system (γ ) 0.3),47suggesting that
the chain structure is somewhat between the dendrime-like and linear chain structures. In the phenolic/HPMMA-POSS blends (Scheme 3b) where the molecular weight of PMMA is above its entanglement molecular weight, the PMMA chain are randomly distributed within the phenolic matrix, and the contribution of the POSS competing hydrogen bond with the carbonyl group of PMMA becomes less, similar to that in the binary phenolic/HPMMA blend. As mentioned above in Figure 5b,d, the analyses of this figure are consistent with our proposed Scheme 3, while the hydroxyl-siloxane is more favorable in phenolic/LPMMA-POSS; however, the phenolic/HPMMA-POSS is favored in hydroxyl-carbonyl.
Conclusions
A series of phenolic/PMMA-POSS and PMMA blends have been prepared and investigated by DSC, FT-IR, and 2D-IR. All these blends are totally miscible in the amorphous phase over entire compositions. Among these blends, single Tgs of the
phenolic/PMMA-POSS blends with positive q value were observed and higher than that of the phenolic/PMMA blends with negative q value. The positive deviation of the phenolic/ PMMA-POSS blend reveals that a strong interassociation interaction exists between POSS siloxane and phenolic hydroxyl. FT-IR analysis indicates that the PMMA chain of the LPMMA-POSS cannot form entanglement with lower hydrogen-bonding interaction between LPMMA and phenolic resin. Furthermore, we found a “screening effect” in these phenolic/LPMMA-POSS blends caused by the POSS chain end tethered, which has the greater interassociations equilibrium constant between hydroxyl and POSS than the interassociations equilibrium constant between hydroxyl and carbonyl. On the contrary, the molecular weight of HPMMA-POSS chain is above its entanglement molecular weight; the hydrogen bonding between POSS and hydroxyl becomes less than that between PMMA and hydroxyl. Acknowledgment. This research was financially supported by the National Science Council, Taiwan, Republic of China, under Contract NSC-93-2216-E-009-021.
References and Notes
(1) Novak, B. M. AdV. Mater. 1993, 5, 442.
(2) Tamaki, R.; Chujo, Y.; Kuraoka, K.; Yazawa, T. J. Mater. Chem. 1999, 8, 1741.
(3) Chujo, Y.; Kure, S.; Matsuki, H.; Saegusa, T. Polym. Prepr. Jpn. 1993, 42, 839.
(4) Lee, Y. J.; Kuo, S. W.; Huang, W. J.; Lee, H. Y.; Chang, F. C. J. Polym. Sci., Part B: Polym. Phys. 2004, 42, 1127.
(5) Zhang, W.; Fu, B. X.; Seo, Y.; Schrag, E.; Hsiao, B.; Mather, P. T.; Yang, N. L.; Xu, D.; Ade, H.; Rafailovich, M.; Sokolov, J. Macro-molecules 2002, 35, 8029.
(6) Zheng, L.; Kasi, R. M.; Farris, R. J.; Coughlin, E. B. J. Polym. Sci., Part A: Polym. Chem. 2002, 40, 885.
(7) Fu, B. X.; Lee, A.; Haddad, T. S. Macromolecules 2004, 37, 5211. (8) Lichtenhan, J. D.; Otonari, Y. A.; Carr, M. J. Macromolecules 1995,
28, 8435.
(9) Haddad, T. S.; Lichtenhan, J. D. Macromolecules 1996, 29, 7302. (10) Kopesky, E. T.; Haddad, T. S.; Cohen, R. E.; McKinley, G. H.
Macromolecules 2004, 37, 8992.
(11) Lee, A.; Lichtenhan, J. D. Macromolecules 1998, 31, 4970. (12) Li, G. Z.; Wang, L.; Toghiani, H.; Daulton, T. L.; Koyama, K.; Pittman,
C. Y. Macromolecules 2001, 34, 8686.
(13) Chen, W. Y.; Wang, Y. Z.; Kuo, S. W.; Huang, C. F.; Tung, P. H.; Chang, F. C. Polymer 2004, 45, 6897.
(14) Strachota, A.; Kroutilova, T.; Kovarova, J.; Matejka, L. Macromol-ecules 2004, 37, 9457.
(15) Matejka, L.; Strachota, A.; Plestil, J.; Whelan, P.; Steinhart, M.; Slouf, M. Macromolecules 2004, 37, 9449.
(16) Tsuchida, A.; Bolln, C.; Sernetz, F. G.; Frey, H.; Muhlhaupt, R. Macromolecules 1997, 30, 2818.
(17) Waddon, A. J.; Zheng, L.; Farris, R. J.; Coughlin, E. B. Nano Lett. 2002, 2, 1149.
(18) Tamaki, R.; Choi, J.; Laine, R. M. Chem. Mater. 2003, 15, 793. (19) Huang, C. F.; Kuo, S. W.; Lin, H. C.; Chen, J. K.; Chen, Y. K.; Xu,
H. Y.; Chang, F. C. Polymer 2004, 45, 5913.
(20) Zhang, X. Q.; Soloman, D. H. Macromolecules 1994, 27, 4919. (21) Coleman, M. M.; Graf, J. F.; Painter, P. C. Specific Interactions and
the Miscibility of Polymer Blends; Technomic Publishing: Lancaster, PA, 1991.
(22) Hill, D. J. T.; Whittaker, A. K.; Wong, K. W. Macromolecules 1999, 32, 5285.
(23) Kim, J. H.; Min, B. R.; Kim, C. K.; Won, J.; Kang, Y. S. J. Phys. Chem. B 2002, 106, 2786.
(24) Kuo, S. W.; Chang, F. C. Macromolecules 2001, 34, 4089. (25) Noda, I. J. Am. Chem. Soc. 1989, 111, 8116.
(26) Zhang, J.; Duan, Y.; Shen, D.; Yan, S.; Noda, I.; Ozaki, Y. Macromolecules 2004, 37, 3292.
(27) Huang, H.; Malkov, S.; Coleman, M. M.; Painter, P. C. Macromol-ecules 2003, 36, 8148.
(28) Nakashima, K.; Ren, Y.; Nishioka, T.; Tsubahara, N.; Noda, I.; Ozaki, Y. Macromolecules 1999, 32, 6307.
(29) Huang, H.; Malkov, S.; Coleman, M. M.; Painter, P. Macromolecules 2003, 36, 8156.
(30) Lee, Y. J.; Huang, J. M.; Kuo, S. W.; Lu, J. S.; Chang, F. C. Polymer 2005, 46, 173.
(31) Xu, H. Y.; Kuo, S. W.; Lee, J. S.; Chang, F. C. Macromolecules 2002, 35, 8788.
(32) Xia, J. H.; Gaynor, S. G.; Matyjaszewski, K. Macromolecules 1998, 31, 5989.
(33) Haddleton, D. M.; Kukulj, D.; Duncalf, D. J.; Heming, A. J.; Shooter, A. J. Macromolecules 1998, 31, 5201.
(34) Patten, T. E.; Xia, J.; Abernathy, T.; Matyjaszewski, K. Science 1996, 272, 866.
(35) Wu, H. D.; Chu, P. P.; Ma, C. C. M.; Chang, F. C. Macromolecules 1999, 32, 3097.
(36) Fox, T. G. Bull. Am. Phys. Soc. 1956, 2, 123. (37) Kwei, T. K. J. Polym. Lett. Ed. 1984, 22, 307.
(38) Moskala, E. J.; Varnell, D. F.; Coleman, M. M. Polymer 1985, 26, 228.
(39) Xu, H. Y.; Kuo, S. W.; Lee, J. S.; Chang, F. C. Polymer 2002, 43, 5117.
(40) Cortazar, M.; Pomposo, J. A. Macromolecules 1994, 27, 252. (41) Serman, C. J.; Painter, P. C.; Coleman, M. M. Polymer 1991, 32, 1049. (42) Lin, Y. H.; Juang, J. H. Macromolecules 1999, 32, 181.
(43) Krevelen, D. W. V.; Hoftyzer, P. J. Properties of Polymers: Their Estimation and Correlation with Chemical Structure; Elsevier Scien-tific Publishing: Amsterdam, 1976.
(44) Coleman, M. M.; Xu, Y.; Painter, P. C. Macromolecules 1994, 27, 127.
(45) Coleman, M. M.; Painter, P. C. Macromol. Chem. Phys. 1998, 199, 1307.
(46) Pruthtikul, R.; Coleman, M. M.; Painter, P. C.; Tan, N. B. Macro-molecules 2002, 34, 4145.
(47) Painter, P. C.; Veytsman, B.; Kumar, S.; Shenoy, S.; Graf, J. F.; Xu, Y.; Coleman, M. M. Macromolecules 1997, 30, 932.