Vol. 39, No. 3, March 2001
Experimental Investigation of Vibrating Laminated Composite
Plates by Optical Interferometry Method
Chien-Ching Ma¤and Chan-Chiao Lin†
National Taiwan University, Taipei 10617, Taiwan, Republic of China
Most of the work done for the vibration of composite plates published in the literature are analytical and numer-ical studies with few experimental results available. In this study, an experimental amplitude- uctuation electronic speckle pattern interferometry method for out-of-plane displacement measurement is employed to investigate the vibrationbehaviorof square and rectangular composite plates with different stacking sequences. Both resonant fre-quencies and corresponding mode shapes can be obtained experimentally using the present method. High-quality interferometric fringes for mode shapes are produced instantly by a video recording system. Four different types of geometric con gurations and stacking sequences of 16-layer laminated composite plates are investigated in this study, namely, a[0]16square plate, a[0]16rectangular plate, a[0/45/90/¡¡ 45]2ssquare plate, and a[0/45/90/¡¡ 45]2s
rectangular plate. The numerical calculations by the nite element method and Rayleigh–Ritz technique are per-formed, and the results are compared with the experimental measurements. Good agreement is obtained for both results of resonant frequencies and mode shapes.
Nomenclature Di j = laminate bending stiffness w = transverse displacement ¸ = wavelength of laser ½ = mass density ! = vibration frequency
Introduction
H
OLOGRAPHIC interferometry opened new worlds of re-search by making possible accurate, global measurement of small dynamic surface displacements in a two-step process for a wide variety of objects. For this purpose, different methods of holo-graphic interferometry, which have made possible the gathering of a large amount of information, have been developed for vibration analysis. Unfortunately, the slow and cumbersome process of lm development limits the application of holographic vibration analy-sis. Electronic speckle pattern interferometry (ESPI) was proposed in the 1970s (Ref. 1) as a method of producing the interferogram without using traditional lm-based techniques.2As compared withthe traditionalholographicinterferometry,the interferometricfringe patternsof ESPI are recordedusing a video camera, thus eliminating the chemical lm developmentprocess.Because the interferometric image is recorded and updated every 1
30s, ESPI is faster and more
insensitiveto environmentthan holography.For these reasons,ESPI has become a powerful technique used in many academic research and engineering applications. Because ESPI uses video recording and display,its real-time nature makes it practicalfor vibrationmea-surement. The most widely used experimental setup to study vibra-tion by ESPI is the time-averagedmethod.3The disadvantageof this
method is that the interferometric fringes represent only the ampli-tude, but not the phase, of the vibration. Løkberg and Hogmoen4
developed the phase-modulationmethod, which used the reference beam modulation technique to determine the relative phase of the vibrating object. To reduce the noise coming from the environment, the subtractionmethod was developed,5;6where the referenceframe
is rst recorded before vibration and continuously subtracted from the incoming frames after vibration. However, the interferometric fringe visibility of the subtraction method is not good enough for quantitative measurement of surface displacement. To increase the visibility of the fringe pattern and to reduce the environmentalnoise
Received 28 February2000; revision received 26 June 2000; accepted for publication22 September 2000.Copyright° 2000bythe American Institutec of Aeronautics and Astronautics, Inc. All rights reserved.
¤Professor, Department of Mechanical Engineering. †Graduate Student, Department of Mechanical Engineering.
simultaneously, an amplitude-uctuation ESPI (AF-ESPI) method was proposed by Wang et al.7for out-of-plane vibration
measure-ment. In the AF-ESPI method, the reference frame is recorded in a vibrating state and subtracted from the incoming frame. Conse-quently, it combines the advantages of the time-averaged and sub-tractionmethods, that is, good visibilityand noise reduction.Ma and Huang8and Huang and Ma9used the AF-ESPI method to
investi-gate the three-dimensional vibrations of piezoelectric rectangular parallelepipeds and cylinders. Both the resonant frequencies and the mode shapes were presented and discussed in detail.
Modern engineeringdesign requires the use of materials in a way that optimizes their inherent properties. The general class of mate-rials that is most suitable for optimum design is composites. Com-posite materials are increasingly being used in many engineering applications for a variety of reasons, such as high speci c stiffness and weight reduction. Composite structural elements are now used in a variety of components for automotive, aerospace, marine, and architectural structures, in addition to consumer products. Fiber-reinforced laminated composites are the most popular because of their ability to offer outstanding strength, stiffness, low speci c gravity, and unique exibility, which satisfy the requirements of a large number of structural applications. Structures made of ad-vanced composites, such as ber-reinforced plastics, often consist of a number of layers having unidirectional bers.
The problem of determining the resonant frequencies of lami-nated plates has been studied extensively in the literature, and most of the published works include analytical and numerical results. However, there are very few experimental results available, espe-cially for the full- eld measurement of vibration mode shapes. In this paper, we employ an optical method based on AF-ESPI to inves-tigate experimentally the resonant properties (resonant frequencies and mode shapes) of composite laminated plates. The advantage of using the AF-ESPI method is that both resonant frequenciesand the corresponding mode shapes can be obtained simultaneously from the experimental measurement. The fringe patterns shown in the experiment correspond to the vibration mode shapes. Good qual-ity of the interferometric fringe patterns for the mode shapes are provided for the free vibration of laminated plates. In the analysis of a nonhomogeneous multilayered composite plate, it is common to treat the multilayered composite plate as a single homogeneous plate with effective or homogenized material constants. We con-struct the effective laminate bending stiffness for composite plates from an averaging process of the material properties of lamina, and the material constants are used for numericalinvestigations.Finally, numerical computations based on a nite element package are also presented, and good agreement of resonant frequencies and mode shapes are found for both results.
Vibration of Composite Plates
For a laminated plate with midplane symmetry, there is no extensional–bending coupling, and the in-plane response can be assumed to be negligible compared with the exure-induced dis-placement. For a symmetric laminate plate subjected to bending only, the laminate moment–curvature relationships are given by
8 < : Mx My Mxy 9 = ;D 2 4 D11 D12 D16 D12 D22 D26 D16 D26 D66 3 5 8 < : kx ky kx y 9 = ; (1)
where .Mx; My; Mx y/ and .kx; ky; kx y/ are the moment and the cur-vature, respectively. Di j.i; jD 1; 2; 6/ is the exural stiffness.
The partial differentialequation governing the transverse motion of a symmetrically laminated thin plate is
D11@ 4w @ x4 C 4D16 @4w @ x3@ y C 2.D12C D66/ @4w @ x2@ y2 C 4D26 @4w @ x@ y3 C D22@ 4w @ y4 D ¡½h @2w @t2 (2)
For the orthotropicplate, we have D16D D26D 0. For free harmonic
vibrations at frequency !, we can assume that
w.x; y; t/D W .x; y/ sin !t (3) where W .x; y/is the maximum de ection and can be represented as a linear series of assumed functions:
W .x; y/ D p X m D 1 q X n D 1 AmnXm.x/Yn.y/ (4)
The assumed functions Xm.x/ and Yn.y/ must be admissible, such that they satisfy the essential boundary conditions of the plate. The characteristic equations of vibrating beams are used as the as-sumed functions Xmand Yn. The characteristicequations of vibrat-ing beams are chosen so that the boundary conditions of the beam matches those of the plate, guaranteeingsatisfactionof the essential boundary conditions. The method of determining the set of charac-teristic functions and a summary of the propertiesof these functions was given by Young.10The characteristic functions X
m.x/for the free–free beam used in this study are given as follows:
X1.x/D 1; X2.x/D
p
3[1¡ .2x=`/]
Xm.x/D cosh.cmx=`/ C cos.cmx=`/ ¡ ®m[sinh.cmx=`/ C sin.cmx=`/]; m D 3; 4; 5; : : :
where ` is the length of the beam. The numerical values of cm and ®mare given by Young.10The functions X1.x/ and X2.x/
rep-resent a rigid-body translation and rotation, respectively, and are included to obtain a complete orthogonal set. Similar expressions also are used for Yn.y/. With the stationary potential energy theory, the Rayleigh–Ritz technique will provide a discrete number of sta-tionary values !s, which are the lowest upper bounds of the actual resonant frequencies.11
T300/976 graphite/epoxy composite plates with stacking se-quences[0=45=90=¡45]2sand[0]16, respectively, and an isotropic
aluminum 6061-T6 plate are evaluated in this study. The material properties of the graphite/epoxy lamina and the aluminum are indi-cated in Table 1, where E1and E2are Young’s moduli in the
longi-tudinal and transverse directions, respectively; G12is the in-plane
shear modulus; and º12is Poisson’s ratio of the lamina. To simplify
the problem, the nonhomogeneousmultilayeredlaminated compos-ite plate is usually treated as a single homogeneouslayer with effec-tive material constants by an averaging process. The averaging pro-cess is performedas follows:1) Form the stiffnesscoef cientsfor the
Table 1 Material constants of the tested plates
Material E1, GPa E2, GPa G12, GPa º12 º21 ½, kg/m3 Graphite/epoxy 139.3 9.72 5.586 0.29 0.02 1550
Aluminum 70 70 26 0.33 0.33 2700
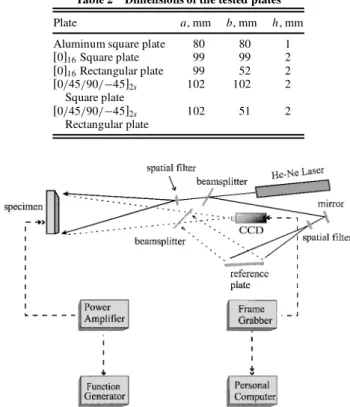
Table 2 Dimensions of the tested plates
Plate a, mm b, mm h, mm
Aluminum square plate 80 80 1
[0]16Square plate 99 99 2 [0]16Rectangular plate 99 52 2 [0=45=90=¡45]2s 102 102 2 Square plate [0=45=90=¡45]2s 102 51 2 Rectangular plate
Fig. 1 Schematic diagram of ESPI setup for out-of-plane measure-ment.
lamina. 2) Use tensor transformationfor each lamina to obtain trans-formedlamina stiffnessmatrix for different ber orientation.3) Con-struct the laminate bendingstiffness.The laminate bending stiffness for[0]16 and[0=45=90=¡45]2s laminate plates are obtained from
the material properties of lamina shown in Table 1, and the results for[0]16are D11D 93:46 GPa ¢ mm3, D12D 1:87 GPa ¢ mm3, D22D
6.52 GPa¢ mm3, and D
66D 3:72 GPa ¢ mm3 and for [0=45=90=
¡45]2sare D11D 50.88 GPa ¢ mm3, D12D 10:14 GPa ¢ mm3, D16D D26D 3:56 GPa ¢ mm3, D22D 32:55 GPa ¢ mm3, and D66D
11:98 GPa¢ mm3. The dimensions of the tested plates are shown
in Table 2.
Experimental and Numerical Results
The basic theory of the AF-ESPI method for out-of-plane vibra-tion measurement can be found in Refs. 7–9. The schematic layout of a self-arranged AF-ESPI optical system, as shown in Fig. 1, is employed to perform the out-of-plane vibration measurement of the resonant frequencies and mode shapes for composite plates. A He–Ne laser with 30 mW and wavelength ¸D 632:8 nm is used as the coherent light source. The laser beam is divided into two parts, the reference and object beams, by a beamsplitter. We use a charge-coupled device (CCD) camera (Pulnix Company) and a P360F (Dipix Technologies, Inc.) frame grabber with Digital Sig-nal Processor (DSP) onboard to record and process the images. The object beam travels to the specimen and then re ects to the CCD camera. The reference beam is directed to the CCD camera via the mirror and reference plate. Note that the optical path and the light intensity of these two beams should remain identical in the experimental setup. The CCD camera converts the intensity distri-bution of the interference pattern of the object into a corresponding video signal at 30 frames per second. The signal is electronically processedand nally convertedinto an image on the video monitor. The interpretationof the fringe image is similar to reading a contour map. To increase the intensity of light re ection of the specimens and the contrast of fringe patterns, the surfaces of the plates are coated with white paint, which is mixed with ne seaweed powder. The plate is excited by the piezostack actuator (Physik Instrumente; 5£ 5 £ 10 mm), which is attached to the specimen. The piezoelec-tric actuator is usually attached by adhesive in the center of the opposite face of the specimen. However, if the nodal lines pass the center of the specimen, then the piezoelectric actuator will be
moved to another location. To achieve the sinusoidaloutput,a func-tion generator HP33120A (Hewlett Packard) connected to a 4005 power ampli er (NF Electronic Instruments) is used.
The experimental procedure of the AF-ESPI technique is per-formed as follows. First, a reference image is taken after the spec-imen vibrates, then the second image is taken, and the reference image is subtractedby the image processingsystem. If the vibrating frequency is not the resonant frequency, only randomly distributed speckles are displayed and no fringe patterns will be shown. How-ever,if the vibratingfrequencyis in the neighborhoodof the resonant frequency,stationary distinct fringe patterns will be observed.Then the function generator is carefully and slowly turned; the number of fringes will increaseand the fringe pattern will become clearer as the resonant frequency is approached. From the aforementionedexper-imental procedure, the resonant frequencies and the corresponding mode shapes can be determined at the same time using the AF-ESPI optical system.
Composite and isotropic aluminum plates with all edges free are used to have the ideal boundary conditionsfor theoreticaland exper-imental simulations. The resonant frequency and the correspondent mode shape for the vibrating plate are determined experimentally using the noncontacting optical method of AF-FSPI. The numer-ical predictions of resonant frequencies and mode shapes are car-ried out by using the commerically available nite element pack-age ABAQUS12in which nine-nodetwo-dimensionalshell elements
(S9R5) are used to analyze the problem. Furthermore,a FORTRAN program in which equations are derived by the Rayleigh–Ritz tech-nique is also used to predict the resonant frequencies.
Fig. 2 First six mode shapes for isotropic aluminum square plate obtained from experimental observation and numerical calculation. To verify the procedure described, an isotropic aluminum square plate is evaluated. The material properties and dimensions of the aluminum plate are listed in Tables 1 and 2, respectively.The results presented in Table 3 show generally good agreement between the predicted and measured resonant frequencies.The error in resonant frequency prediction is given by
%ErrorD . fexpf¡ fpredicted/
predicted £ 100%
The percentage errors between the experimental data and the ana-lytical Rayleigh–Ritz and nite element results are also shown in Table 3. The largest error is 6.6% and the average error in the results is 4%. The errors may be due to thicknessvariationsacross the plate, the material property measurement, the experimentaldetermination of resonant frequencies, and errors in nite element and Rayleigh– Ritz solutions. However, the differences between the nite element and Rayleigh–Ritz results are generally less than 1%.
Figure 2 shows the rst six mode shapes of an isotropicaluminum square plate for both experimental measurements and numerical simulations.For the nite element calculations,the contours of con-stant displacementfor resonant mode shapes are plotted to compare with the experimental observation. In Fig. 2, we indicate the phase of displacement in nite element results as a solid or a dashed line, where the solid lines are in the opposite direction from the dashed lines. The boundaries separating the solid lines and dashed lines are the nodal lines. The zero-order fringe, which is the brightest fringe on the experimentalimage, representsthe nodallines of the vibrating
Table 3 Results of resonant frequencies obtained from Rayleigh–Ritz method, FEM, and AF-ESPI for the square
aluminum plate
FEM AF-ESPI
Mode
number Results of
(index) resonance, Hz Hz Error, % Hz Error, %
1 509 510 0.20 494 ¡2:95 (2,2) 2 755 746 ¡1:19 735 ¡2:65 3 953 945 ¡0:84 890 ¡6:61 4 1334 1322 ¡0:90 1271 ¡4:72 5 2381 2358 ¡0:97 2330 ¡2:14 6 2447 2428 ¡0:78 2345 ¡4:17 (3,3)
Fig. 3 First eight mode shapes for[0]16composite square plate obtained from experimental observation and numerical calculation (also appears in
Ref. 15).
plate at resonant frequencies. The rest of the fringes are contours of constantamplitudesof displacement.The excellentqualityof the ex-perimentalfringe patterns for vibrationmode shapes of the isotropic square plate are also presented in Fig. 2. The mode shapes obtained by experimentalresults can be checkedby comparingthe nodal lines and fringe patterns with the numerical nite element calculations, and excellent agreements are found. Extensive experimental results of the resonant frequenciesand mode shape for isotropic plates with two different types of boundary conditions were obtained by Huang and Ma.13A digital speckle pattern interferometry technique was
developed by Slangen et al.14and was applied to study the resonant
frequencies and mode shapes of a cantilever aluminum plate. Because of the symmetry of the geometric con guration of the isotropic square plate and the boundary condition, two possible mode shapes may exist at the same resonantfrequency.If the plate is
Table 4 Results of resonant frequencies obtained from Rayleigh–Ritz method, FEM, and AF-ESPI for the[0]16square
composite plate
FEM AF-ESPI
Mode
number Results of
(index) resonance, Hz Hz Error, % Hz Error, %
1 409 407 ¡0:49 400 2.20 (2,2) 2 526 525 ¡0:19 501 ¡4.75 (1,3) 3 991 985 ¡0:61 1003 1.21 (2,3) 4 1449 1445 ¡0:28 1466 1.17 (1,4) 5 1916 1900 ¡0:84 1856 ¡3:13 (2,4) 6 1993 1977 ¡0:80 1958 ¡1:76 (3,1) 7 2157 2137 ¡0:93 2134 ¡1:07 (3,2) 8 2661 2620 ¡1:54 2609 ¡1:95 (3,3)
Table 5 Results of resonant frequencies obtained from Rayleigh–Ritz method, FEM, and AF-ESPI for the[0]16
rectangular composite plate
FEM AF-ESPI
Mode
number Results of
(index) resonance, Hz Hz Error, % Hz Error, %
1 789 780 ¡1:14 767 ¡2:79 (2,2) 2 1884 1876 ¡0:42 1895 0.58 3 2017 2002 ¡0:74 2006 ¡0:55 4 2482 2456 ¡1:05 2500 0.73 (2,3) 5 2547 2511 ¡1:41 2516 ¡1:22 (3,2) 6 4269 4163 ¡2:48 4120 ¡3:49 (3,3) 7 5262 5219 ¡0:82 5292 0.57 (1,4)
Table 6 Results of resonant frequencies obtained from Rayleigh–Ritz method, FEM, and AF-ESPI for the
[0/45/90/¡ 45]2ssquare composite plate
FEM AF-ESPI
Mode
number Results of
(index) resonance, Hz Hz Error, % Hz Error, %
1 671 662 ¡1:34 654 ¡2:53 2 1065 1056 ¡0:85 1028 ¡3:47 3 1416 1402 ¡0:99 1355 ¡4:31 4 1702 1677 ¡1:47 1636 ¡3:88 5 1978 1935 ¡2:17 1891 ¡4:40 6 3060 3015 ¡1:47 2891 ¡5:52 7 3225 3140 ¡2:64 3079 ¡4:53
Table 7 Results of resonant frequencies obtained from Rayleigh–Ritz method, FEM, and AF-ESPI for the
[0/45/90/¡ 45]2srectangular composite plate
FEM AF-ESPI
Mode
number Results of
(index) resonance, Hz Hz Error, % Hz Error, %
1 1172 1264 7.85 1178 0.51 2 1514 1389 ¡8:26 1311 ¡13.41 3 2921 2948 0.92 2781 ¡4.79 (3,2) 4 3829 3670 ¡4:15 3485 ¡8.98 5 4420 4348 ¡1:63 4037 ¡8.67 6 5279 5125 ¡2:92 4855 ¡8.03 7 5364 5329 ¡0:65 5071 ¡5.46
(4,2) Fig. 4 First seven mode shapes for[0]16composite rectangular plate
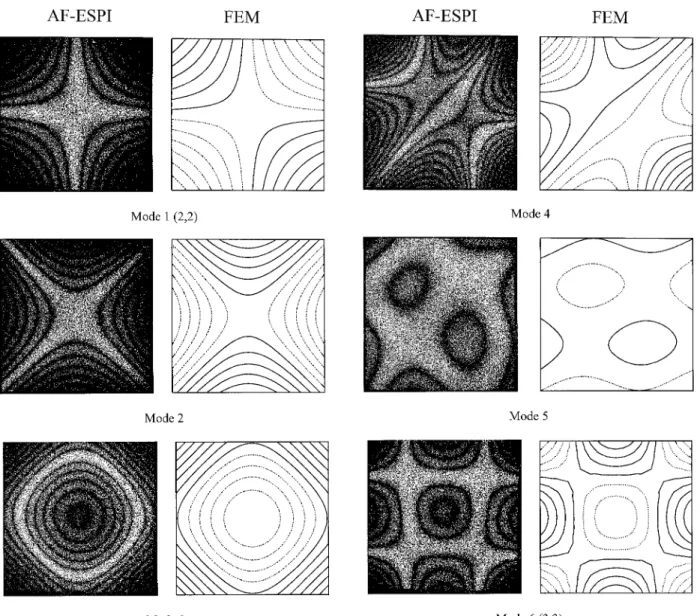
Fig. 5 First seven mode shapes for[0/45/90/¡ 45]2scomposite square plate obtained from experimental observation and numerical calculation.
excited at this frequency, a linear combination of these modes will be obtained in experimental observation, and it is not possible to de ne uniquely the mode shape of the vibration. The precise nature of the mode produced in the experimentdepends on the position and method of excitation. The values for (m; n) are the numbers associ-ated with the transverse half waves in the plate along the horizontal and vertical directions, respectively. In the case in which the nodal lines are straight lines parallel to the coordinate axes, the values (m; n) are reported. In other cases, the modes become complicated. For example, modes 2 and 3 in Fig. 2 correspond to the expressions of (1, 3)¡ (3, 1) and (1, 2) C (3, 1), respectively.
Next, the composite square and rectangular plates with stacking sequences[0]16and[0=45=90=¡45]2s, with all edges free, are
inves-tigated.The resonantfrequenciesobtainedfrom the analyticalmeth-ods and experimental measurements are compared in Tables 4–7. Note that the predicted values of resonant frequencies are based on the effective laminate bending stiffness, as discussed earlier. The differencesbetween the predicted values and the experimentalreso-nant frequenciesare possiblydue to the errors inducedby measuring the resonant frequencies from the AF-ESPI technique, the accuracy of the nite element and Rayleigh–Ritz methods, and the suitability of the method for determination of the effective laminate bending stiffness from the material properties of the lamina. The rst few
mode shapes for each plate are computed using the nite element package ABAQUS, and the results are compared with the experi-mental observation from AF-ESPI, as shown in Figs. 3–6. The rst few vibration mode shapes for the square (eight modes) and rect-angular (seven modes) composite plates with the stacking sequence
[0]16are shown in Figs. 3 and 4, respectively. The vibration mode
shapes for the square (seven modes) and rectangular (seven modes) composite plates with the stacking sequence[0=45=90=¡45]2sare
presented in Figs. 5 and 6, respectively.It can be seen that the mode shapes obtained experimentally are in good agreement with those obtained from the nite element method (FEM). The mode shapes of laminated composite plates are in uenced by material properties, boundary conditions, geometry, and the lamination arrangement. The last factor provides the designer with more exibility optimally to synthesize the characteristics (i.e., the stiffness, the fundamental frequencies, and the corresponding mode shapes) of the designed structures. The mode shapes of laminated plates have some partic-ular characteristics that are different from isotropic plates. This is noticed in the case of an orthotropic square plate with the stacking sequence[0]16, where the (1, 3), (2, 3), (1, 4), and the (2, 4) modes
are found to be associated with frequencies that are lower than the (3, 1) mode. This feature can be explained by comparing the struc-tural properties, boundary conditions, and dimensions of the plate
Fig. 6 First seven mode shapes for[0/45/90/¡ 45]2s composite
rect-angular plate obtained from experimental observation and numerical calculation.
in the x and y directions.For the orthotropic plate, the overall bend-ing stiffness with respect to the y direction is weaker than in the
x direction. Therefore, the plate tends to form nodal lines in the y
direction rst. In contrast, an isotropic square plate has the same frequency for both the (3, 1) and the (1, 3) modes. Making use of the resonant frequencies and vibration mode shapes obtained by the AF-ESPI optical system, an inverse algorithm is developed by the authors.15
Conclusions
Optical techniques have been shown to have certain advantages for vibration analysis and ESPI has been applied to many vibra-tion problems. The advantages of the optical ESPI method include noncontact and full- eld measurement, real-time observation, sub-micron sensitivity, validity of both static deformation and dynamic vibration,and direct digital image output. Because ESPI uses video recording and display, it works in real time to measure dynamic dis-placement, which makes it possible to implement this technique for vibrationmeasurement.A self-arrangedAF-ESPI optical setup with good visibility and noise reduction has been used in this study to obtain the resonant frequenciesand the correspondingmode shapes of free vibration of laminated composite plates at the same time. Compared with the spectrum analysis or modal analysis method, AF-ESPI is more convenient in experimental operation. Two dif-ferent types of stacking sequences and two plate geometries are investigatedin this study, and an acceptable quality of mode shapes is generated using the experimental optical interferometry method. Numerical calculations of resonant frequencies and mode shapes based on a nite element package and a Rayleigh–Ritz method are performed, and good agreements are obtained when compared with experimental measurements. The results shown in this study demonstratethatthepredictionof the resonantfrequenciesand mode shapes of composite plates is applicable by using the effective ma-terial constants from an averaging process.
Acknowledgment
The authors gratefully acknowledge the nancial support of this research by the National Science Council (Taiwan, Republic of China) under Grant NSC 87-2212-E002-036.
References
1Rastogi, P. K., Holographic Interferometry, Springer-Verlag, Berlin, 1994.
2Butters, J. N., and Leendertz, J. A., “Speckle Pattern and Holographic Techniques in Engineering Metrology,” Optics Laser Technology, Vol. 3, No. 1, 1971, pp. 26–30.
3Jones, R., and Wykes, C., Holographicand Speckle Interferometry, Cam-bridge Univ. Press, CamCam-bridge, England, U.K., 1989, pp.165–196.
4Løkberg, O. J., and Hogmoen, K., “Use of Modulated Reference Wave in Electronic Speckle Pattern Interferometry,” Journal of Physics. E: Scienti c
Instruments, Vol. 9, 1976, pp. 847–851.
5Creath, K., and Slettemoen, G. A., “Vibration-Observation Techniques for Digital Speckle-Pattern Interferometry,” Journal of the Optical Society
of America A, Vol. 2, No. 10, 1985, pp. 1629–1636.
6Pouet, B., Chatters, T., and Krishnaswamy, S., “Synchronized Refer-ence Updating Technique for Electronic Speckle Interferometry,” Journal of
Nondestructive Evaluation, Vol. 12, No. 2, 1993, pp. 133–138.
7Wang, W. C., Hwang, C. H., and Lin, S. Y., “Vibration Measurement by the Time-Averaged Electronic Speckle Pattern Interferometry Methods,”
Applied Optics, Vol. 35, No. 22, 1996, pp. 4502–4509.
8Ma, C. C., and Huang, C. H., “The Investigation of Three-Dimensional Vibration for Piezoelectric Rectangular Parallelepipeds by Using the AF-ESPI Method,” IEEE Transactions on Ultrasonics, Ferroelectrics, and
Fre-quency Control (to be published).
9Huang, C. H., and Ma, C. C., “Vibration Characteristics for Piezoelectric Cylinders Using Amplitude-FluctuationElectronic Speckle Pattern Interfer-ometry,” AIAA Journal, Vol. 36, No. 12, 1998, pp. 2262–2268.
10Young, D., “Vibration of Rectangular Plates by the Ritz Method,”
Jour-nal of Applied Mechanics, Vol. 17, No. 4, 1950, pp. 448–453.
11Leissa, A. W., “The Free Vibration of Rectangular Plates,” Journal of
Sound and Vibration, Vol. 31, No. 3, 1973, pp. 257–293.
12ABAQUS User’s Manual, Ver. 5.5, Hibbit, Karlsson, and Sorensen, Inc., Pawtucket, RI, 1995.
13Huang, C. H., and Ma, C. C., “Experimental Measurement of Mode Shapes and Frequencies for Vibration of Plates by Optical Interferometry Method,” Journal of Vibration and Acoustics (to be published).
14Slangen, P., Berwart, L., de Veuster, C., Golinval, J. C., and Lion, Y., “Digital Speckle Pattern Interferometry (DSPI): A Fast Procedure to Detect and Measure Vibration Mode Shapes,” Optics and Lasers in Engineering, Vol. 25, No. 5, 1996, pp. 311–321.
15Ma, C. C., and Lin, C. C., “Inverse Evaluation of Material Constants for Composite Plates by Optical Interferometry Method,” AIAA Journal, Vol. 37, No. 8, 1999, pp. 947–953.
A. Berman

![Table 5 Results of resonant frequencies obtained from Rayleigh – Ritz method, FEM, and AF-ESPI for the [ 0 ] 16](https://thumb-ap.123doks.com/thumbv2/9libinfo/8842478.239368/5.833.58.383.105.385/table-results-resonant-frequencies-obtained-rayleigh-ritz-method.webp)
![Fig. 5 First seven mode shapes for [ 0/45/90/ ¡ 45 ] 2s composite square plate obtained from experimental observation and numerical calculation.](https://thumb-ap.123doks.com/thumbv2/9libinfo/8842478.239368/6.833.96.736.132.744/shapes-composite-square-obtained-experimental-observation-numerical-calculation.webp)
![Fig. 6 First seven mode shapes for [ 0/45/90/ ¡ 45 ] 2s composite rect- rect-angular plate obtained from experimental observation and numerical calculation.](https://thumb-ap.123doks.com/thumbv2/9libinfo/8842478.239368/7.833.43.400.57.970/shapes-composite-angular-obtained-experimental-observation-numerical-calculation.webp)
