FUNDAMENTAL PERFORMANCE ANALYSIS FOR
SPOKEN DIALOGUE SYSTEMS BASED ON A
QUANTITATIVE SIMULATION APPROACH
Bor-shen Lin, Lin-shan Lee
Department of Electrical Engineering, National Taiwan University
Taipei, Taiwan, Republic of China
ABSTRACT
Currently the performance of dialogue system is mostly mearsured based on the analysis of a large dialogue corpus. In this way, the dialogue performance can not be obtained before the system is on line, and the dialogue corpus should be recollected if the system is modified. Also, the effect of different factors, including system’s dialogue strategy, recognition and understanding accuracy or user’s response pattern, etc., on the dialogue performance can not be quantitatively identified because they can not be precisely controlled in different corpora. In this paper, a fundamental performance analysis scheme for dialogue systems based on a quantitative simulation approach is proposed. With this scheme the fundamental performance of a dialogue system can be predicted and analyzed efficiently without having any real spoken dialogue system implemented or having any dialogue corpus actually collected. How the dialogue performance varies with respect to each factor, from recognition accuracy to dialogue strategy, can be individually identified, because all such factors can be precisely controlled in the simulation. The quality of service for the spoken dialogue system can also be flexibly defined and the design parameters easily determined. This approach is therefore very useful for the design, development and improvement of spoken dialogue systems, although the on-line system and real corpus will eventually be needed in the final evaluation and analysis of the system performance in any case.
1. INTRODUCTION
The performance analysis of recently developed spoken dialogue systems is mostly based on the analysis of a large dialogue corpus using some metrics such as the number of dialogue turns or transaction success rate [ 1-41, One of the major difficulties for such scheme is that it can not predict the dialogue performance before the system is on line. The developers, after hard working in writing the dialogue control flows, can know very little about the dialogue performance until many people are involved in the on-line test. Some further problems also exist even if the system can be on line. For example, when the system dialogue strategy is modified, the performance analysis based on the old strategy is no longer valid, and all the data collection and analysis should be repeated once more. What is even worse is that the analysis for the modified system should be performed based on the new data collected with the new dialogue strategy, while the old corpus becomes useless for the analysis of new strategy. This makes the cycle for testing and modifying spoken dialogue systems relatively long. Other serious problems on the methodology of performance analysis also occur. For example, it is actually not rigorous nor reliable enough to compare the dialogue
performance for different dialogue strategies using different corpora, because many factors in the corpora, such as the user’s response pattern, the slot accuracy or word error rate, can not be precisely controlled. All these difficulties and problems are intrinsic in the analysis methodology and not solved yet for such corpus-based analysis schemes.
On the other hand, dialogue performance studies based on analytical or mathematical model instead of on-line corpus analysis is always highly desired
[5].
With these studies, such parameters as dialogue turns for different dialogue strategies can even be expressed in closed forms. However, in order to achieve closed forms, usually some impratical assumptions have to be made implicitly for simplification, for example on system initiative or deterministic user’s response pattern [ 5 ] . It is thus difficult to extend those closed forms to other cases when some of the constraints are relaxed. In other words, such methods may not be flexible and efficient enough for the developers of spoken dialogue systems, even if with closed form solutions.In this paper, a fundamental performance analysis scheme for dialogue systems based on a quantitative simulation approach is proposed. With this scheme the fundamental performance of a
dialogue system can be predicted and analyzed efficiently without having any real spoken dialogue system implemented or having any dialogue corpus actually collected. How the dialogue performance varies with respect to each factor, from recognition accuracy to dialogue strategy, can be individually identified, because all such factors can be precisely controlled in the simulation. The quality of service for the spoken dialogue system can also be flexibly defined and the design parameters easily determined. This approach is therefore very useful for the design, development and improvement of spoken dialogue systems, although the on-line system and real corpus will eventually be needed in the final evaluation and analysis of the system performance in any case.
2. QUANTITATIVE SIMULATION
APPROACH
2.1
State Representation
The finite state machine for each semantic slot, s,, is first represented in a two-tuple expression, as shown in Figure 1 . The first argument denotes the dialogue state of the slot as unknown ( U ) , known but not yet verified ( k ) , or verified (v), while the second argument denotes the correctness of the slot value as correct (c), error ( e ) or meaningless (x). When a slot is unknown, the correctness of its value is meaningless. Assuming that there are a total of n semantic slots necessary for a transaction, the overall state S can therefore be represented as n finite state machines, that is, S = (sI.s2. . . .,s,,).
Figure 1. Finite state machine for each semantic slot
With this definition, the initial state
S,
of the overall system is then (sl=(u,x),s2=(u,x),.
. .,s,=(u,x)), while the goal state S, in which all slots are verified is (s,=(v,y), sz=(v,y), . , ., s,=(v,y)), where the symbol y means that the slot value may be either correct or error. The purpose of the dialogue between the system and the user is.therefore to make each of the finite state machine to transit from the state (UJ) to the state (v,?) as shown in Figure I , such that the overall stateS
may transit from the initial state Si to the goal stateS,.
How these states transit is determined by the simulation scheme given below.2.2 Simulation Scheme
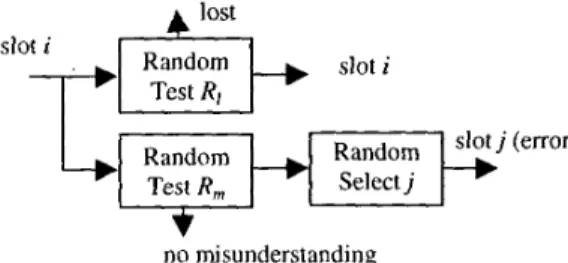
The simulation scheme can be represented with the pseudo codes as shown in Figure 2. The cycle of a dialogue turn is divided into four segments: system prompt, user response, channel effect and system update, as shown within the for-loop in Figure 2. In the ‘system prompt’ segment, how the system decides which slots should be queried and which slots should be confirmed is simulated. In the ‘user response’ segment, how the user decides to respond to the system’s prompt is simulated. The schemes simulated in these two segments are referred to as ‘system’s prompt strategy’ and ‘user’s response pattern’ respectively. In the ‘channel effect’ segment, the slots can be considered as transmitted by the user through a channel. and the effect of recognition and understanding errors is simulated so as to decide the actually received slots. Conventionally, the speech understanding errors are measured with slot error rate, which includes the rates for inserted, deleted, and substituted slot errors,
R,,,T,
R,,,.]
and R,,,,/> respectively. The inserted slots are those slots leading to misunderstanding and therefore regarded as ‘misunderstanding slots’ here, while the deleted slots are those slots ‘lost’ in slot transmission and regarded as ‘lost slots’ here. On the other hand, each substituted slot is effectively equivalent to an inserted slot plus a deleted slot, or a misunderstasnding slot plus a lost slot. The understanding error can therefore be represented by the following two metrics:Here R,,, is the slot misunderstanding rate and R, is the slot lost rate. As a result, for each slot transmitted by the user two degradation effects may occur. One is that the transmitted slot
R,
= R;n,>+R.wh 7 RI = RL/t/+R.stt~for(N,=O;!Goul();N, ++) (
SystemPrompt(); // system’s prompt strategy UserResponse(); / / u s e r ’ s response pallern
CtzannelEffect(); // understanding performance SystemUpdate(); //state transition
I
iJAIlSlotCorrect()) T, = I ; else T, = 0E
=d n ’ ;
// successful transaction // error transaction//slot transmission efJiciency
Figure 2. Pseudo codes for simulation of a dialogue
no misunderstanding
Figure 3. Simulation of channel effect for each transmitted slot may be lost with probability RI, and the other is that some other undesired misunderstanding slot may be generated with probability R,. The channel effect can therefore be simulated using the random tests as shown in Figure 3.
In the ‘system update’ segment, how the system controls the state transition is simulated. The scheme simulated in this segment is referred to as ‘system’s update strategy’. For example, the system may decide that all slots being confirmed are verified (from ( k , y ) to (v.y)) based on the condition that a ‘Yes’ is detected or the condition that these slots are consistent with the previously received slots.
2.3
Characteristic Parameters of the Dialogue
For the simulation of each dialogue, after the four segments are iterated for enough number of times, the goal state is achieved and the dialogue terminated, as shown in Figure 2. Some characteristic parameters of the dialogue can be extracted. First, the number of dialogue turns, N,, can be obtained in the for-loop in Figure 2. The transaction success flag, T,, which denotes whether a successful transaction is achieved, can be determined by checking the second argument of the finite state machines. If all of them are correct, or equivalently the goal state equals ( s , = ( v , c ) , s 2 = ( v , c ) , . . ., s , = ( v , c ) ) , this dialogue leads to a successful transaction, otherwise an error transaction. The transmission efficiency for the semantic slots, E , , can be obtained by dividing the total number of slots, n, by t h e total number of transmitted slots, n’, where n ’ can be observed in the ‘user response’ segment. The transmission efficiency E , here indicates whether the user can transmit the slots efficiently, whose value ranges from 0 to 1. For example, if E , is 50%, this means n ’ = 2n, or each slot is transmitted twice in average and the user may feel bored by speaking the slots again and again. All these characteristic parameters of the dialogue, NI, T , and E , derived in the simulation will be further applied to the statistical analysis in the next section.
3. STATISTICAL ANALYSIS
In the analysis here the symbols T,, N, and E,, are random variables for the transaction success flag, the number of dialogue turns and the slot transmission efficiency as defined perviously, while samples of these random variables are extracted for each dialogue iteration. After the simulation is performed for a large number of iterations, the mean values of these random variables,
T s , N t and
E,,
can be estimated. They are respectively the transaction success rate, the average dialogue tum, and the average slot efficiency, to be used to measure the dialogue performance. The variances for these random variables, q:, a,,;and or: respectively, can also be estimated for further analysis.
_
_
3.1 Quality of Service
In principle, for spoken dialogue systems higher transaction success rate, smaller average dialogue tum and higher average slot efficiency are desired. However, due to the uncertainty in speech recognition and understanding, the dialogue behavior is stochastic instead of deterministic. It is therefore appropriate to describe the ‘quality of service’ (QOS) for the spoken dialogue systems as the probability that a user may acquire the service above some minimum acceptable criteria. Here in this paper three metrics of QOS for spoken dialogue systems are defined as follows.
I.Rl, G T s
2.P,,, Pr(N, < N*, )
3.P, Pr(E,
> E:)
The first metric R , is the probability that a user may achieve successful transaction in the dialogue. The second metric P,, is the probability that a user may achieve the goal within N*, dialogue tums. The third metric Pes is the probability that a user may achieve the goal with slot efficiency above E*,. Here N*, or E*, are some minimum acceptable criteria.
3.2 Operating Region
Because the metrics R,P,, and Pr, are all functions of the channel effect simulated by the two parameters R, and RI, it is therefore easy to obtain R,,
P,,
andP,,
for a given (R,, RI) pair. If some criteria for R,, Pnf or P,, is set, say P,,>
P*,,, the region on (Rm R,) plane within which all ( R , R I ) pairs satisfy such criteria can be directly obtained by numerical evaluation. This region for the given criteria is the operating region for the channel effect. In other words, in order for the spoken dialogue system to meet the given criteria of QOS, the channel effect has to be within this region. In this way, it is possible to determine not only whether a speech recognition front end is capable to achieve the criteria of QOS, but also to what extent this front end should be tuned or improved so as to meet the criteria. Furthermore, the criteria of QOS for a spoken dialogue system can be defined flexibly by giving any combinations of the conditions for R,, P,, P,,, and so on, and the corresponding operating region can be derived accordingly.Such analysis can in fact be performed for other segments of the dialogue such as the system’s prompt strategy, the user’s response pattem, and the system’s update strategy as well, although in those cases it may not be easy to define numerically characterizing parameters such as R, or R, in the case of channel effect. Furthermore, though t h e analysis proposed here is limited to the case of parameters Ts, Nf and E,, it is in fact very flexible and extensible. For example, the users may be impatient about transmitting slots repeatedly
or
conversing for too many turns, and thus give up during the dialogue. All these events can be easily observed in simulation, and the statistical analysis for ‘user’s patience’ can be performed as well.4.
SIMULATION RESULT
Based on the simulation scheme described in Section 2.2, the dialogue performance is a function of system’s prompt strategy, user’s response pattem, channel effect and system’s update strategy, which can be expressed as Po = F(Sp, U, C, S”), where
Po
may be any set of.metrics for dialogue performance, and S,, U ,C and So represent the simulation schemes for the four segments respectively. The scheme of the ‘channel effect’ segment, C, can be described by two parameters RI and R,, as shown in Figure 3 and discussed above. However, the schemes of the other segments are in fact difficult to parameterize. A set of simple base-line schemes is therefore defined descriptively below for illustration purpose.
SP : (A
Q,
A C)All slots in unknown state are queried (AQ), while all slots in known state are confirmed ( A C ) .
All queried slots are replied (AQR). For those slots to be confirmed, a ‘Yes’ is transmitted if correct for all
(Yo,
otherwise incorrect slots are retransmitted with ‘No’. Those slots neither queried nor confirmed are not transmitted (NT). The transmitted slots are passed through a random test with parameters R , and RI to determine the finally recevied slots.
Queried slots in unknown state will enter known state if they are received (QUK). Those slots in known state being confirmed will enter the verified state if they are received consistently, or the slots are verified by slot consistency (VSC). Those slots neither queried nor confirmed are ignored completely, which means system initiative (Sf).
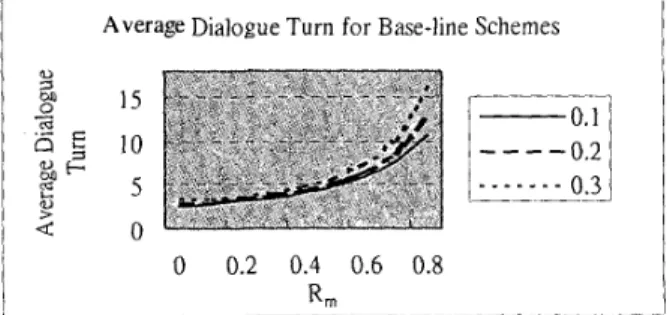
For the base-line schemes assumed above how the average dialogue turn increases with the degradation of understanding performance is shown in Figure 4, where the number of simulated dialogues for each ( R , RI) pair is 100,000 and the number of semantic slots, n, is 5.
As we can see above, many factors in the four segments may affect the dialogue performance simultaneously. For the base-line schemes, the first factor of user’s response is AQR, which means all queried slots are replied. Two other schemes for this factor were simulated. One is OQR, or only one of the queried slots is replied. The other is PQR, or only a part of the queried slots are replied, in which the number of the replied slots is determined by a random test. During the simulation, all other factors are the same as the previous base-line simulation. Figure 5 shows the average dialogue tum for different user’s response pattems. I t can be seen in Figure 5 that, for the given system’s strategy, different behavior of the user may lead to quite different performance, approximately ranging from the curve for AQR to the curve for OQR. This verifies that it is not necessarily reliable for conventional corpus-based analysis to compare different system strategies using different corpora, because the user’s response is an important factor but can not be controlled.
U : (AQR, YC, NT)
C : (Rm, RI)
So
: (QUK, VSC, SI)_. ~.~
Average Dialogue Turn for Base-line Schemes
0 0.2 0.4 0.6 0.8
Figure 4. Average dialogue tum for base-line schemes
- --.
R m
h___--___ - -
( R = 0. I, 0.2, 0.3)
Average Dialogue Turn for Different
User’s
Response Patterns0 0.2 0.4 0.6 0.8 Am
Figure 5. Average dialogue tum for different user’s response patterns (RI = 0.1)
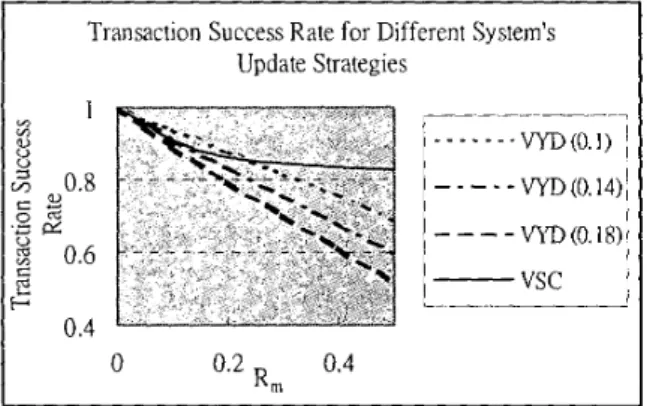
On the other hand, the second factor of system’s update strategy is also of interest. In the base-line simulation, the strategy ‘verified by slot consistency’ (VSC) is used. Another possible strategy ‘verified by yes detection’ ( V Y D ) , i.e., the verification is completed if a ‘Yes’ is detected, elsewhere the slot consistency is checked. In some languages such as Mandarin Chinese, the words meaning ‘No’ may be easily confused with those meaning ‘Yes’, which may lead to incorrect verification and therefore incorrect transaction, while in other languages such problem doesn’t exist at all. It is therefore interesting to see how the rate for such misrecognition of taking ‘No’ as ‘Yes’
(I?,,,)
affects the transaction success rate, which is shown in Figure 6. According to Figure 6 , the choice of the strategy VSC or VYD depends on the value of R,,,. If ‘No’ is easily confused with ‘Yes’ (e.g. R,, 20.18), i t is proper to choose VSC. Otherwise, the best strategy should be determined based on the operating point of R, and I?,,,. In other words, for different systems on different languages with different values of R,,, the best choice of system’s confirmation
strategy can in fact be decided quantitatively based on the simulation. Due to the limited space of this paper, not all
simulations for all possible factors can be presented here. However, as can be seen, such simulation approach is a very useful basis for further research on these factors i n dialogue systems.
Finally, the operating regions for the criteria R,, P,, P,,>0.9 and R,,, P,,,, P,,>0.99 with N*,=5 and E*,=O.S for the base-line schemes are shown as the left-bottom area of the respective curves in Figure 7. Therefore, in order to maintain the desired
Transaction Success Rate for Different System’s Update Strategies
0 0.2 0.4
R m
Figure 6. Transaction success rate for different system’s update strategies (R,,,, =0.1,0.14,0.18, RI = 0.2)
Operating Region and Operating Curve 0.4 0.3
2
0 2 0 1 0 0 0.1 0.2 R, 0.3 0.4 Rts,Pnt,Pes>0.9 -Operating Curve- -
-
- -
- . Rts ,Pnt ,Pes>O.95Figure 7. Operating Regions for different criteria and the operating curve of speech understanding
front end (N*,=5 and E*,=0.5)
QOS, the speech understanding front end must be able to operate within the operating region. For example, for a speech understanding front end in Mandarin Chinese with a task of train ticket reservation based on key-phrase spotting and a hierarchical tag-graph search [ 6 ] , the operating curve can be derived by updating the spotting rate, also shown in Figure 7. It is therefore possible for this front end to be tuned such that it can operate within the desired criteria of R I , P,,” P,,>0.9. However, it is actually impossible for this front end to satisfy the criteria of R,s, Pn,, P,,,>0.99 in any case by simply tuning the spotting rate. Such analysis gives a very good direction for designing spoken dialogue systems based on QOS criteria.
5.
CONCLUSION
We have presented in this paper an analysis scheme for dialogue system performance based on simulation. Such a scheme is very efficient without using dialogue corpora. How dialogue performance vanes with respect to different factors and parameters can be analyzed individually because all the factors can be precisely controlled in the simulation, while the quality of service for spoken dialogue systems can be well observed. It can be a powerful tool for developing spoken dialogue systems, and an important basis for further research on spoken dialogue sytems.
6. REFERENCES
[ I ] Walker Marilyn A., etc., “PARADISE: A Framework for
Evaluating Spoken Dialogue Agents”, ICACL, 1997. [ 2 ] Aust Harald and Ney Hermann, “Evaluating Dialog Systems
Used in the Real World”, Proc. ICASSP, 1998.
[ 3 ] Hanrieder Gerhard, Heisterkamp
Paul
and Brey Thomas, “Fly with The EAGLES: Evaluation of the “ACCeSS” Spoken Language Dialogue System”, Proc. ICSLP, 1998.[4] Devillers L. and Bonneau-Maynard H., “Evaluation of Dialog Strategies for a Tourist Information Retrieval System”, Proc. ICSLP, 1998.
[SI
Niimi Y asuhisa and Nishimoto Takuya, “Mathematical Analysis of Dialogue Control Strategies”, Proc. EUROSPEECH, 1999.[ 6 ] Lin Bor-shen, etc., “Hierarchical Tag-Graph Search for Spontaneous Speech Understanding in Spoken Dialogue Systems”, Proc. ICSLP, 1998.