Empirical Investigation of the Relationship between Interaction Level Metric and Class Defects
9
0
0
全文
(2) Table 1: Size of different data types. of Inheritance Tree). CK metrics also include a complexity metric, WMC (Weighted Method per Class), usually defined as the number of methods of. Type. Size value. class in early design phase. IL exploits the class. Boolean. 1. interface and attribute information to provide a more. Integer or Character. 2. simple. Real. 3. method counting. In order to demonstrate the. Array. +2. usefulness of each design metric, empirical validation. Object. 5. accurate. complexity. measurement. than. should be performed. In priori literature, the association. between. the. interface. information. captured by IL and maintenance performance is. should be different, strength is the measurement to. validated by Bandi et al. [4]. Our focus is to. distinguish the complexity of interaction constituted. empirically investigate the relationship between IL. from different data types. The strength of interaction. and class defect count.. is defined as the product of size of the variables involved in an interaction. The size values of different data type are specified based on [4] and we. The organization of the rest of this thesis is as following: In section 2, we introduce IL metric. In. made. section 3, we present the model and experiment. modification in next section. The size values are list. hypotheses. Section 4 describes the design of the. in Table 1. It is necessary to use both number and. experiments,. the. strength because they typically have an inverse. experiment result and Section 5 gives the conclusion.. relationship that decrease in either number or strength. data. collection. process. and. some. modifications.. We. explain. such. could increase the other and vice versa. Here, the. 2. constant k1 and k2 means the different importance of. Definition of Interaction Level. number and strength of interaction. We set these IL provides an estimate design complexity metric. constants to one for simplicity and balance the. when class interface and attributes are defined. It is. influence of number and strength of interaction. IL. calculated based on the maximum interactions. value can be aggregated to different level of. between variables (attributes and parameters) within. granularity. IL for a class is the summation of all. a method. There exist two variables A and B, if the. methods’ IL value in the class . In our work,. value of state of B is (directly or indirectly). constructors and utility functions are excluded for. influenced by the value or state of A, there is an. computing IL metric value.. interaction from A to B. The definition of IL is as following:. 3. Models and Hypotheses. IL = k1 * (value based on number of interactions). IL metric has been subjectively validated by comparing IL values and design experts preference [3]. + k2 * (value based on strength of interactions). and empirically validated the relationship between IL and. Because the complexity of each interaction. maintainability. [4]. by. simple. controlled. experiments. As the previous sections describe, IL is 2.
(3) a more appropriate design complexity metric and to. data item within its methods are complex. That. be an indicator of class defect count. However, it. means there may be complex data dependency. lacks the empirical validation. Therefore, our main. relationships within the class ’. objective was to focus on exploring the relationship. Let’s take a simple example to illustrate this.. between the object-oriented design complexity metric. In a method, two data item interact with each. and the defect count at the class level. After such. other under the situation that they appear in the. relationship has been validated, IL can be used as the. same control flow path. Large number of. class defects indicator. The design of the software. interactions may imply the method consists of. system can be evaluated and developer can figure out. many control flow paths. More control flow. the classes at high risk. That is, more defects may. path implies more complexity for developer.. occur within the class. Designer can try to redesign. Therefore, when the complexity of class. the part at high risk or use other approaches in order. development for developer is high, it results in. to raise the reliability. In order to validate the. more defects.. methods.. relationship, the following hypothesis should be statistically tested.. Large strength of interaction. The size of data type means the relative degree of complexity to. H1: A class has higher IL value will be associated. correctly use a data item in the interaction. For. with higher number of defects.. example, using an object reference data item will be more complex than using a primitive. The dependent variable in our analysis is defect. data type in an interaction. That may cause. count for a class. In previous work, researchers. different degree of influence on class reliability.. proposed binary classification of defects data and. Therefore, the size of object should be larger. used logistic regression models to measure the impact. than primitive data type. Besides, the size of. of design complexity on defects proneness [5][6].. array type is set to “+2”. It means the size of. The drawback of using such binary classification. an integer array is the size of integer plus two.. scheme is that a class with one defect cannot be. The reason to make such setting is, when using. distinguished from a class with ten defects. As a. array, developers need to pay attention to the. result, the true variance of defects in data sample may. size and index of this array. The strength of. not be captured in the empirical analysis. Therefore,. interaction means the complexity to correctly. we use the actual defect count as the dependent. arrange the interaction to achieve the intended. variable in our analysis. From the above, the fist. effect. Thus, large strength may result in more. model is given below:. defects.. (1). Defects = β0 + β1 × IL. Both. Therefore, it is suggested that higher interaction level. A class has high IL value may be caused by. correlates with increased difficulty in determining Large number of interaction. Large number of. how to develop or implement a design. That means a. interaction represents the interactions of the. design with higher interaction level will result in the 3.
(4) detailed design and the implementation of this class. (2). Defects = β0 + β1 × IL + β2 × CBO. to be more difficult. There will be more defects in this class.. In this model, we model a class’ complexity along two different dimension design concept. By combing. However, using IL to indicate the design. CBO, we can model the design complexity of a class. complexity of an object is limited, because it only. more precisely than using IL only. It is expected that. indicates the complexity for interaction between its. the explanation ability of defect count of a class in. surface and its interior of an object. The focus of IL is. the second model will be higher than the first model.. only the internal complexity of class’ methods.. Therefore, we have the second hypothesis.. Therefore, we try to find other existing metrics exploited to describe design complexity of different. H2: By using CBO and IL, the explanation ability. viewpoint. The metric selected is Coupling between. of class defect count will be higher than using IL. Object Classes (CBO) metric of CK metrics suite [7],. or CBO only.. which models the coupling or structural relationship of an object to other objects in software system.. We will test the second hypothesis by comparing the. Coupling means a class uses the methods or instance. R-square values of these two models (1) and (2).. variables of other classes. CBO of a class is defined. 4. as the number of other classes in the system it is. Experiment Analysis. coupled. A class has high CBO value means lots of classes it depends. The meanings of CBO in software. There are several ways to empirically test the. development are stated as the following:. hypotheses.. Firstly,. small. scale. controlled. experiments like homework assignment at school can The higher the CBO value of class, the more. be set up. Although in the small scale controlled. rigorous the testing needs to be.. experiment we may better control the factors which have impact on software quality, such as design. In evaluating class reliability, higher CBO. complexity, student skill, development tools etc, the. value leads to the more difficulties for. defect count of classes in simple project may have. designers and developers to manage and. just little difference. Thus, it may be hard to validate. correctly use these classes provide services.. the relationship between design complexity and class defect count. Secondly, the experiment setting in. In some cases, the classes have similar IL values but. software. industry. different CBO values. In such situations, CBO is the. relationship, but we do not have any available. key point addressing the different design complexity.. industry software data such as design document, the. For example, the complexity to design a class use ten. results of testing etc, to set up experiments. So, our. objects of the same class should differ from design a. approach. class use ten objects of different types. CBO and IL. experimental subjects. We focus on Apache [1] open. should be complementary since they model different. source projects since the projects in Apache Software. design perspectives. Then we have the second model.. Foundation have more detailed documentation and. is. taking. should. open. better. source. reflect. projects. such. as. every java class in a project has its own change log. 4.
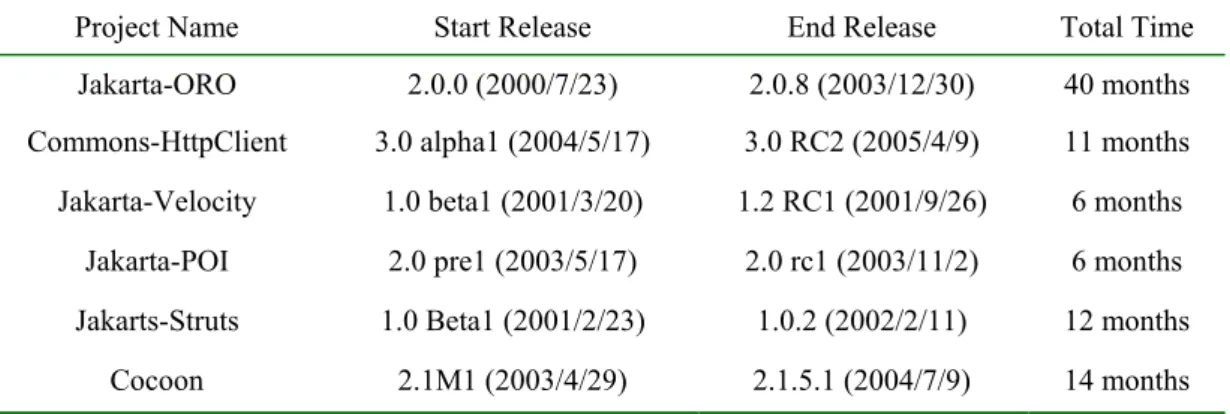
(5) Information about each class of an open source. is the coupling relationship which can be identified at. project can be collected from its change log.. the earlier design phase the same as interaction level. However,. as. applies. And large portion of coupling relationship. experimental subjects has some threats to validity.. can be identified by class interface and instance. We will discuss that at the end of this section.. variables. The small portion of inaccuracy only. adapting. open. source. projects. causes a little influence.. 4.1 Dependent and Independent Variables. 4.2 Experimental Subjects. The dependent variable is the number of defects of. We focus on the projects implemented with Java. each Java class. Java interface is excluded from the. language and follow several principals to take. data samples. The number of defects is defined as the. projects as our experimental subjects. Firstly, the. number of revisions of each Java source class. relationship we want to validate is design complexity. recorded as bug fixing. In the projects we study,. and its influences on class defect count. We identify a. when a revision of a Java class is bug fixing, the. more clear time interval during which major bug fix. revision log will contain the string“ PR: ” or. activities were performed for a particular release in. “ bug ” and some additional information about. the project history. The project document and change. this revision. Here,“ PR ”means problem report,. history help to make the judgement. For example, in. and it associates with the bugzilla bug database [2].. Table 2, the first project is Jakarta-ORO. In this. In this case, we count such revision as a defect. We. project, the interval we identify is from 2.0.0 release. need identify a particular time interval during which. to 2.0.8 release. During this interval, there is other. developers perform major bugs fixing activities.. release, such as 2.0.2, 2.0.3 and so on. The changes. Defect count is collected during this time interval.. documented between these releases contain many bug. The principal to identify this time interval will be. fixing activities. Since the releases following 2.0.0. described in the following section.. contain many bug fixing activities and have the same major release number 2.0, we suggest these activities. The independent variables are IL and CBO. It. are performed for release 2.0. The second principal is. only needs class interface and attribute information to. the number of classes in a project should not change. compute IL and Java reflection technology [12] can. greatly during this time interval. The increasing. easily acquire them. So we use Java reflection APIs. number of classes in the project may imply that some. to implement the metric calculation tool. The IL. other development activities performed to enhance or. value of a class is the summation of IL values of all. improve the functionality of the software, and the. method declared in the class, and inherited methods. changes of design may generate other defects in the. are not included. In our experiment, CBO value. software. Therefore, we assume most of the bug. measurement is only based on the interface and. fixing activities are caused by the design complexity. attributes of a Java class. Although CBO definition. of source release of the software we observed. usually includes not only the classes in the interface. because the number of classes of the project does not. and instance variables but also the variables declared. change greatly in following releases (See Table 3).. locally within the method, what we want to measure 5.
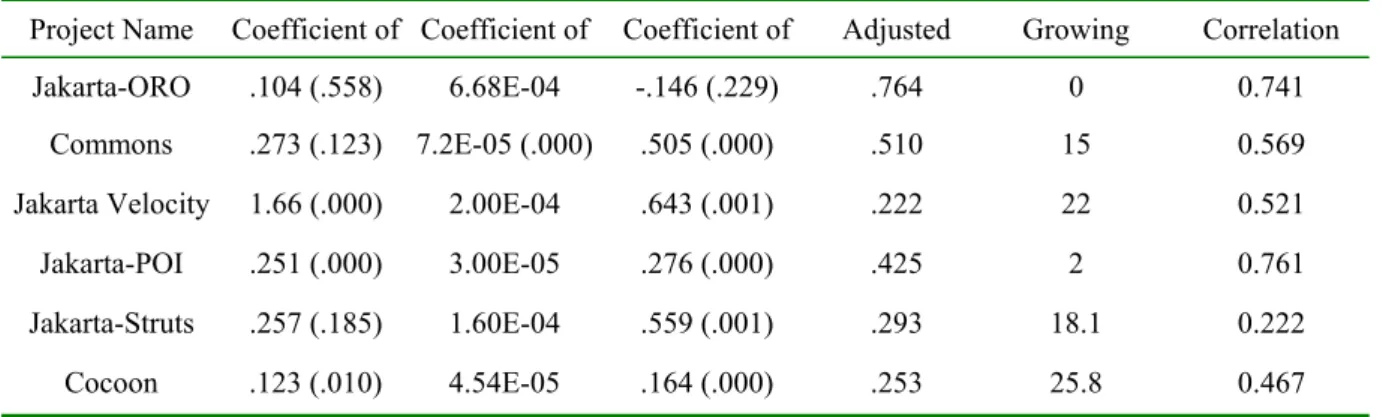
(6) The projects we used in this experiment are. projects and test whether a relationship exists. depicted in Table 2. The first column is the project’. between software metrics and class defect count. If. s name. The second column is the release by which. there is a positive nonzero linear regression. we measured the metrics values. The third column. relationship exists, the coefficient of the independent. depicts the end release, we collect defect data. variables will be larger than zero. Table 4 lists the. between start release and end release. The forth. linear regression models built by using only IL as. column records the total time which we collected. independent variable. Table 5 lists the linear. defects data.. regression models built by using only CBO as the independent variable. And Table 6 lists the linear. 4.3 Experimental Result. regression models built by using IL and CBO as the independent variables. The value followed by the coefficient value is the p-value of the corresponding. We build the linear regression models of the six. Table 2: Release Information of The Experimental Subjects. Project Name. Start Release. End Release. Total Time. Jakarta-ORO. 2.0.0 (2000/7/23). 2.0.8 (2003/12/30). 40 months. Commons-HttpClient. 3.0 alpha1 (2004/5/17). 3.0 RC2 (2005/4/9). 11 months. Jakarta-Velocity. 1.0 beta1 (2001/3/20). 1.2 RC1 (2001/9/26). 6 months. Jakarta-POI. 2.0 pre1 (2003/5/17). 2.0 rc1 (2003/11/2). 6 months. Jakarts-Struts. 1.0 Beta1 (2001/2/23). 1.0.2 (2002/2/11). 12 months. Cocoon. 2.1M1 (2003/4/29). 2.1.5.1 (2004/7/9). 14 months. Table 3: The Class Count of Start and End Release. Project Name. # classes of start release. # classes of end release. Jakarta-ORO. 61. 61. Commons-HttpClient. 120. 129. Jakarta-Velocity. 150. 176. Jakarta-POI. 308. 311. Jakarta-Struts. 176. 185. Cocoon. 495. 515. parameter. The sixth columns in Table 6 are the. higher one of models using single metric only. The. growth of adjusted R-square value compared to the. last column is the correlation between IL and CBO. 6.
(7) 4.3.1 Influence of IL. influence on defect count, it indicates a class has higher IL value will be associated with higher. From Table 4 and 6, the regression results indicate. number of defects. In other words, the class. that increase in IL value associates with increase in. complexity modeled by IL influence the class. defect count because the parameters of IL in six. reliability. Thus IL can be an appropriate class. project regression models are positive. And the. complexity metric. The result supports our hypothesis. p-values of IL’s parameter are all smaller than 0.05.. one. Result of Hypothesis 2: From the observation. That means the influence of IL on class defect count. of the CBO influence on defect count, four out of six. is significant.. multivariate regression models have growth of R-square value about or above fifteen percent.. 4.3.2 Influence of CBO. Although IL and CBO have some correlation, basically they model different dimension design. From Table 5, six multivariate regression models. properties. That is why the adjusted R-square value. show that increase in CBO value associates with. increases. Thus, this indicates CBO and IL are. increase in defect count since the coefficients of CBO. complementary class defect count indicators. The. in these models are positive and significant with the. result supports our hypothesis two.. p-values are smaller than 0.01. From Table 6, five out. 4.4 Threats to Validity. of six models show the similar result. The exception is Jakarta-ORO. In this project, the univariate analysis about CBO indicates the impact of CBO is. In the experiments, we want to investigate the. positive and significant. But, in the multivariate. relationship between design complexity and class. regression model, the coefficient of CBO becomes. defect count collected during a particular timing. negative. Besides, in the models of Jakarta-ORO and. interval performing testing activities. However, some. Jakarta-POI, the multiple regression analysis with. factors have effects on the experiment result. During. two. to. the time interval we collect class defects, some other. determine the explanatory ability of these variables.. development activities are performed such as. These models almost did not show any increase in. enhancement or update. Because we did not. adjusted R-square. All of these are symptoms of. distinguish when the defects exist in the software and. collinearity. We find that the correlation values. these activities may generate additional defects. between CBO and IL in these two models are. counted as the defects caused by design complexity. relatively higher than others. IL and CBO account for. before enhancement or update, these activities result. most of the same variance in class defect count. That. in the inaccuracy of the relationship between design. may be the reason for the adjusted R-square value did. complexity and defect count. Design complexity of. not increase. (Table 6: correlation for Jakarta-ORO is. some projects are not first major release. For example,. 0.741 and correlation for Jakarta-POI is 0.761).. Commons-HttpClient is 3.0 alpha release 1. In these. independent. variables. was. performed. projects, some classes in the system are developed. 4.3.3 Discussion of Result. from the project initiation. They may be tested and corrected after the previous several major releases. The classes in the software system undergo different. Result of Hypothesis 1: From the observation of IL 7.
(8) Table 4: Linear Models Using IL as the Independent Variable. Project Name. Coefficient of Intercept. Coefficient of IL. Adjusted R-square. Jakarta-ORO. -2.158E-02 (.882). 6.1E-04 (.000). .762. Commons-HttpClient. .734 (.000). 1.28E-04 (.000). .365. Jakarta-Velocity. 2.35 (.000). 3.26E-04 (.000). .161. Jakarta-POI. .418 (.000). 9.7E-05 (.000). .316. Jakarta-Struts. .635 (.000). 1.77E-04 (.000). .248. Cocoon. .268 (.000). 6.14E-05 (.000). .201. Table 5: Linear Models Using CBO as the Independent Variable. Project Name. Coefficient of Intercept. Coefficient of CBO. Adjusted R-square. Jakarta-ORO. -.255 (.395). .707 (.000). .309. Commons-HttpClient. .215 (.257). .715 (.000). .434. Jakarta-Velocity. 1.55 (.000). .922 (.000). .182. Jakarta-POI. .230 (.000). .348 (.000). .415. Jakarta-Struts. .461 (.038). .808 (.000). .101. Cocoon. .121 (.016). .260 (.000). .166. Table 6: Linear Models Using IL and CBO as the Independent Variables. Project Name. Coefficient of Coefficient of. Coefficient of. Adjusted. Growing. Correlation. Jakarta-ORO. .104 (.558). 6.68E-04. -.146 (.229). .764. 0. 0.741. Commons. .273 (.123). 7.2E-05 (.000). .505 (.000). .510. 15. 0.569. Jakarta Velocity. 1.66 (.000). 2.00E-04. .643 (.001). .222. 22. 0.521. Jakarta-POI. .251 (.000). 3.00E-05. .276 (.000). .425. 2. 0.761. Jakarta-Struts. .257 (.185). 1.60E-04. .559 (.001). .293. 18.1. 0.222. Cocoon. .123 (.010). 4.54E-05. .164 (.000). .253. 25.8. 0.467. development time, and the development time has. same. But During the time interval we identify, more. effect on the class defect count. In our experiment,. defects may be founded in newly defined or modified. we regard the development time of each class as the. classes than the classes tested before and to be fit in 8.
(9) quality indicators,” IEEE Transactions on Software Engineering, vol. 22, no. 10, pp. 751-781, Oct. 1998.. new context.. 5 Conclusion Firstly,. we. empirically. investigate. [6]. L. C. Briand, J. Wust, S. V. Ikonomovski, and H. Lounis, “Investigating quality factors in object oriented designs: An industrial case study,” Proceedings of the 21st international conference on Software engineering, pp. 345-354, May 1999.. [7]. S. R. Chidamber and C. F. Kemerer, “A metrics suite for object oriented design,” IEEE Transactions on Software Engineering, vol. 20, no. 8, pp. 476-493, June 1994.. [8]. G. K. Gill and C. F. Kemerer, “Cyclomatic complexity density and software maintenance productivity,” IEEE Transactions on Software Engineering, vol. 17, no. 12, pp. 1284-1288, Dec. 1991.. [9]. Java Reflection Technology. http://java.sun.com/j2se/1.3/docs/guide/reflectio n/. [10]. W. Li and S. Henry, “Object-oriented metrics that predict maintainability,” Journal of Systems and Software, vol. 23, no. 2, pp. 111-122, Nov. 1993.. [11]. T. J. McCabe, “A complexity measure,” IEEE Transactions on Software Engineering, vol. 2, no. 4, pp. 308-320, Dec. 1978.. [12]. V. Y. Shen, T.-J. Yu, S. M. Thebaut, and L. R. Paulsen, “Identifying error-prone software -an empirical study,” IEEE Transactions on Software Engineering, vol. 11, no. 4, pp. 317-324, April 1985.. [13]. I. Sommerville, Software Addison-Wesley, 6 ed., 2000.. [14]. R. Subramanyam and M. Krishnan, “Empirical analysis of CK metrics for object-oriented design complexity: Implications for software defects,” IEEE Transactions on Software Engineering, vol. 29, no. 4, pp. 297-310, April 2000.. the. relationship between IL metric and class defect count. The results seem to show IL can be an indicator of the class defects during design phase. Secondly, by combing CBO and IL to model the design complexity of a class, there is higher explanation ability of the empirical models to explain class defect count. This implies the quality of a class can be modeled in different dimensions software design. Using design complexity metrics would be able to help developers to make design inspection more efficient and provide useful information to developers.. Acknowledgments This research is supported by the Taiwan National Science Council (NSC) under contract NSC-94-2213-E-006-075.. References [1]. Apache Software http://www.apache.org. Foundation.. [2]. Apache Software Foundation Bug System. http://issues.apache.org/bugzilla. [3]. D. H. Abbott, T. D. Korson, and J. D. McGregor, “A design complexity metric for object-oriented development,” Tech. Rep. 94-105, Department of Computer Science, Clemson University, 1994. [4]. R. K. Bandi, V. K. Vaishnavi, and D. E. Turk, “Predicting maintenance performance using object oriented design complexity metrics,” IEEE Transaction on Software Engineering, vol. 29, no. 1, Jan. 2003.. [5]. V. R. Basili, L. C. Briand, and W. L. Melo, “A validation of object-oriented design metrics as 9. Enginnering..
(10)
數據
相關文件
Wang, Solving pseudomonotone variational inequalities and pseudocon- vex optimization problems using the projection neural network, IEEE Transactions on Neural Networks 17
Define instead the imaginary.. potential, magnetic field, lattice…) Dirac-BdG Hamiltonian:. with small, and matrix
The empirical results indicate that there are four results of causality relationship between Investor Sentiment and Stock Returns, such as (1) Investor
Through the use of SV clustering combing with one-class SVM and SMO, the hierarchical construction between Reuters categories is built automatically. The hierarchical
Microphone and 600 ohm line conduits shall be mechanically and electrically connected to receptacle boxes and electrically grounded to the audio system ground point.. Lines in
• To achieve small expected risk, that is good generalization performance ⇒ both the empirical risk and the ratio between VC dimension and the number of data points have to be small..
/** Class invariant: A Person always has a date of birth, and if the Person has a date of death, then the date of death is equal to or later than the date of birth. To be
To convert a string containing floating-point digits to its floating-point value, use the static parseDouble method of the Double class..
