Mallipattu Sreedhar Yang-Wei Lin Wei-Lung Tseng Huan-Tsung Chang
Department of Chemistry, National Taiwan University, Taipei, Taiwan
Determination of tertiary amines based on pH
junctions and field amplification in capillary
electrophoresis with electrochemiluminescence
detection
A stacking approach based on pH junction and field amplification has been developed for determining amines by capillary electrophoresis (CE) with electrochemi-luminescence (ECL) detection. A two-electrode configuration was employed with an indium/tin oxide-coated glass as a working electrode and a platinum wire as a pseu-doreference electrode. The ECL system also contains a flow cell (poly(di-methylsiloxane)-aluminum oxide) that was made from a mixture of Sylgard 184 silicone elastomer, a curing agent, and aluminum oxide. In order to improve the sensitivity of the present CE-ECL system using tris(2,2’-bipyridyl) ruthenium(II) (Ru(bpy)3
21 ), a stacking approach based on pH junctions and field amplification has been tested for the analysis of triethylamine (TEA), tripropylamine (TPA), and tributylamine (TBA). Once amines (cations) prepared in citric acid solution (pH , 4.0) migrate towards the back-ground electrolyte (15 mMsodium borate at pH 8.0), they slow down and are stacked at the boundary as a result of deprotonation and decreases in the electric field. By applying hydrodynamic injection of the sample for 60 s, this method provides the con-centration limits of detection (signal-to-noise ratio = 3) of 24, 20, and 32 nM for TEA, TPA, and TBA, respectively. The results indicate that the stacking CE-ECL system is better than CE-ECL systems using a two-electrode configuration and comparable to those using a three-electrode configuration. The potential applicability of the new and low-cost CE-ECL system has been demonstrated by the determination of 1.0 mM lido-caine, a local anesthetic drug, in urine without any tedious sample preparation. Keywords: Capillary electrophoresis / Indium tin oxide electrode / Poly(dimethylsiloxane)-Al2O3
electrochemiluminescence cell / Stacking/ Trialkylamines / Tris(2,2’-bipyridyl) ruthenium(II) DOI 10.1002/elps.200500009
1 Introduction
In recent years, ruthenium(II) complex-based electro-chemiluminescence (ECL) system has received enor-mous attention in analytical applications such as detec-tors in chromatography and flow injection analysis and chemical sensors because of its high sensitivity, simpli-city, low cost, and ease of miniaturization [1–8]. The basic ECL mechanism involves the emission from excited-state species that are produced by electron-transfer reactions
in the vicinity of the working electrode surface. Tris(2,2’-bipyridyl) ruthenium(II) (Ru(bpy)321) is one of the most widely used ECL reagents because of its chemical stabil-ity and favorable electrochemical properties. The ECL signal produced from the reaction of amines with Ru(bpy)3
21
involves several steps: (i) an amine radical is formed from the reaction between a strong reductant (Ru(bpy)321) and an amine, (ii) the amine radical reacts with oxidized Ru(bpy)331to form excited Ru(bpy)321*, and (iii) light is generated when the excited Ru(bpy)321* re-leases energy to return to Ru(bpy)321[9–11]. With its high sensitivity to trialkylamines, Ru(bpy)321-based ECL detection has been applied for the determination of trialkylamines and drugs containing tertiary amino groups [12–17]. Because ECL reactions require only minute amounts of analytes, ECL detection is quite suitable in CE. CE-ECL has proven itself as a sensitive, selective, efficient, and rapid analytical tool for determining amines [18, 19]. It is important to note that the stability of ECL detection is greater than that of amperometric detection, Correspondence: Professor Huan-Tsung Chang, Department of
Chemistry, National Taiwan University, 1, Sec. 4, Roosevelt Road, Taipei 106, Taiwan
E-mail: changht@ntu.edu.tw Fax: 1886-2-2362-1963
Abbreviations: CAS, citric acid solution; d.c., direct current; ECL, electrochemiluminescence; HV, high voltage; ITO, indium/ tin oxide; PDMS, poly(dimethylsiloxane); PDMSAO, PDMS-alu-minum oxide; TBA, tributylamine; TEA, triethylamine; TPA, tri-propylamine
CE
and
which is easily affected by the high-voltage (HV) electric field and the adsorption of analytes on the working elec-trode.
To overcome the interference of ECL signals from HV, which is applied to drive the separation, an electric field decoupler (off-column modes) is employed to isolate the ECL detection from CE HV [20–23]. However, introduc-tion of a decoupler to a CE system is not easy and time-consuming. Another greater concern is that band broad-ening usually occurs in the off-column mode, leading to a loss of resolution. To overcome these disadvantages and to minimize HV effects, CE separation with low-conductivity buffer and small inner diameter of capillaries (50 and 25 mm) has been suggested [24–26]. Using indium/tin oxide (ITO) working electrodes in CE-ECL systems, Chiang et al. [24, 25] reported LODs in the range of 1.0–5.0 mM for triethylamine (TEA), tripropyla-mine (TPA), and tributylatripropyla-mine (TBA). The use of an ITO electrode simplifies the alignment between the separa-tion capillary and the detecsepara-tion electrode. However, a need of machined work for fabrication of the working electrode, large void volumes at the detection cell, and inconvenience in the cell assembly are its limitations. The other drawbacks include spreading of epoxy glue in the working electrode and leakage of the solution from the contact area between the ITO electrode and the pipette vial.
A number of stacking techniques have been developed to improve the sensitivity of analytes in CE, which offer the advantages of simplicity and high stacking efficiency (generally 10–1000-fold improvements in sensitivity) [27– 33]. Among several stacking methods, including field-amplified sample stacking (FASS), pH-mediated stacking, pH junction, use of polymer solution, and sweeping, FASS is most frequently used because of its simplicity. In FASS, analytes are prepared either in dilute buffer or in pure water. When HV is applied, the analytes in the sample plug will experience greater electric field, which accel-erates the analytes to migrate towards the background electrolyte (BGE). As a result, the analytes slow down between the sample and the BGE and thus are stacked into a narrower zone when compared to the original sample plug. Techniques based on dynamic pH junctions that are generated in a multisection electrolyte system are useful for concentrating ionic solutes in CE [34–36]. When amines are prepared in an acidic solution (pH , pKa values of the amines), they slow down and are stacked at the boundary between the sample zone and the BGE (higher pH) as a result of decreases in the degree of pro-tonation [34]. When applying pH-junction techniques in CE-ECL systems, pH effects on resolution and ECL sig-nals of trialkylamines with Ru(bpy)321 must be carefully considered.
The aim of this work is to lower the LODs for the determi-nation of amines by applying a stacking approach based on pH junctions and field amplification using a lab-made CE-ECL system. To simplify the connection between the separation capillary and ECL detector and to increase light collection efficiency, a flow cell of poly(dimethoxy-silane)-Al2O3 (PDMSAO) was fabricated and used [37]. The lab-made CE-ECL system was employed to analyze standard samples of TEA, TPA, and TBA, as well as urine samples containing lidocaine.
2 Materials and methods
2.1 Chemicals
Ru(bpy)3Cl2?6H2O (98%), TEA (99.5%), TPA (99%), TBA (98.5%), Al2O3,lidocaine, and all chemicals used for pre-paring the electrolytes were obtained from Aldrich (Mil-waukee, WI, USA). Sylgard 184 silicone elastomer and a curing agent were purchased from Dow Corning (Midland, MI, USA). Deionized water was used to prepare aqueous solutions. Unless otherwise noted, 15.0 mMsodium borate solution (pH 8.0) adjusted with hydrochloric acid was used as the running electrolyte, and 15.0 mMsodium borate so-lution (pH 8.0) containing 5.0 mMRu(bpy)321was employed to fill the detection cell (250.0 mL).
2.2 Fabrication of the ECL detection cell
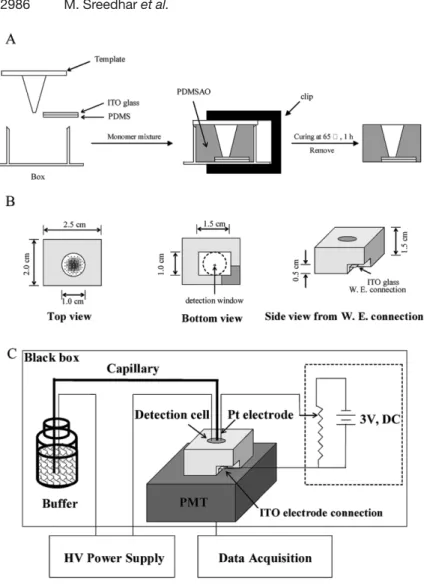
A mixture of Sylgard 184 silicone elastomer, a curing agent, and Al2O3 (10:1:0.25 w/w) was degassed in a vacuum tank for 30 min in order to minimize the formation of bubbles during curing. In order to fabricate a flow cell, a template containing a cone tip with a sharp end of 700 mm ID in a plastic plate (3 6 6 cm) and a plastic box having the dimensions (l 6 w 6 d) of 2.5 6 2.0 6 2.5 cm with one side open was used (Fig. 1A). An ITO glass slide (1.5 cm 6 1.0 cm 6 0.6 mm) and one piece of poly(di-methylsiloxane) (PDMS) substrate were placed in the box. Prior to use, the ITO glass slide that was cut from an ITO-coated glass plate (Delta Technologies, Stillwater, MN, USA) was washed with detergent and water before being subjected to sonication in ethanol and then in water for 15 min each. The mixture of monomer was poured into the box and the box was then covered with the template. A clip was used to ensure a good contact between the cone end and the ITO glass. After curing at 657C for 1 h, the polymer formed and the plastic template were removed carefully from the cell. The as-prepared cell (PDMS-aluminium oxide, PDMSAO) was removed from the plastic box (right and middle in Fig. 1B). In order to connect the ITO working electrode to the ECL power supply
Figure 1. (A) Fabrication of a PDMSO ECL cell, (B) different views of the ECL cell, and (C) schematic diagram of the CE-ECL system.
system (see Section 2.3), a small portion (1.56 1.5 cm2) of the bottom of the PDMSAO cell was cut as shown in Fig. 1B (right). The schematic setup of the CE-ECL sys-tem is depicted in Fig. 1C.
2.3 Apparatus
A silica-fused capillary with 75 mm ID and 360 mm OD was purchased from Polymicro Technologies (Phoenix, AZ, USA). The capillary outlet (detection side) was cut care-fully with a ceramic cutter and the flatness was examined under an inverted microscope (IX 70, Olympus, Tokyo, Japan). A platinum wire was used as the pseudoreference electrode. Two 1.5 V direct current (d.c.) batteries and a variable resistor were used to fabricate the ECL power supply system that allows to apply a desired voltage for generating ECL signals. A cutoff filter (450 nm) was placed on the exit of a black box, which contained a photo-multiplier tube (PMT) (R928 from Hamamatsu,
Shizuoka-Ken, Japan) to collect the ECL emission. The ECL detec-tion cell was then put on the top of the cutoff filter. In order to precisely control the distance between the capillary outlet and the ITO electrode, the whole detection system was put on an x-y-z microtranslational stage. The ampli-fied photocurrent was transferred directly to a 10 kO to a 24-bit A/D interface at 10 Hz (CSW 1.7, DataApex, Czech Republic) and stored in PC. An HV power supply (PR30–2; Gamma High Voltage Research, Ormond Beach, FL, USA) was used to drive the electrophoretic separation. To prevent interferences from stray light and for safety, the entire CE-ECL system besides the HV power supply was kept in a black box.
2.4 Electrophoresis procedure
The silica-fused capillary was treated with 0.1M NaOH overnight, and then flushed with water and electrolyte each for 5 min prior to separation. Amines prepared in
citric acid solutions (CASs) were injected into the capillary filled with sodium borate solution (pH 8.0). In this study, 10.0 mM (pH 2.8), 1.0 mM (pH 3.2), and 0.1 mM (pH 4.0) CASs were tested. Hydrodynamic sample injection was carried out at 15 cm height for a desired time (up to 60 s). The anodic and cathodic vials (flow cell) were filled with 15.0 mM sodium borate solution (pH 8.0) and 15.0 mM sodium borate solution (pH 8.0) containing 5.0 mM Ru(bpy)321, respectively. The separation electric field was 167 V/cm and the ECL applied voltage was 1.7 V unless otherwise noted. To achieve repeatability, the capillary was reequilibrated with 0.1MNaOH, water, and the elec-trolyte, each for at least 5 min after three runs.
2.5 Lidocaine spiked in a urine sample
Six aliquots of 980 mL healthy male urine samples were spiked with different amounts of lidocaine (1.0–10.0 mM) prepared in 1.0MHCl. The spiked samples (500 mL) were then diluted with 500 mL of 0.1 mM CAS (pH 4.0). To achieve reproducible results, the capillary was flushed with water, 0.1M NaOH, and 0.1 mMCAS (pH 4.0), each for 5 min after every run. The plate heights against lido-caine concentration were plotted to evaluate the practical applicability of the new method.
3 Results and discussion
3.1 Optimization of ECL signal
The ECL intensity depends upon the rate of the ECL chemical reaction and the distance between the capillary outlet and the working electrode. To achieve a maximum ECL signal, the applied potential and the concentration of Ru(bpy)321 must be carefully evaluated. Using an ECL system (without conducting CE), we found that the onset values of the ECL signal for the three trialkylamines are all around 0.5 V. The ECL signal increases with increasing applied voltage and reaches the plateau at around 1.7 V. We note that, to simplify the alignment and avoid the problems such as contamination and leakage associated with the use of glue, a PDMSAO cell was utilized in this study. When compared to a PDMS cell, the PDMSAO cell provides fourfold sensitivity improvement, mainly be-cause of its greater light collection efficiency. It is also important to point out that the ECL intensity is repeatable in 50 measurements with an RSD of 2.8%. According to the fact that the amount of Ru(bpy)331 produced from Ru(bpy)321at the ITO electrode surface is the limiting fac-tor for the ECL signal, we evaluated the concentration effect of Ru(bpy)321on the ECL signals [38]. The ECL sig-nals for the trialkylamines (0.1 mM) linearly increase with
increasing Ru(bpy)321 concentration over the range of 0.0–30.0 mM in this study. Although the ECL signal increases on decreasing the distance between the capil-lary outlet and the ITO electrode, we must carefully con-sider greater interferences from the separation HV as the distance is decreased. By using an x-y-z microtransla-tional stage, we were able to precisely control the dis-tance (,100 mm). As a result, the reproducibility of the ECL intensity for three different ECL cells (each with five runs) is good; the RSD value is less than 3.0%.
3.2 BGE
The optimum pH value for the ECL of tertiary amines is suggested to be around 8.0–9.0; we thus tested CE separation using sodium borate and phosphate buffer solutions (pH 8.0) [38]. Sodium borate solution provides excellent buffer capacity, which is important for generat-ing reproducible ECL intensity, especially under dis-continuous conditions (discussed later). When compared to phosphate buffer, we found that tetraborate solution provides greater sensitivity, more symmetric peak pro-files, and less Joule heating effects. To prevent generation of high Joule heats that affect resolution and reproduci-bility, the capillary was filled with 15.0 mMsodium borate solution (pH 8.0). Although the ECL signal increases on increasing the concentration of Ru(bpy)321 in the ECL system, a flow cell (cathodic vial) filled with 15.0 mM sodium borate solution (pH 8.0) containing 5.0 mM Ru(bpy)3
21
was used in this study. The CE-ECL system provides slightly lower sensitivity (about fourfold) when Ru(bpy)321 at 5.0 mMthan at 30.0 mM is used. Although the sensitivity is optimized at pH 8.0, CE separation of the tertiary amines (pKa9.0–10.0) is difficult under this condi-tion, mainly because of high EOF and small electropho-retic mobilities. In order to lower down EOF and to achieve greater electrophoretic mobility, we tested the separation under discontinuous conditions; the capillary was filled with high-pH BGE and the analytes were pre-pared in a low-pH solution. Using such discontinuous conditions, stacking of the analytes based on pH junc-tions is also possible (discussed later). Because EOF mobility in BGE usually increases dramatically at a pH greater than 4.0 when a fused-silica capillary is used, only samples prepared in CAS (pH , 4.0) were tested. An acceptable discontinuous condition was generated by the following configuration: the samples were prepared in CAS (pH , 4.0), the capillary and the anodic vial were fil-led with 15.0 mMsodium borate solution (pH 8.0), and the detection cell was filled with 15.0 mMsodium borate so-lution (pH 8.0) containing 5.0 mMRu(bpy)321. Using these conditions, TEA, TPA, and TBA were separated within 8 min (see Section 3.3).
3.3 Stacking and separation under discontinuous conditions
To further improve the CE-ECL sensitivity for the amines under discontinuous conditions addressed in Section 3.2, stacking techniques based on pH junctions are worth trying. After injecting a large-volume sample, the posi-tively charged amines prepared in CAS (pH , 4.0) migrate to the BGE (pH 8.0) when HV is applied; they slow down and are stacked at the boundary between the sample and the BGE zones [31–34]. In addition to pH junctions, the electric field plays a role in determining the stacking effi-ciency under discontinuous conditions. In order to further maximize the stacking efficiency resulting from field amplification, the ionic strength of the sample zone has to be kept low. In this study, we tested three different CASs: 10.0 mM (pH 2.8), 1.0 mM (pH 3.2), and 0.1 mM (pH 4.0). The first one is likely to provide the highest stacking effi-ciency based on pH-junction effect, while the last one should provide the highest stacking efficiency from the view point of the stacking dependence of the electric field. Among the three cases, 0.1 mMCAS (pH 4.0) pro-vides the highest sensitivity improvement, best separa-tion efficiency, and reproducibility of the migrasepara-tion time (Fig. 2). The stacking efficiency is lower (threefold com-pared to that using 0.1 mMCAS) when 10 mMCAS (higher ionic strength and better buffer capacity) is used, mainly because of a weaker field amplification and a slow pH change rate in the sample zone in the course of stacking. The use of high concentrations of CAS also causes irre-producibility as a result of pH changes and ion inter-ferences in the detection cell. Table 1 summarizes the effect of CAS on migration time, peak height, and resolu-tion when injecting the samples for 1 min. Under the three conditions (pH , 4.0), the pH impact on bulk EOF is neg-ligible, but the ionic strength plays a role in determining the bulk EOF. The bulk EOF decreases with increasing ionic strength of the sample solution: 10.0 mM CAS , 1.0 mMCAS , 0.1 mMCAS. We point out that the ionic strengths of the last two cases are smaller
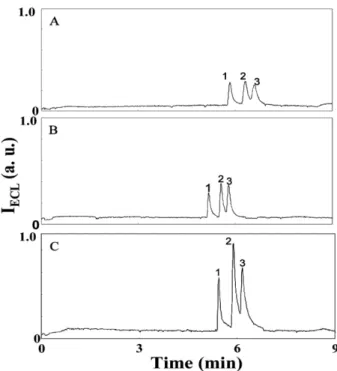
com-Figure 2. Electropherograms of three amines. Sample solutions were prepared in (A) 10.0 mM (pH 2.8), (B) 1.0 mM (pH 3.2), and (C) 0.1 mM (pH 4.0) CAS solutions. Electrophoresis condition: 15.0 mMsodium borate buffer (pH 8.0) in anodic vial; separation voltage, 10 kV; hydro-dynamic injection at 15 cm height for 60 s; and a capillary (75 mm ID and 360 mm OD) 60 cm total length, 50 cm effective length, and filled with 15.0 mM sodium borate buffer (pH 8.0). Detection condition: 15.0 mM sodium borate buffer (pH 8.0) containing 5.0 mMRu(bpy)321in the detection cell and the applied d.c. potential of 1.7 V. Analyte concentration, 10.0 mM. Peak identities: (1) TEA, (2) TPA, and (3) TBA.
pared to that of 15.0 mMsodium borate solution (pH 8.0). When 1.0 mMCAS (pH 3.2) is used, the separation of the three amines is slightly faster than that using 0.1 mMCAS (pH 4.0) because the electrophoretic mobilities of the three amines are greater at pH 3.2 than at pH 4.0. In the case of 1.0 mM CAS, the amines migrated in a low pH
Table 1. Effects of ionic strength and pH of CASs on migration time, peak height, and resolution when injecting the sample mixtures for 1 mina)
Sample matrix Migration time (min) (RSD%, n = 3)
Peak height (mV) Resolution
CAS (mM) pH TEA TPA TBA TEA TPA TBA TEA/TPA TPA/TBA
0.1 4.0 5.44 (1.1) 5.89 (1.4) 6.16 (1.2) 0.48 0.75 0.54 2.7 1.4
1.0 3.2 5.17 (2.3) 5.55 (2.0) 5.79 (1.9) 0.23 0.31 0.30 2.3 1.1
10.0 2.8 5.80 (1.8) 6.34 (2.1) 6.43 (2.8) 0.22 0.26 0.19 2.2 0.9
environment for a slightly longer time because of its greater buffer capacity. We note that it will take some time for the system to reach equilibrium when a long plug of sample solution with a good buffer capacity is injected although acid-base equilibrium is a very rapid event. The electro-phoretic mobilities of the three amines at pH 2.8 (higher ionic strength) are comparable to those at 3.2, but the separation is longer in 10.0 mM CAS (pH 2.8), mainly be-cause of a low bulk EOF as a result of a greater fraction of low local EOF (sample zone has a greater buffer capacity and a higher ionic strength).
To further show the merit of this method for the determina-tion of trace amounts of the three analytes, the sample pre-pared in 0.1 mMCAS was diluted tenfold before the injection. Sharp peak profiles (the plate numbers are greater than 1.1 6 105plates/m) shown in Fig. 3 reveal effective stacking of the analytes. The RSD values of migration time for the three analytes are less than 1.6%. The migration times for the three analytes are longer in the case of 5 s injection (not shown), mainly because the analytes migrate in a high-pH BGE once the HV is applied. Slight differences in the migra-tion times for the three amines from those shown in Fig. 2C are due to slight differential pH values and ionic strengths in the two sample solutions. In comparison of the peak heights, the stacking approach provides about 20-fold improvement in sensitivity when compared to those injected for 5 s. With a sensitivity improvement, the method allows the determina-tion of the three analytes at the concentradetermina-tions of 0.1 mM(not shown). Based on the peak heights and the noise level in the baseline, we estimated that the concentration LOD (S/N = 3) for the TEA, TPA, and TBA are 24, 20, and 32 nM, respec-tively. The ECL signals (peak heights) for the three amines against the injection time (volume) are linear over the range 0–60 s, with the correlation coefficients (R2) greater than 0.96. When the sample zone is too long (. 60 s injection), peaks overlap and resolution decreases as a result of inef-fective stacking and a parabolic flow of the separation elec-trolyte caused by the discontinuous buffer system.
Figure 3. Separations of three amines (1.0 mM) prepared in 0.1 mMCAS by CE-ECL. Other conditions are the same as in Fig. 2.
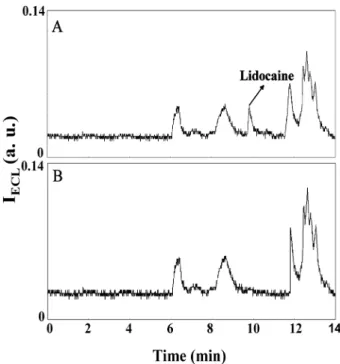
Figure 4. Electropherograms of urine samples (A) with, (B) without containing 10.0 mMlidocaine. Other conditions are the same as in Fig. 2C.
3.4 Method applicability
The clinical applicability of the developed method was demonstrated by the determination of lidocaine in urine samples. Lidocaine is an antiarrhythmic agent, also extensively used as a local anesthetic [39]. Figure 4A shows that there are several peaks including the one corresponding to lidocaine that was spiked in the urine sample. We point out that the RSD values for the peak height and migration time for lidocaine in three con-secutive measurements are 3.6 and 2.8%, respectively. When compared to the electropherogram depicted in Fig. 4B, it is clear that the unidentified peaks corre-spond to the solutes in the urine. By plotting the peak height against lidocaine concentration over a range of 3.0–100.0 mM, a linear relationship with correlation coefficient of 0.991 and an LOD (S/N = 3) of 1.0 mM for lidocaine in the urine were achieved. The LOD is about ten times higher than that prepared in 0.1 mM CAS so-lution, mainly because of a poor stacking efficiency and greater ion interferences (instability of ECL signals) in a complicated matrix (high-conductivity medium). We note that a CE-ECL system using a three-electrode configuration and a voltammetric analyzer has been developed for detecting lidocaine with an LOD of 45 nM after a tedious sample preparation [26]. Although the approach provides better sensitivity for lidocaine, tedious sample pretreatment was not conducted in our method. We also note that the present CE-ECL system
is less costly and very compact, which is suitable for on-field applications. Also, improved sensitivity for ter-tiary amines can be anticipated when a voltammetric analyzer and a three-electrode configuration are employed in the stacking CE-ECL system.
4 Concluding remarks
We reported stacking and separation of trialkylamines by CE-ECL system. The PDMSAO cell provides the advan-tages of easy adaptation of the separation system to the detection system and greater light collection efficiency. One merit of PDMSAO cell is that it can be reused when the electrodes need to be replaced. We have demon-strated that pH and field amplification play important roles in determining ECL signal, stacking efficiency, and reso-lution. Using discontinuous conditions, the sensitivity for the three analytes improved at least 20-fold as a result of stacking. The determination of lidocaine in a urine sample shows a potential of the CE-ECL system for the analysis of drugs. Owing to low cost, rapidity, sensitivity, selectiv-ity, and simplicselectiv-ity, the developed CE-ECL system is highly suitable for pharmacokinetic studies.
This work was supported by the National Science Council of Taiwan under contracts NSC 92–2811-M-002–057 and NSC 93–2113-M-002–034.
Received January 4, 2005
5 References
[1] Faulkner, L. R., Bard, A. J. (Eds.), Electroanalytical
Chem-istry, Marcel Dekker, New York 1997, pp. 1–95.
[2] Knight, A. W., Trends Anal. Chem. 1999, 18, 47–62. [3] Gerardi, R. D., Barnett, N. W., Lewis, S. W., Anal. Chim. Acta
1999, 378, 1–41.
[4] Fähnrich, K. A., Pravda, M., Guilbault, G. G., Talanta 2001,
54, 531–559.
[5] Kozlov, V. G., Bulovic, V., Burrows, P. E., Forrest, S. R.,
Na-ture 1997, 389, 362–364.
[6] Fan, F.-R. F., Cliffel, D., Bard, A. J., Anal. Chem. 1998, 70, 2941–2948.
[7] Zu, Y., Ding, Z., Zhou, J., Lee, Y., Bard, A. J., Anal. Chem. 2001, 73, 2153–2156.
[8] Forry, S. P., Wightman, R. M., Anal. Chem. 2002, 74, 528– 532.
[9] Rubinstein, I., Bard, A. J., J. Am. Chem. Soc. 1981, 103, 512–516.
[10] Kulmala, S., Suomi, J., Anal. Chim. Acta 2003, 500, 21–69. [11] Richter, M. M., Chem. Rev. 2004, 104, 3003–3036.
[12] Barnett, N. W., Gerardi, R. D., Hampson, D. L., Russell, R. A., Anal. Commun. 1996, 33, 255–260.
[13] Knight, A. W., Greenway, G. M., Anal. Commun. 1996, 33, 171–174.
[14] Song, Q., Greenway, G. M., McCreedy, T., Analyst 2001,
126, 37–40.
[15] Liu, J., Cao, W., Qiu, H., Sun, X., Yang, X., Wang, E., Clin.
Chem. 2002, 48, 1049–1058.
[16] Sun, X., Liu, J., Cao, W., Yang, X., Wang, E., Fung, Y. S.,
Anal. Chim. Acta 2002, 470, 137–145.
[17] Liu, J., Cao, W., Yang, X., Wang, E., Talanta 2003, 59, 453– 459.
[18] Liu, J., Yang, X., Wang, E., Electrophoresis 2003, 24, 3131– 3138.
[19] Cao, W., Yang, X., Wang, E., Electroanalysis 2004, 16, 169– 174.
[20] Hendrickson, H. P., Anderson, P., Wang, X., Pittman, Z., Bobbitt, D. R., Microchem. J. 2000, 65, 189–195.
[21] Wang, X., Bobbit, D. R., Talanta 2000, 53, 337–345. [22] Dickson, J. A., Ferris, M. M., Milofsky, R. E., J. High Resolut.
Chromatogr. 1997, 20, 643–646.
[23] Bobbit, D. R., Jackson, W. A., Hendrickson, H. P., Talanta 1998, 46, 565–572.
[24] Chiang, M.-T., Whang, C.-W., J. Chromatogr. A 2001, 934, 59–66.
[25] Chiang, M.-T., Lu, M.-C., Whang, C.-W., Electrophoresis 2003, 24, 3033–3039.
[26] Cao, W., Liu, J., Qiu, H., Yang, X., Wang, E., Electroanalysis 2002, 14, 1571–1576.
[27] Beckers, J. L., Bocˇek, P., Electrophoresis 2000, 21, 2747– 2767.
[28] Osbourn, D. M., Weiss, D. J., Lunte, C. E., Electrophoresis 2000, 21, 2768–2779.
[29] Pittman, J. L., Gessner, H. J., Frederick, K. A., Raby, E. M., Batts, J. B., Gilman, S. D., Anal. Chem. 2003, 75, 3531– 3538.
[30] Weiss, D. J., Saunders, K., Lunte, C. E., Electrophoresis 2001, 22, 59–65.
[31] Quirino, J. P., Terabe, S., J. Chromatogr. A 2000, 902, 119– 135.
[32] Hsieh, M.-M., Hsu, C.-E., Tseng, W.-L., Chang, H.-T.,
Elec-trophoresis 2002, 23, 1633–1641.
[33] Kuo, I.-T., Chiu, T.-C., Chang, H.-T., Electrophoresis 2003,
24, 3339–3347.
[34] Kim, J.-B., Britz-McKibbin, P., Hirokawa, T., Terabe, S., Anal.
Chem. 2003, 75, 3986–3993.
[35] Britz-McKibbin, P., Bebault, G. M., Chen, D. D. Y., Anal.
Chem. 2000, 72, 1729–1735.
[36] Britz-McKibbin, P., Otsuka, K., Terabe, S., Anal. Chem. 2002, 74, 3736–3743.
[37] Qiu, H., Yan, J., Sun, X., Liu, J., Cao, W., Yang, X., Wang, E.,
Anal. Chem. 2003, 75, 5435–5440.
[38] Lee, W.-Y., Nieman, T. A., Anal. Chem. 1995, 67, 1789–1796. [39] Goodman, G. (Ed.), The Pharmacologic Basis of
Ther-apeutics, 9th Edn., McGraw-Hill, New York 1996, pp. 338–
![TraditionalMLCalgorithmsmainlytacklethebatchMLCproblem,wheretheinputdataarepresentedinabatch[24,28].Nevertheless,inmanyMLCapplicationssuchase-mailcategorization[22],multi-labelexamplesarriveasastream.Onlineanalysisistherefore dimensionreducermotivatedbyma](data:image/gif;base64,R0lGODlhAQABAIAAAP///wAAACH5BAEAAAAALAAAAAABAAEAAAICRAEAOw==)