Microstructural Evolution at the Bonding Interface during the
Early-Stage Infrared Active Brazing of Alumina
R.K. SHIUE, S.K. WU, J.M. O, and J.Y. WANG
Infrared brazing of Al2O3and alloy 42 using a silver-base active braze alloy was investigated at 900 8C for 0 to 300 seconds, with a heating rate of 3000 8C/min. Experimental results show that Ti3(Cu,
Al)3O intermetallic with various amounts of Al is observed in the reaction layer and plays an important
role in the early stage of reactive wetting. A two-layer structure is observed at the reaction interface brazed at 900 8C for 5 seconds. The reaction layer close to the alumina contains large amounts of Al, so the mass balance of the system is maintained. The growth of the reaction layer is not rate controlled by diffusion within the first 120 seconds. After 120 seconds, the rate controlling mechanism of the reaction layer becomes the diffusion control, satisfying the parabolic law. Dynamic wetting angle measurements using a traditional vacuum furnace at the heating rate of 108C/min demonstrate that the wetting angle rapidly decreases within the first 150 seconds, especially 0 to 80 seconds, and eventually stabilizes after 600 seconds.
I. INTRODUCTION Much research has focused on the interfacial reaction kinetics between active filler alloy and ceramics.[21–25]Most
W
ITHthe rapid development of ceramics, superalloys,of these studies are performed by traditional electric resis-and composite materials, traditional ways of brazing are
tance heating. However, it is difficult to study the interfacial insufficient to meet the requirement of joining these
materi-reaction kinetics in the early stage of active brazing if the als. Traditional brazes cannot make a good joint between
heating rate of furnace is not fast enough. For instance, the ceramic materials due to the difficulty of wetting, even when
melting point of Ag-Cu eutectic alloy is 7808C. Titanium their surfaces are clean.[1–4]Most structural ceramics, e.g.,
will be dissolved into Ag-Cu eutectic melt for temperatures alumina, silicon carbide, and zirconia, are chemically more
above 7808C. The brazing temperature of Ag-Cu eutectic stable than metals, and they will not be wetted by traditional
with 4.5 wt pct Ti alloy is 9008C. The heating rate of the brazes unless the braze contains an active element. Active
electric resistance heating furnace is 108C/min, and it takes brazing is a process using a braze filler alloy containing an
720 seconds to reach the brazing temperature. Consequently, active element such as Ti, Zr, V, and Cr.[2,4,5–10]For example,
the reaction kinetics between 0 and 720 seconds are difficult titanium is one of the most frequently used elements as an
to be studied in such a furnace. Infrared brazing makes use active constituent of silver-base active braze alloys.[6,7,9,10]
of infrared energy generated by heating a tungsten filament Moreover, the active element in the braze can only be
effec-in a quartz tube as the heateffec-ing source, provideffec-ing rapid heateffec-ing tive if sufficiently high temperatures are used for the joining
and cooling up to 30008C/min; therefore, infrared brazing operation so that the active ingredient is able to react with
is highly suitable in studying the mechanism of early stage the ceramics.[2,11]Therefore, the active ingredient plays an
reactive wetting.[26,27]
important role in active brazing.
The purpose of this investigation is to study the joining The activity of the active element in braze is very
of alumina and alloy 42 with Ag-Cu-Ti active filler metal important, since it dominates the mechanism of reactive
by infrared brazing. The early stage (especially 0 to 300 wetting during active brazing. For example, the active
ele-seconds) of the reactive brazing is studied. The microstruc-ment cannot strongly react with other elemicrostruc-ment(s) in the braze
tural evolution with various brazing times at the interface alloy, or the activity of the active element may be greatly
between alumina, the braze filler metal, and the active braze decreased by formation of intermetallic compounds. Much
itself is examined by scanning transmission electron micro-research has demonstrated that Ti is an active element in
scope (STEM) and electron probe microanalysis (EPMA), copper and silver-base braze alloys.[7,10,11]The addition of
respectively. The phase(s) at the reaction layer will be identi-Ti to silver/copper alloys improves the wettability of many
fied based on STEM analysis. ceramics.[12–16] There are many commercially available
active braze alloys in use.[4,17]Ag-Cu eutectic with 4.5 wt
pct Ti is one of the most popular active silver-base braze
II. EXPERIMENTAL PROCEDURE alloys used in metal-ceramic joining.[18,19,20]
The experimental materials were high-purity alumina (purity. 99.95 pct) and alloy 42 (42Ni-58Fe in wt pct). R.K. SHIUE, Assistant Professor, is with the Institute of Materials Science The active filler braze was TICUSIL,* 68.8Ag-26.7Cu-4.5Ti and Engineering, National Dong Hwa University, Hualien 974, Taiwan,
Republic of China. S.K. WU, Professor, and J.M. O, former Graduate Student, *TICUSIL is a trademark of Wesg. Co., Belmont, CA 94002. are with the Institute of Materials Science and Engineering, National Taiwan
University, Taipei 106, Taiwan, Republic of China. J.Y. WANG, Deputy in wt pct. The dimensions of alloy 42 were 103 10 3 2 Section Head, is with the Materials R&D Center, Chung-Shan Institute of
mm. The size of the alumina disk was 10 mm in diameter Science and Technology, Lung-Tan 325, Taiwan, Republic of China.
(a) Fig. 1—Schematic diagrams showing the geometry of graphite fixture in
the test.
50 mm throughout the experiment. The alloy 42 surfaces were first polished by SiC paper and subsequently polished by 1, 0.3, and 0.05mm alumina powder. All alumina surfaces were polished using 1 mm diamond paste. An ultrasonic bath using acetone as the solvent was used to clean samples prior to brazing. Infrared brazing was performed in a vacuum of 53 1023 Pa at a temperature of 900 8C for 5, 10, 20, 40, 60, 80, 120, 150, 180, 240, and 300 seconds. The heating rate of the infrared furnace was set at 30008C/min through-out the experiment.
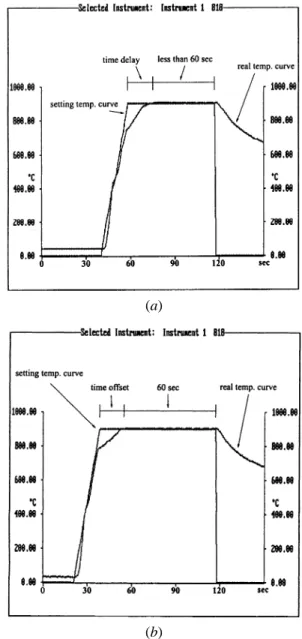
To enhance infrared absorption of the specimen, a graphite fixture was used during brazing, as displayed in Figure 1. Specimens were sandwiched between two graphite plates, and the thermal couple was inserted into the graphite plate. There is a time delay between the actual specimen
tempera-(b) ture and programmer temperature. Figure 2(a) shows the
heating cycle of 60 seconds without time compensation. It Fig. 2—The thermal cycle of 60 s heating: (a) without time compensation is clear that the actual holding time is less than 60 seconds and (b) with time compensation
in the figure. Figure 2(b) displays the same cycle with time compensation. The time delay will have a strong effect in
the test if the brazing time is short, such as 5 seconds. JEOL** JXL-8600SX EPMA. All samples were carbon Therefore, time compensation during the infrared brazing
**JEOL is a trademark of Japan Electron Optics Ltd., Tokyo. was included for all tests in this study.
Dynamic wetting angle measurements were made using coated before SEM or EPMA examination. A JEOL JEM-a trJEM-aditionJEM-al resistJEM-ance vJEM-acuum furnJEM-ace JEM-at the temperJEM-ature 4000FX STEM equipped with an energy-dispersive spectro-range between 880 8C and 900 8C for 0 to 1800 seconds.
scope (EDS) was used for both structural and chemical anal-Samples of 0.15 g TICUSIL were prepared from its foil by ysis of the interface between TICUSIL and alumina, using vacuum arc remelting. A TICUSIL sample was put on the
an accelerating voltage of 400 kV. All STEM specimens alumina disk in vacuum furnace for wetting angle measure- were dimple ground using 0.25mm diamond paste, followed ments. The heating rate of the furnace was set at 108C/min
by ion mill sharpening. throughout the experiment.
The brazed specimens were cut by a low speed diamond
saw. An etching solution 2 g FeCl3 1 30 mL H2O1 10 III. RESULTS AND DISCUSSIONS
mL HCl 1 60 mL C2H5OH was used for metallographic
A. Metallographic Observations of the Active Filler examination. The cross-polished section of the brazed
speci-Metal mens was examined using a PHILIPS* XL30 SEM, and
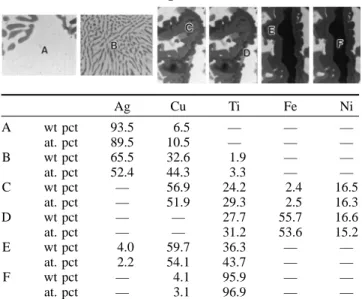
Figure 3 displays the SEM backscattered electron images *PHILIPS is a trademark of Philips Electronic Instruments Corp.,
Mah-of the brazed joint after infrared brazing for 5, 20, 60, 120, wah, NJ.
180, and 300 seconds. Six phases are found in the braze filler metal, excluding the reaction layer, and they are shown quantitative chemical analysis was performed using a
Fig. 3—The SEM backscattered electron images of the braze joint after infrared brazing for (a) 5, (b) 20, (c) 60, (d ) 120, (e) 180, and ( f ) 300 s.
in Table I: (A) silver-rich solid solution with 6.5 wt pct F phases having disappeared. With increased brazing time, phase A is replaced by phase B and phases C and D move copper, (B) silver-copper eutectic solid solution with 1.9 wt
pct titanium, (C) copper-rich alloy phase, (D) iron-rich alloy toward the reaction layer between alumina and active braze filler metal. If the brazing time exceeds 180 seconds, only phase, (E) Cu-Ti alloy solid solution with 4.0 wt pct silver,
and (F) titanium matrix solid solution with 4.1 wt pct copper. B, C, and D phases are found in the SEM observation. A summary of the microstructural evolution in the braze alloy The chemical composition of E phase in Table I is very
close to that of Cu4Ti3 phase according to the Cu-Ti for various brazing times is shown in Table II.
The Ti distribution in TICUSIL foil is not uniform, and phase diagram.[28,29]
According to the experimental results, the microstructural the SEM inspection shows a long Ti wire in the foil, as illustrated in Figure 4. Therefore, there was insufficient time evolution of the braze filler metal can be divided into several
stages over the time period of 0 to 300 seconds. If the brazing to dissolve all the Ti into the active braze filler metal with a brazing time below 40 seconds. As the brazing time is time is less than 40 seconds, all six phases can be found in
the braze, as shown in Figures 3(a) and (b), although the increased, all of the Ti is dissolved into braze. The melting point of pure Ti is much higher than that of the Ag-Cu-Ti braze is primarily comprised of phases A and B. Phase F is
totally enclosed by phase E, and the volume fraction of both braze. By dissolving the titanium into solution, the titanium transport is greatly enhanced. Titanium could react with phases is decreased with increasing brazing time. Phases C
and D are observed at the locations close to alloy 42, and alloy 42 (Fe-Ni alloy) to form phases C and D. Meanwhile, Ti would also be transported into the interface between the they have a chainlike morphology. For specimens brazed
between 40 and 180 seconds, there are only four phases, A, alumina and the braze alloy to form a reaction layer. It has also been reported that Ti is associated with copper in B, C, and D, observed in the filler metal, with both E and
Table I. The Chemical Analysis of Different Phases in Figure 3 Ag Cu Ti Fe Ni A wt pct 93.5 6.5 — — — at. pct 89.5 10.5 — — — B wt pct 65.5 32.6 1.9 — — at. pct 52.4 44.3 3.3 — — C wt pct — 56.9 24.2 2.4 16.5
at. pct — 51.9 29.3 2.5 16.3 Fig. 4—SEM inspection of TICUSIL foil used in the experiment.
D wt pct — — 27.7 55.7 16.6
at. pct — — 31.2 53.6 15.2
E wt pct 4.0 59.7 36.3 — — x2/t should approach a constant value for a fixed
diffusion-at. pct 2.2 54.1 43.7 — — controlled growth. Figure 7 demonstrates the relationship
F wt pct — 4.1 95.9 — — between x2/t and t. The value of x2/t approaches a constant
at. pct — 3.1 96.9 — — for the brazing time greater than 120 seconds. Therefore,
the growth kinetics of the reaction layer is rate controlled by diffusion at times greater than 120 seconds. On the other hand, the growth of reaction layer is not consistent with the TICUSIL melt during brazing.[29]The consumption of Ti in
the melt due to the reactions with other elements would mechanism of rate controlling by diffusion if the brazing time is less than 80 seconds. The growth kinetics of the result in decomposition of Cu-Ti compound in the melt and
the simultaneous release of Cu into the melt. Therefore, the reaction layer for short brazing times cannot be identified in the experiment and needs further study.
volume fraction of Ag-Cu eutectic phase is increased after
brazing. The area of silver-rich matrix decreases with Figure 8 shows the dynamic wetting angle measurements in the sessile drop experiments of TICUSIL brazed on alu-increasing brazing time, as shown in Figure 3. The
micro-structural evolution is completed at 180 seconds, since there mina for various brazing temperatures using a traditional vacuum furnace at a heating rate of 108C/min. The higher is no silver-rich matrix, as shown in Figure 3(e).
the brazing temperature, the lower the dynamic wetting angle that can be obtained. The dynamic wetting angle of the B. The Interfacial Reaction between Alumina and
specimen tested at 900 8C is 5 to 20 deg lower than that
Active Braze of the specimen tested at 880 8C. The experimental data
demonstrate that the wetting angle rapidly decreases within Figure 5 shows the SEM backscattered electron image of
the reaction layer between alumina and active filler metal the first 150 seconds, especially within 0 to 80 seconds. The wetting angle is stabilized if the brazing time exceeds 600 brazed at 9008C for 5, 20, 60, 120, 180, and 300 seconds,
respectively. Figure 6 shows the relation between the reac- seconds. As discussed earlier, the growth kinetics of the reaction layer is rate controlled by diffusion for long brazing tion layer thickness and brazing time at the alumina/
TICUSIL interface. If the growth of reaction layer is rate times. The transport of Ti into the interface becomes slower due to the increased thickness of the interface. It is noted controlled by the same diffusion mechanism, it should be
governed by the parabolic growth law of the reaction that the wetting angle observations are not consistent with the Ti distribution, especially at 0 to 180 seconds, as described in layer:[30,31]
Section A. It primarily results from the slow heating rate, x5 (kpt)1/2 [1] 108C/min, of the electric heating furnace used in the wetting
angle measurement. where x is reaction layer thickness, t is reaction time, and
kp is the parabolic growth rate constant. In other words, Much research has been focused on modeling the kinetics
Table II. Summary of the Microstructural Evolution in the Braze Alloy for Various Brazing Times
Phase 0 to 40 s 40 to 180 s 180 to 300 s
Phase A: Ag-rich solid solution with 6.5 wt exist (primary phase) exist (gradually replaced by phase B) disappear
pct Cu
Phase B: Ag-Cu eutectic solid solution with exist (primary phase) exist (primary phase) exist (primary phase)
1.9 wt pct Ti
Phase C: Cu-rich alloy phase exist exist exist
Phase D: Fe-rich alloy phase exist exist exist
Phase E: Cu-Ti alloy solid solution with 4 exist disappear disappear
wt pct Ag
Phase F: Ti matrix solid solution with 4.1 exist (enclosed by phase E) disappear disappear
Fig. 5—The SEM backscattered electron image of the reaction layer between alumina and active filler metal brazing at 9008C for (a) 5, (b) 20, (c) 60, (d ) 120, (e) 180, and ( f ) 300 s.
Fig. 6—The relation between the reaction layer thickness and brazing time
Fig. 7—The relation between x2/t and t at 9008C.
interface brazed at 900 8C for 5 seconds. Since the EDS analysis cannot identify oxygen atoms, the oxygen content is not included in this analysis. Based on the chemical analy-sis, the atomic ratio between Ti and (Cu, Al) is very close to 1:1. Some interfaces contain two reaction layers, as shown in Figure 11. Based on the SADP analysis together with the EDS result, shown in Figures 11(b) and (c), respectively, point B can be identified as the Ti3(Cu, Al)3O phase. Figure
12 is the TEM analysis of the alumina/TICUSIL interface brazed at 9008C for 20 seconds. A similar atomic Ti/(Cu, Al) ratio is observed, and some Fe and Ni are found at the reaction layer. It is consistent with the previous EPMA analysis shown in Figure 9. Figure 13 shows the STEM1 EDS analysis of the interface brazed at 900 8C for 300 Fig. 8—The dynamic wetting angle measurement of TICUSIL braze on
alumina for various brazing temperatures by using a traditional vacuum seconds, where two layers can be observed. However, the furnace at the heating rate of 108C/min. atomic ratio between Ti and (Cu, Al) is changed in both layers, with huge amounts of Fe and Ni being observed in the reaction layers.
Many researchers have contributed to the understanding of the reactive wetting in metal/ceramic systems.[21,32–34]
of metal-ceramic interfaces.[36–47]Carim[43]found that
com-Eustathopoulos[34]proposed that there are three possible rate- pounds with stoichiometry M
6X (M5 metal(s), X 5 B, C,
limiting mechanisms in reactive wetting: viscous flow, diffu- N, or O) of thehgroup are observed at a number of metal-sion within the sessile drop, and chemical kinetics at the ceramic interfaces, especially in the reaction layer of ceram-triple line. He concluded that reactive wetting is not rate ics brazed with Ti-containing active filler metals. Two differ-limited by viscous flow due to the low viscosity of molten ent specific compounds, MI
4MII2X and MI3MII3X, could be
metal. The final contact angle in a reactive system is given found in the reaction layer. For instance, both Ti4Cu2O and
with good accuracy by the equilibrium contact angle of the Ti3Cu3O intermetallics can be formed after brazing. This
liquid on the reaction product. This is consistent with our has been supported by many other experimental results in experimental observations. The reaction layer rapidly active brazing of alumina.[44–47]Based on the STEM1 EDS
becomes continuous, and it isolates the alumina and the analysis in this study, a Ti3(Cu, Al)3O phase is formed at
braze filler metal, as shown in Figure 5. Therefore, the the very early stage (5 and 20 seconds) of active brazing reactive wetting is rate controlled by either transport or alumina. It has been reported that Al could dissolve easily chemical reaction of the reactive element at the interface. in the Ti3Cu3O type compound, which is consistent with our
Figures 9(a) and (b) display the results of EPMA line study.[46,48] The Al content in the reaction layer close to
scan analysis across the alumina/TICUSIL interface brazed alumina is high, as shown in Figures 11(a) and (c). However, at 9008C for 5 and 80 seconds, respectively. The interface the titanium oxides such as TiO, Ti2O, and Ti3O2 reported
is enriched in Ti and Cu for both the 5- and 80-second in other research are not observed in this study.[45, 46]
specimens, but Ag is not found at the interface. The Fe and Ni enrichment at the interface for the 5-second specimen is observed, and it becomes more prominent for the 80-second
C. Reaction Mechanism of Infrared Active Brazing specimen. Since most diffusion coefficients in liquid metals
Alumina have the same order of magnitude, 1028 to 1029m2/s, the
diffusion distance of Ni and Fe atoms in braze melt can be Ternary alloy phase diagrams only describe the phase approximated by the square root of Dt.[35]Thus, the diffusion
evolution of an equilibrium system. The Ti in the active filler distance of Ni and Fe atoms in the melt for 5 seconds is metal reacts with other elements during infrared brazing, and approximately 70 to 220 mm, which is much larger than the phases in the braze may not reach equilibrium due to the thickness of braze filler metal, 50mm. This feature is the fast infrared heating process. Therefore, the phase change consistent with our experimental observation that both Fe in the process cannot be precisely described by the phase and Ni atoms have dissolved into the braze melt at 9008C diagram. However, a ternary phase diagram of Ag-Cu-Ti
for 5 seconds. could still provide some basic information for the system.
The minimum spot size of the EPMA in this study is Figure 14 displays the liquidus surface of Ag-Cu-Ti ternary about 1mm. Namely, the actual sampling volume is usually phase diagram.[29]The active filler metal used in this study
much greater than 1mm in diameter. However, the thickness has a chemical composition of 55.3Ag-36.5Cu-8.2Ti in of reaction layer is less than 1 mm for specimens brazed atomic percent. According to the figure, there are two immis-less than 180 seconds. High-resolution STEM 1 EDS ible liquids, L9
1and L92, in the melt at 9008C.[44]The liquid
inspection is necessary in order to analyze the structure and L9
1 is Cu/Ti-rich phase with the chemical composition of
chemical composition of the reaction layer. The spot size of 63Cu-32Ti-5Ag (at. pct); and L9
2 is Ag-rich phase with
EDS used in this study is 20 nm, which is much smaller the chemical composition of 68Ag-30Cu-2Ti (at. pct). The than the observed reaction layer. The diameter of aperture equilibrium equation at 9008 Cis shown as follows: size in the selected area diffraction pattern (SADP) analysis
is 1 mm, which is greater than the reaction layer thickness L911 CuTi } L921 Cu4Ti3 [2] of the specimen brazed at 9008C for 5 seconds. Figure 10
Fig. 9—EPMA line scan analysis of alumina/TICUSIL interface brazing at 9008C for (a) 5 and (b) 80 s.
ternary phase diagram displayed in Figure 14, the equilib- forms Ti3(Cu, Al)3O at the reaction layer. Barbier et al.[45]
rium at c1, about 8508C, would be reached as follows:[29] proposed that the Ti
3Cu3O layer acts as a wettable surface
promoting bonding between alumina and active filler metal. L } Cu4Ti3(liquid equilibrates with Cu4Ti3) [3] This characteristic is consistent with our results that the
dynamic wetting angle rapidly decreases at the beginning As discussed earlier, phase E in Table I is observed at the
of reactive wetting. Ti3(Cu, Al)3O phase is identified in
initial stage (0 to 40 seconds) of infrared brazing, and its
STEM examination at the very early stage (5 seconds) of chemical composition is close to a Cu4Ti3 solid solution
brazing, and no titanium oxides are observed in the study. with minor Ag, according to EDS analysis. This is consistent
In addition to providing a wettable surface, Ti3(Cu, Al)3O
with the phase diagram and can explain the microstructural
could also form a solid solution with a very large amount evolution of the braze alloy at the initial stage.
of aluminum that is rejected from the reaction of alu-The reactive wetting of alumina primarily depends on Cu/
(a)
(a)
(b)
(b) Fig. 10—STEM1 EDS analysis of the alumina/TICUSIL interface brazed
at 9008C for 5 s: (a) bright field; and (b) EDS analysis of points A, B, C, D, and E marked in part (a).
in the reaction layers in order to maintain the mass balance (c)
in the system. The formation of the Ti3(Cu,Al)3O reaction
Fig. 11—STEM1 EDS analysis of the alumina/TICUSIL interface brazed layer can dissolve the aluminum atoms rejected from the at 9008C for 5 s: (a) bright field of the two-layered interface, (b) SADP interface of reaction between alumina and braze. With analysis of point B, and (c) EDS analysis of point A and B marked in part (a). increasing of brazing time, the dissolution of alloy 42 occurs.
In addition, Fe and Ni atoms react with the braze and take
silver-copper eutectic within 180 seconds brazing. The part in the reaction layer. Therefore, the chemical
composi-microstructure of the braze is approximately constant tion of the reaction layer deviates from Ti3(Cu, Al)3O, as
between 180 and 300 seconds. demonstrated in Figure 13.
2. The growth kinetics of the reaction layer obeys the para-bolic law if the brazing time exceeds 120 seconds. It is IV. CONCLUSIONS not rate controlled by diffusion of reaction element(s) in 80 seconds brazing. It could be that the reaction layer Based on the characteristics of rapid heating by an infrared
involves the presence of Ti. Because of the inhomogene-furnace, the joining of Al2O3 and alloy 42 using a silver- ity of Ti distribution in the braze alloy, Ti is not dissolved
base active braze alloy at 9008C for 0 to 300 seconds is
completely in the melt for the first 40 seconds. investigated. The heating rate is set at 30008C/min during
3. A sessile drop experiment was performed by using a infrared joining. The conclusions drawn are as follows.
traditional vacuum furnace at the heating rate of 108C/ min for 8808C, 890 8C, and 900 8C. The wetting angle 1. The microstructural evolution of the braze filler metal is
divided into several stages. First, the Ti wires of the filler rapidly decreases within 150 seconds, especially the first 0 to 80 seconds, then stabilizes after 600 seconds at 900 metal are completely dissolved into the braze melt in less
than 40 seconds, forming Ag/Cu/Ti, Cu/Ti/Ni/Fe, Fe/Ti/ 8C. The wetting angle tested at 900 8C is 5 to 20 deg lower than that of the specimen tested at 880 8C. Ni, and Cu/Ti phases. Second, the silver-rich matrix is
replaced by silver-copper eutectic matrix, and the reaction 4. The Ti3(Cu, Al)3O phase is observed in the reaction layer
and plays an important role in the early stage of reactive products, Cu/Ti/Ni/Fe and Fe/Ti/Ni phases, grow
(a) Fig. 14—Liquidus projection of Ag-Cu-Ti ternary phase diagram.[29]
increased brazing time, Fe and Ni atoms of alloy 42
(b) can take part in the reaction layer, and the chemical
composition of the reaction layer deviates from Ti3(Cu, Fig. 12—STEM1 EDS results of the alumina/TICUSIL interface brazed
at 9008C for 20 s: (a) bright field and (b) EDS analysis of point A in (a). Al)3O.
ACKNOWLEDGMENTS
The authors gratefully acknowledge the financial support of this study by the National Science Council (NSC), Repub-lic of China, under NSC Grant No. 88-2216-E002-026.
REFERENCES
1. E. Lugscheider and W. Tillmann: Mater. Manufacturing Processes, 1993, vol. 8, pp. 219-38.
2. G. Humpston and D.M. Jacobson: Principles of Soldering and Brazing, ASM INTERNATIONAL, Materials Park, OH, 1993, pp. 111-18. 3. M.M. Schwartz: Brazing, ASM INTERNATIONAL, Materials Park,
OH, 1987, pp. 116-25.
4. M.M. Schwartz: Ceramic Joining, ASM INTERNATIONAL, Materi-als Park, OH, 1989, pp. 75-139.
5. A.P. Xian: J. Mater. Sci., 1993, vol. 28, pp. 1019-30.
6. A.K. Chattopadhyay and H.E. Hintermann: J. Mater. Sci., 1993, vol. 28, pp. 5887-93.
(a) 7. F. Tamai and M. Naka: J. Mater. Sci. Lett., 1996, vol. 15, pp. 1353-54. 8. N. Iwamoto, Y. Makino, and H. Miyata: Trans. JWRI, 1986, vol. 15(1),
pp. 55-59.
9. M. Naka, H. Taniguchi, and I. Okamoto: Trans. JWRI, 1990, vol. 19 (2), pp. 29-34.
10. R.R. Kapoor and T.W. Eagar: Metall. Trans. B, 1989, vol. 20B, pp. 919-24.
11. P.R. Chidambaram, G.R. Edwards, and D. L. Olson: Metall. Mater. Trans., 1994, vol. 25A, pp. 2083-90.
(b) 12. J.G. Li: Ceram. Int., 1994, vol. 20, pp. 391-412.
13. C. Odegard and A. Bronson: JOM, 1997, vol. 49 (6), pp. 52-54. Fig. 13—STEM1 EDS results of the alumina/TICUSIL interface brazed
14. M. Naka, T. Tanaka, and I. Okamoto: Trans. JWRI, 1985, vol. 14 (2), at 9008C for 300 s: (a) bright field; and (b) EDS analysis of point A, B,
pp. 85-91. and C marked in (a).
15. M. Naka, K. Sampath, I. Okamoto, and Y. Arata: Trans. JWRI, 1983, vol. 12 (2), pp. 181-83.
16. Y. Nakao, K. Nishimoto, and K. Saida: Trans. Jpn. Welding Soc., 1989, vol. 20 (1), pp. 66-76.
interface brazed at 9008C for 5 seconds. The reaction 17. D.L. Olson et al.: ASM Handbook, vol. 6, Welding, Brazing and layer close to alumina contains a large amount of Al, Soldering, ASM INTERNATIONAL, Materials Park, OH, 1993, pp.
948-60. and the mass balance of the system is maintained. With
32. G. Wang and J.J. Lannutti: Metall. Mater. Trans. A, 1995, vol. 26A, 18. M. Nomura, C. Iwamoto, and S.I. Tanaka: Acta Mater., 1999, vol. 47
(2), pp. 407-13. pp. 1499-1506.
33. A. Mortensen, F. Hodaj, and N. Eustathopoulos: Scripta Mater., 1998, 19. R.E. Loehman and A.P. Tomsia: Acta Mater., 1992, vol. 40, Suppl.,
pp. S75-S83. vol. 38, pp. 1411-17.
34. N. Eustathopoulos: Acta Mater., 1998, vol.46, pp. 2319-27. 20. R.E. Loehman and A.P. Tomsia: J. Am. Ceram. Soc., 1994, vol. 77,
pp. 271-74. 35. D.R. Poirier and G.H. Geiger: Transport Phenomena in Materials Processing, TMS, Warrendale, PA, 1994, pp. 448-53.
21. A. Meier, P.R. Chidambaram, and G.R. Edwards: Acta Mater., 1998,
vol. 46, 12, pp. 4453-67. 36. M. Naka, J.C. Feng, and J.C. Schuster: Metal. Mater. Trans., 1997, vol. 28A, pp. 1385-90.
22. P. Kritsalis, L. Coudurier, and N. Eustathopoulos: J. Mater. Sci., 1991,
vol. 26, pp. 3400-08. 37. H. Xiong, C. Wan, and Z. Zhou: Metall. Mater. Trans. A, 1998, vol. 29A, pp. 2591-96.
23. W. Tillmann and E. Lugscheider: J. Mater. Sci., 1996, vol. 31, pp.
445-52. 38. E. Saiz, A.P. Tomsia, and R.M. Cannon: Acta Mater., 1998, vol. 46, pp. 2349-61.
24. F. Tamai and K. Hirano: JSME Int. J., 1996, vol. 39A, pp. 613-19.
25. F. Ernst: Mater. Sci. Eng., R14, 1995, No. 3, pp. 97-156. 39. K.F. Lin and C.C. Lin: Scripta Mater., 1998, vol. 39, pp. 1333-38. 40. C. Iwamoto and S.I. Tanaka: Acta Mater., 1998, vol. 46, pp. 2381-86. 26. S.J. Lee, S.K. Wu, and R.Y. Lin: Acta Mater., 1998, vol. 46, pp.
1283-95. 41. S.D. Peteves, M. Paulasto, G. Ceccone, and V. Stamos: Acta Mater., 1998, vol. 46, pp. 2407-14.
27. S.J. Lee, S.K. Wu, and R.Y. Lin: Acta Mater., 1998, vol. 46, pp.
1297-1305. 42. G. Dehm, C. Scheu, M. Ruhle, and R. Raj: Acta Mater., 1998, vol. 46, pp. 759-72.
28. T.B. Massalski et al.: Binary Alloy Phase Diagrams, 2nd ed., ASM
INTERNATIONAL, Materials Park, OH, 1990, pp. 1494-96. 43. A.H. Carim: Scripta Mater., 1991, vol. 25, pp. 51-54.
44. M. Paulasto and J. Kivilahti: J. Mater. Res., 1998, vol. 13, pp. 343-52. 29. P. Villars, A. Prince, and H. Okamoto: Handbook of Ternary Alloy
Phase Diagrams, ASM INTERNATIONAL, Materials Park, OH, 45. F. Barbier, C. Peytour, and A. Revcolevschi: J. Am. Ceram. Soc., 1990, vol. 73, pp. 1582-86.
1996, pp. 2353-60.
30. T. Torvund, O. Grong, O.M. Akselsen, and J.H. Ulvensoen: J. Mater. 46. S. Suenaga, M. Nakahashi, M. Maruyama, and T. Fukasawa: J. Am. Ceram. Soc., 1997, vol. 80, pp. 439-44.
Sci., 1997, vol. 32, pp. 4437-42.
31. D.B. Lee, J.H. Woo, and S.W. Park: Mater. Sci. Eng., 1999, vol. A268, 47. W. Byun and H. Kim: Scripta Mater., 1994, vol. 31, pp. 1543-47. 48. G.P. Kelkar and A.H. Carim: Mater. Lett., 1995, vol. 23, pp. 231-35. pp. 202-07.