國立臺中教育大學資訊工程學系碩士論文
以雲端平台上複合式應用執行效率
為目標之服務部署策略研究
Service Deployment Strategies for Efficient Execution of
Composite SaaS Applications on Cloud Platform
指導教授:黃國展 博士
研究生:沈柏均 撰
誌 謝
本篇碩士論文的完成,首先要感謝指導教授 黃國展老師。對於研究所期間所 遇到的種種困難及研究議題,給予我莫大的幫助,尤其在剛接觸新的研究領域時, 不熟悉以及初期無法達到期望時,不僅以鼓勵代替責備給了學生很多加油打氣外, 在專業領域以及學術倫理上也給了我許多想法及概念,生活中也給予學生許多言 教及身教,在機會教育中,藉由不同人事物導正學生做人處事的道理及觀念,亦 師亦友的教育常讓學生備感溫馨及激勵,謝謝老師。 感謝研究所期間的實驗室夥伴,特別感謝帶我學習模擬程式的博仁學長,使 得我後來可以自行完成所有論文實作;幫助過我許多的和展學長、迪宣學姊;同 窗學習,互相幫助的英麟、則齊;以及學弟妹們:謝瑋、沐容、俊豪、曉青、信 吉。還要感謝系統實驗室一起奮鬥的其他夥伴:麒哥、禮璿、麒璋、柏誠、健勝、 婷安、智忠、瑤倫、效維、孟儒,借我好市多卡的昱渂以及代購衣服給大家穿的 建佑。另外還有,軟工、網路及資安實驗室,各位一起修課的夥伴:柏寰、紹源、 中正等人,族繁不及備載,謝謝你們平時的照顧。 感謝在辛苦的研究日子當中,陪伴我,給予我支持的小曦,最後還要感謝辛 苦栽培我到研究所的父母,感謝父母對我所付出的一切,沒有你們的支持將不會 有今天的成就,謹以本篇論文獻給我最愛的你們,一同分享我的喜悅。 沈柏均 謹誌 于 國立台中教育大學 資訊工程研究所 2013 年 7 月 29 號摘 要
雲端運算已經對人們發展及使用軟體的方式帶來了革命性的變化。依循著新型態的 軟體即服務模式及服務導向型架構所進行的軟體開發及部署可望為使用者帶來極大的 便利性。然而,在實現這些優點前,軟體開發商及服務提供者也必須面對一些新的技術 挑戰。本篇論文針對其中服務部署這項關鍵問題進行研究,並且提出了一個整合性的解 決方案來處理雲端平台上複合式軟體即服務應用的服務部署問題。我們所提出的方法同 時考慮了服務間溝通或資料傳遞所需時間以及不同服務間可能潛在的平行處理效益等 兩個主要因素。我們發展了兩種圖形化表示方法來處理這兩種關係,分別是服務相依關 聯圖以及服務並行關聯圖。接著,我們將兩種圖形整合成一張單一的服務關聯圖,藉此 將服務部署問題轉化為一個典型的最小 k 份切割問題來求解。我們藉由一系列建立在雲 端模擬平台上的實驗來評估我們所提出的方法,實驗結果顯示,我們所提出的方法在服 務回應時間上顯著地勝過以往之部署方法,能夠有效地提升複合式軟體即服務應用的整 體運行效能。 關鍵字:雲端運算,服務導向架構,複合式軟體即服務,服務部署Abstract
Cloud computing has caused a revolution in our way of developing and using software. Software development and deployment based on the new models of Software as a Service (SaaS) and Service-Oriented Architecture (SOA) are expected to bring a lot of benefits for users. However, software developers and service providers will have to address new challenging issues before such benefits can be realized. This thesis explores one of the critical issues, service deployment for composite SaaS applications, and proposes an integrated approach to the service deployment problem which takes not only communication costs but also the potential parallelism among services into consideration. In the approach, two types of graphs are developed to model the communication costs between services, Service Dependency Graph (SDG), and potential parallelism among services, Service Concurrence Graph (SCG), respectively. Then, these two graphs are integrated into a single Service Relationship Graph (SRG) and the service deployment problem is transformed into a minimum k-cut problem for solution. A series of experiments were conducted on the CloudSim platform to evaluate the proposed approach. The experimental results indicate that the proposed approach outperforms previous deployment methods significantly in terms of service response time.
Table of Contents
誌 謝 摘 要…...………I Abstract……….II Table of Contents………...III List of Figures………IV List of Tables……….………....……….VI Chapter 1. Introduction………..….……….1Chapter 2. Related Work...5
Chapter 3. Deployment Strategies for Multiple Composite Cloud Services……...….…8
3.1 System Model...10
3.2 An Approach Towards Minimizing Communication Costs……...……….….…11
3.3 Another Approach Towards Increasing Parallelism…...16
3.4 An Integrated Approach to Both Reduce Communication Cost and Increase Parallelism...…...20
Chapter 4. Simulation Environment………..…...26
4.1 CloudSim…...26
4.2 Our Simulation Environment…...……….…28
Chapter 5. Performance Evaluation…...……….…31
5.1 Experimental Setting…...31
5.2 Experimental Results for Single Composite SaaS…...35
5.3 Experimental Results for Multiple Online Composite SaaS…...….…36
List of Figures
Figure 3.1 Example DAG structure for composite SaaS applications………..……….….9
Figure 3.2 Binding tasks to services...…...9
Figure 3.3 System model for developing and running composite SaaS applications………...10
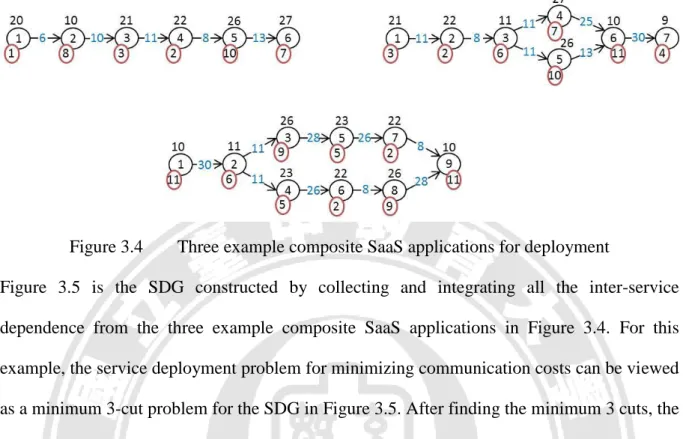
Figure 3.4 Three example composite SaaS applications for deployment….………..…….….13
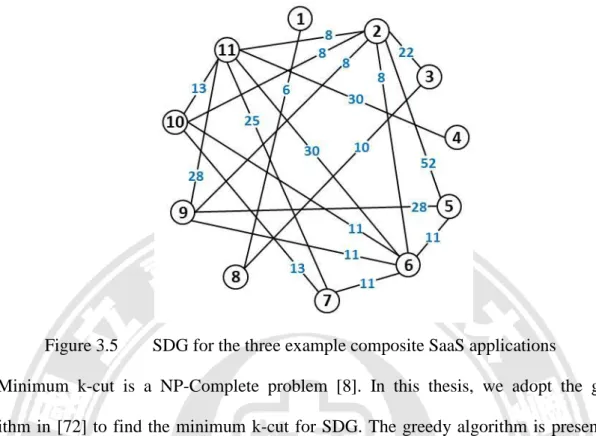
Figure 3.5 SDG for the three example composite SaaS applications……….….….14
Figure 3.6 The greedy minimum k-cut algorithm in [72]………....….15
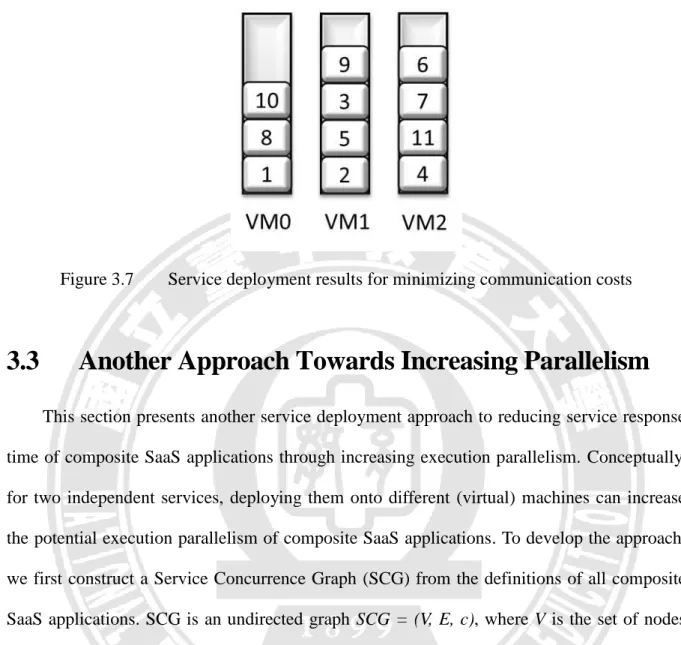
Figure 3.7 Service deployment results for minimizing communication costs……….….16
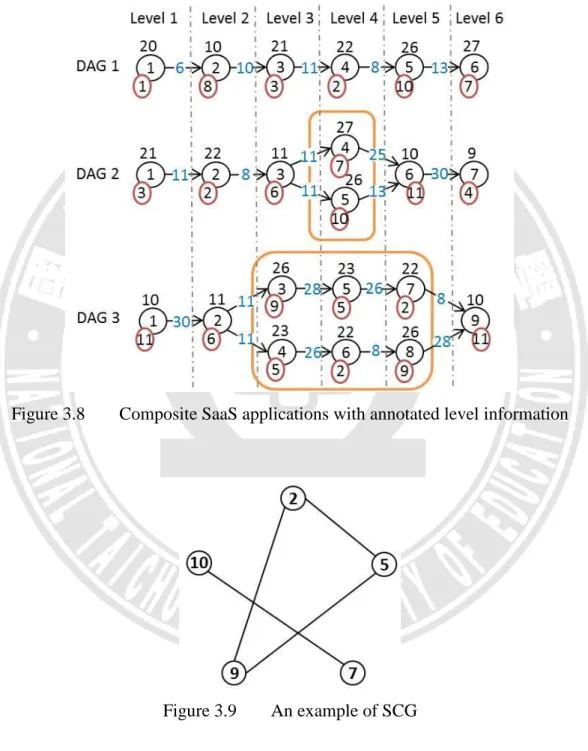
Figure 3.8 Composite SaaS applications with annotated level information……….19
Figure 3.9 An example of SCG……….………..….….19
Figure 3.10 Deployment result by graph coloring………....20
Figure 3.11 Weight calculation for the edges from SCG………...21
Figure 3.12 An example of merge of SDG and SCG………...……….22
Figure 3.13 An example of SRG………...………22
Figure 3.14 Service deployment results for integrated approach………23
Figure 3.15 Execution of 3 online requests based on Random service deployment…….……24
Figure 3.16 Execution of 3 online requests based on the service deployment for reducing communication cost………...24
Figure 3.17 Execution of 3 online requests based on the service deployment for both reducing communication cost and increasing parallelism………..…..25
Figure 4.1 Layered CloudSim architecture………...………27
Figure 4.2 System architecture in CloudSim………28
Figure 4.3 Layered architecture of our simulation environment…..………30
Figure 5.1 Ten composite SaaS applications in the experiments………..…34
Figure 5.3 Evaluation of different methods for determining parallelism………..…36 Figure 5.4 Performance results of online execution of 1000 service requests with
CCR=0.1………..……….38 Figure 5.5 Performance results of online execution of 1000 service requests with
CCR=1……….……….38 Figure 5.6 Performance results of online execution of 1000 service requests with
CCR=10………...……….39 Figure 5.7 Runtime of different approaches………...……….……….39
List of Tables
Table 3.1 Performance Comparison of the three service deployment results……….……..…25 Table 5.1 Number of requests for each composite SaaS application……….………..…….…37
Chapter 1. Introduction
Cloud computing [1] has become the most promising next-generation computing platform recently. Some cloud computing service providers have begun to provide commercial services, such as Amazon EC2 [10], Google App Engine [11] and Microsoft Azure [12]. Users only pay for the amount of computing resources they actually used. Nowadays, cloud services have been used widely in many application domains; for example, e-commerce, social networking, web game, and etc. [2] [3] [4] [5]. Cloud computing is usually divided into three layers of services [6]: Infrastructure as a Service (IaaS), Platform as a Service (PaaS), and Software as a Service (SaaS), where users can apply these services through web browsers and Internet. The concept of SaaS [7] has caused a revolution in our way of using software. One typical example is the SaaS CRM provided by Salesforce.com [13]. In addition, Service-Oriented Architecture (SOA) [7] provides an effective and flexible way to rapidly develop new SaaS applications based on existing services. Software development and deployment based on the new models of SaaS and SOA are expected to bring a lot of benefits for both software developers and users.
A SaaS provider might offer several SaaS applications at the same time. Based on the SOA development methodology, these SaaS applications are composed of a set of existing or newly developed services and different applications might share some common services. These services usually are distributed over a set of (virtual) machines based on some service deployment strategies, due to the resource limit of each single machine or some load sharing and QoS considerations. For SaaS providers who rent virtual machines from IaaS providers, the work of service deployment has to be done by themselves. On the other hand, if SaaS providers develop their applications on a PaaS platform, the PaaS provider has to take care of
service deployment for supporting all SaaS applications from different providers. Service deployment becomes a crucial issue since it affects the execution performance and other QoS aspects of SaaS applications greatly. This thesis studies the service deployment problem, where a set of SaaS applications, a collections of services, and a number of homogeneous (virtual) machines on a cloud platform are given and an appropriate service deployment arrangement, determining which service should be deployed on which resource, is desired for efficient execution of those SaaS applications on the cloud platform.
Several QoS aspects might be considered when conducting service deployment, such as reliability, cost, security, response time, etc. In this thesis, we focus on the response time of SaaS applications when dealing with the service deployment problem. A SaaS application developed based on the SOA methodology can usually be viewed as a directed graph in structure, which are similar to traditional parallel task graphs, or called workflows, in the literature. The nodes in the graph represent the services to invoke and the directed edges indicate the execution and data dependency. Weights can be annotated to nodes and edges, representing the corresponding estimated service execution time and data communication costs, respectively. In our work, we first identified two important factors which affect the execution performance of SaaS applications: communication costs and parallelism. Within a SaaS application, if two related services are deployed onto the same (virtual) machine, the communication costs between them can be minimized. On the other hand, for two independent services, deploying them onto different (virtual) machines can increase the potential parallelism and thus improve the execution performance. Therefore, we treat service deployment as a dual objective optimization problem for reducing communication costs and increasing parallelism simultaneously.
To solve the dual objective service deployment problem, we first developed two kinds of graphs to represent different types of relationships among services. The first one is called a Service Dependency Graph (SDG) describing the interdependence relationship among the set of services, which can be extracted from the set of SaaS applications given. Each service on the platform will have a corresponding node in SDG and each edge in SDG indicates a direct interdependence relationship between two services, which appears in at least one SaaS applications. The second one is Service Concurrence Graph (SCG) where an edge between two nodes indicates that there is no direct or indirect interdependence relationship between the two corresponding services in any SaaS applications on the platform. Therefore, two connected services in SCG can potentially run concurrently since there is no path between them in any SaaS applications.
Based on SDG, for the objective of reducing communication costs through deploying interrelated services onto the same (virtual) machine, the service deployment problem was transformed into the typical minimum k-cut problem [8] for SDG where k is the number of (virtual) machines to host the services. For the objective of increasing parallelism, conceptually the service deployment problem can be transformed into the graph coloring problem [9] for SCG where the number of colors represents the amount of available (virtual) machines.
To solve the complete dual-objective service deployment problem, we integrate SDG and SCG into a single graph, called Service Relationship Graph (SRG), and then solve the problem by transforming it into the minimum k-cut problem [8] for SRG. Since SDG and SCG share the same set of nodes, the services on the cloud platform, SRG can be easily constructed based on SDG by duplicating all the edges of SCG into SDG where the duplicated edges are given negative weights. Therefore, connected services with negative
weights on the edges would tend to be cut into different (virtual) machines for deployment, resulting in increasing parallelism. On the other hands, connected services with large positive weights on the edges, representing communication costs, would more likely be deployed onto the same (virtual) machine, keeping the overall communication costs minimal. The proposed approach thus solves the dual-objective service deployment problem effectively.
To evaluate the proposed approach, we conducted a series of simulation experiments based on CloudSim [14][15] for two types of scenarios representing single composite SaaS application and online multiple composite SaaS applications, respectively. Our approach was compared to several existing deployment methods, GA[16], MC-BT [17], and FFD (First Fit Decreasing) [18] in terms of average response time of service requests. The experimental results indicate that our approach significantly outperform existing methods, achieving up to 40.6% performance improvement.
The reminder of this thesis is organized as follows. Chapter 2 discusses related works on service deployment. We present our dual-objective service deployment strategies in chapter 3. Chapter 4 describes our simulation environment based on the CloudSim toolkit. Chapter 5 evaluates the proposed approach and compares it with existing methods. Chapter 6 concludes this thesis.
Chapter 2. Related Work
As cloud computing emerges, there have been many related research works on services computing and Software as a Service (SaaS) recently. How to provide SaaS services with high QoS (Quality of Service) becomes a critical issue. Several research topics are concerned with such issue, e.g. load balancing [19][20][21], resource management and allocation [22][23][24][25][26], request dispatching [27][28], resource provisioning and planning [29][30][31][32][33][34][35], service development models and environments [36][37][38], automatic deployment systems [39], fault tolerant issues [40]. This thesis explores the issues of service deployment for composite SaaS applications.
The service deployment problem shares some common interests with the virtual machine placement problem [41][42][43][44][45][46] which has received much research attention in recent years. The similarity lies in the need to minimize inter-VM or inter-service communication costs, although some virtual machine placement algorithms also deal with the energy saving issues. However, there is no execution dependency among virtual machines while composite SaaS applications usually contain execution dependency among constituent services. The characteristics of composite SaaS applications make service deployment for them an even more challenging problem than virtual machine placement.
For the service deployment approaches in the literature, some consider only the interaction between services while others also take into consideration the interaction between services and their data components [47][48]. For the optimization goal, some approaches focus on minimizing the service response time or communication costs [49], while some others try to deal with a dual objective optimization problem which considers both service response time and service costs [50][51][48]. Regarding the platform to deploy the services,
some approaches focus on private clouds [52], some treat hybrid clouds [51], and some others deal with mobile clouds or multiple clouds [53]. In most studies, different service workflows do not share underlying services [50][54][55] while in our work different composite SaaS applications usually share common services based on the SOA methodology. Some research works deal with the resource allocation problem for multi-tenant SaaS applications to meet the different non-functional requirements of different users, e.g. [23][56].
The work in [51] deals with the service placement problem in hybrid clouds. They proposed an algorithm that approximates the optimal placement based on communication and hosting costs induced by the deployment of components in the public cloud. In [55], Cucinotta et al. presented a heuristic algorithm for optimum allocation of real-time service workflows. The work in [52] proposed a ranking chaos algorithm to solve both of service composition optimal selection and optimal allocation of computing resources in one single step. On the other hand, our work deals with the cases that service deployment has to be performed according to the service selection results of the composite SaaS applications.
In [48], an algorithm was presented to take data dependencies between workflow steps into account and assigns them to cloud resources based on the two conflicting objectives of cost and execution time according to the preferences of the user. In [53], Lucas-Simarro et al. presents a modular broker architecture that can work with different scheduling strategies for optimal deployment of virtual services across multiple clouds with different providers, based on different optimization criteria.
In [50], a game theoretic method was proposed to optimize both the overall cost and quality of cloud services. In [54], an evolutionary approach with new specific operators was introduced. Some works, such as [57][58], focus on cost minimization. The proposed
approach is to determine the locations where service instances should be placed such that the hosting cost is minimized while key performance requirements (e.g. response time) are assured. In [49], graph partitioning algorithms were proposed to minimizing the required network bandwidth.
In [59], Gil-Costa et al. proposed a service deployment algorithm for improving the performance of vertical search engines. Although their work shares some common interests, communication cost reduction, with us, there are several differences between their and our works. For example, they dealt with service component replication and routing while we do not. On the other hand, they focused on deploying a single SaaS application, the vertical search engine, while our approach can handle multiple composite SaaS applications sharing some common services.
In [60][61][62][63][64][65], Izzah et al. describe the concept of composite SaaS and define the composite SaaS component placement problem, called SPP. They proposed penalty-based genetic algorithms and cooperative co-evolutionary algorithms for the SPP in the cloud. Our approach is based on graph algorithms and in general can run faster than their approaches. Moreover, we take parallelism into consideration while they only focused on communication costs.
Chapter 3. Deployment Strategies for
Multiple Composite Cloud Services
As cloud computing platform and related technologies mature, Software as a Service (SaaS) is becoming a widely accepted future trend for people to use software functionalities. Based on SOA [66] related technologies, enterprises and other SaaS providers are beginning to develop non-trivial cloud services of complex structure, which are sometimes called composite SaaS applications [60] since they are usually developed by putting together several existing services according to specific application logic. The execution relationship among the constituent services of a composite SaaS application can usually be expressed as a Directed Acyclic Graph (DAG) [69], sometimes called a workflow. There are languages and middleware, such as BPEL [67] and Xavantes [68], developed for programming such kinds of workflow applications. Figure 3.1 is an example of such DAG structure of composite SaaS applications. The entire workflow is designed according to specific application logic to provide a certain SaaS service on the cloud platform. Each node represents a task which has to be bound to an existing service running on a specific resource before the entire workflow can begin its execution, as shown in Figure 3.2. Since on the cloud platform there might be several functionally equivalent services ready for each task, a procedure called service selection [70] is usually conducted to find a most appropriate binding between a task and a service according to some QoS consideration. In Figure 3.1, the number inside each node is the ID of the task within the composite SaaS application. The number within the red circle is the ID of the service bound to the task. The number next to each node means the required execution time of the service bound to the task. The edges represent the dependence between tasks and the number next to an edge represents the inter-task data transmission time. Since
cloud platform is a distributed system, the services used by a composite SaaS applications may be located on different (virtual) machines. Apparently, different distributions of the services have impact on the execution performance of composite SaaS applications. Therefore, service deployment strategies become a crucial research problem. This chapter describes the service deployment problem and presents our approach to the problem for reducing the service response time of composite SaaS applications on the cloud platform.
Figure 3.1 Example DAG structure for composite SaaS applications
3.1
System Model
Cloud computing is usually divided into three layers services: IaaS, PaaS and SaaS. As shown in Figure 3.3, SaaS providers develop their composite SaaS applications on a PaaS platform, which provides not only convenient software development environments but also a set of useful services ready for use by the composite SaaS applications. These services have to be deployed onto a set of (virtual) machines hosted by IaaS providers before they can provide services. The entire cloud platform can be either type of cloud, such as public cloud, private cloud, hybrid cloud, and community cloud. Moreover, the three layers of services, IaaS, PaaS, and SaaS, might come from different providers.
To cope with both of the above two scenarios, this thesis studies an abstracted service deployment problem, where a set of SaaS applications, a collections of services, and a number of homogeneous (virtual) machines on a cloud platform are given and an appropriate service deployment arrangement, determining which service should be deployed on which resource, is desired for efficient execution of those SaaS applications on the cloud platform. Among various QoS aspects of SaaS services, we focus on the service response time of composite SaaS applications when dealing with the service deployment problem. To deal with the service deployment problem, we first identified two important factors which affect the execution performance of composite SaaS applications: communication costs and parallelism. Service deployment strategies developed based on optimizing these two factors will be described in the following sections.
3.2
An Approach Towards Minimizing Communication
Costs
Within a composite SaaS application, if two related services are deployed onto the same (virtual) machine, the communication costs between them can be minimized. To develop a service deployment approach to reducing inter-service communications costs as much as possible, we first construct a Service Dependency Graph (SDG) from the definitions of all composite SaaS applications, which describes the interdependence relationship among the set of constituent services. SDG is an undirected graph SDG = (V, E, c), where V is the set of nodes representing the collection of services used to develop the composite SaaS applications,
E is the set of undirected edges connecting the nodes which imply the inter-dependence
communication cost of each pair of connected services.
Each service on the platform will have a corresponding node in SDG and each edge in SDG indicates a direct interdependence relationship between two services, which appears in at least one SaaS applications. The weight on each edge is calculated by multiplying the communication cost of the two connected services by the number of occurrences of such inter-dependency in all composite SaaS applications. Therefore, the two interrelated services occurring in more composite SaaS applications tend to have a larger weight on the connecting edge in SDG and should be deployed on the same (virtual) machine as possible as we can for reducing more communication costs.
Based on SDG, the objective of reducing communication costs through deploying interrelated services onto the same (virtual) machine can be expressed as follows.
,
,
Then, the service deployment problem can be transformed into the typical minimum k-cut problem [8] for SDG where k is the number of (virtual) machines to host the services. To illustrate how the proposed approach works, Figure 3.4 shows three example composite SaaS applications, assuming that the eleven constituent services, as indicated in the red circles, are to be deployed onto three (virtual) machines for reducing the inter-service communication costs as much as possible.
Figure 3.4 Three example composite SaaS applications for deployment
Figure 3.5 is the SDG constructed by collecting and integrating all the inter-service dependence from the three example composite SaaS applications in Figure 3.4. For this example, the service deployment problem for minimizing communication costs can be viewed as a minimum 3-cut problem for the SDG in Figure 3.5. After finding the minimum 3 cuts, the SDG is partitioned into 3 connected components. The services within the same component are deployed on the same (virtual) machine. Assuming the inter-service communication cost is negligible once the two related services reside on the same machine, as the common assumption for workflow scheduling [71], inter-service communication costs now will occur only between services located on different (virtual) machines. Since those induced communication costs correspond to the set of cut edges, the above service deployment arrangement tends to minimize communication costs based on the result of minimum k cuts.
Figure 3.5 SDG for the three example composite SaaS applications
Minimum k-cut is a NP-Complete problem [8]. In this thesis, we adopt the greedy algorithm in [72] to find the minimum k-cut for SDG. The greedy algorithm is presented in Figure 3.6. The nodes of the input graph are to be divided into k subsets numbered . First, all nodes in the input graph are put into a set called remaining. Then a node is picked up randomly as a start. In the main while loop, each time a node resulting in the smallest Diff value on a specific subset is put into that subset. The definition of the Diff function is given as follows.
Given , is the number of edges incident on whose other endpoint is in the set , i.e. : Let be the set which node belongs to.
Once more than one node has the same smallest Diff value, the one with the maximum value will be selected. The while loop repeats until the destination subsets of all nodes have been determined.
The Greedy Algorithm
:
Figure 3.6 The greedy minimum k-cut algorithm in [72]
Figure 3.7 shows the service deployment arrangement for the example composite SaaS applications in Figure 3.4, which is determined by running the greedy minimum k-cut algorithm in Figure 3.6 on the SDG in Figure 3.5.
Figure 3.7 Service deployment results for minimizing communication costs
3.3
Another Approach Towards Increasing Parallelism
This section presents another service deployment approach to reducing service response time of composite SaaS applications through increasing execution parallelism. Conceptually, for two independent services, deploying them onto different (virtual) machines can increase the potential execution parallelism of composite SaaS applications. To develop the approach, we first construct a Service Concurrence Graph (SCG) from the definitions of all composite SaaS applications. SCG is an undirected graph SCG = (V, E, c), where V is the set of nodes representing the collection of services used to develop the composite SaaS applications, E is the set of undirected edges indicating that there is no direct or indirect interdependence relationship between the connected services in any SaaS applications, and c is the set of weights on each edge representing the potential performance improvement of running the connected services in parallel compared to running them serially.
To construct SCG, an intuitive approach is for each service, s, to find its maximal set of services that can run concurrent to s represented by cG(s) [73]. A service s’ is said to be concurrent to a service s, if there is no path between s and s’ in any composite SaaS
application. This means that there is no direct or indirect dependence between s’ and s, hence
s’ can potentially run concurrently with s. To find a service’s cG(s), Depth First Search (DFS)
is used to identify its dependent tasks. For each composite SaaS application containing that service s, first, a DFS from service s on the composite SaaS application is used to compute a list of services that depend on s. Next, a DFS on the transpose of the Directed Acyclic Graph (DAG) representing the composite SaaS application, DAGT, (obtained by reversing the direction of the edges on the DAG) computes the services which s is dependent on. The remaining tasks in each composite SaaS application totally constitute the maximal set of concurrent services in all composite SaaS applications for service s: cG(s) = V − (DFS(DAGs,
s) + DFS(DAGTs , s)) where V is the set of all services on the platforms and DAGs are the set
of all composite SaaS applications. After finding each service’s cG(s), SCG can be easily constructed by putting all services as nodes in the graph first and then creating an edge between a service, s, and each member service in its cG(s).
Based on SCG, for the objective of increasing parallelism, conceptually the service deployment problem can be transformed into the graph coloring problem [9] for SCG where the number of colors represents the amount of available (virtual) machines. Since connected services will now tend to be painted in different colors, representing that they are deployed onto different (virtual) machines, they have a more chance to run in parallel, resulting in shortened service response time of an entire composite SaaS application.
However, the above SCG constructed based on cG(s) might take unlikely parallelism into consideration. For example, two services used in different composite SaaS applications will have an edge between them. However, deploying these two services onto different (virtual) machines would not increase any execution parallelism for each composite SaaS application. Another example is the composite SaaS application in Figure 3.1, where services
12 and 14, bound to tasks 3 and 12, will have an edge between them in the above SCG since they are independent to each other. However, such independence might not lead to any actual parallelism since the two services are at the different levels of the DAG and hence have very little chance to run in parallel.
To overcome the drawback of the above SCG construction, we propose four possible methods to determine which pair of services should have an edge between them in SCG. The first one is a level-based method where two services will have an edge between them in SCG only if they are at the same level of a branch structure in a composite SaaS application, e.g. services 9 and 5, services 5 and 2, and services 2 and 9. The second method is called best-case
EST-EFT, where the Earliest Start Time (EST) and Earliest Finish Time (EFT) [71] of each
task in a composite SaaS application is calculated first considering all computation and ignoring all communication costs and then only the pairs of independent services with overlapped EST-EFT period will be given an edge in SCG. The third method is called
worst-case EST-EFT, where the Earliest Start Time (EST) and Earliest Finish Time (EFT) of
each task in a composite SaaS application is calculated by considering all computation and communication costs and then only the pairs of independent services with overlapped EST-EFT period will be given an edge in SCG. The fourth method is called best-case EST and
worst-case EFT, where the EST of each task is calculated by ignoring all communication
costs and the EFT is computed by considering all communication costs. Again, only the pairs of independent services with overlapped EST-EFT period will have an edge between them in SCG. The effectiveness of the above four methods will be evaluated in Chapter 5.
Figure 3.8 shows the same three composite SaaS applications in Figure 3.4, however, annotated with the level information. Figure 3.9 is an example SCG constructed for the composite SaaS applications in Figure 3.8 by the level-based method and Figure 3.10 is the
result of deploying the services onto three (virtual) machines by the graph coloring approach. Services having the potential to run in parallel are deployed onto different (virtual) machines.
Figure 3.8 Composite SaaS applications with annotated level information
Figure 3.10 Deployment result by graph coloring
3.4
An Integrated Approach to Both Reduce
Communication Costs and Increase Parallelism
Based on the results in previous sections, this section treats service deployment as a dual objective optimization problem for reducing communication costs and increasing parallelism simultaneously. To solve the dual-objective service deployment problem, we integrate SDG and SCG into a single graph, called Service Relationship Graph (SRG), and then solve the problem by transforming it into the minimum k-cut problem [8] for SRG. Since SDG and SCG share the same set of nodes, the services on the cloud platform, SRG can be easily constructed based on SDG by duplicating all the edges of SCG into SDG. The weights of the edges duplicated from SCG contain negative values indicating the potential performance improvement of running two services in parallel compared to running them in serial. Figure 3.11 is an example of such performance improvement based on that tasks 7 and 8 of the third composite SaaS application in Figure 3.4 have potential to run in parallel, resulting in performance improvement of 22 time units.
The merge of SDG and SCG will result in a graph like Figure 3.12 where each pair of services, e.g. services 5 and 16, might have two edges between them, coming from SDG and
SCG, respectively. After merging all edges between each pair of services through summing up all the weights, the final SRG can be constructed as shown in Figure 3.13. In SRG, connected services with negative weights on the edges would tend to be cut into different (virtual) machines for deployment, resulting in increasing parallelism. On the other hands, connected services with large positive weights on the edges, representing communication costs, would more likely be deployed onto the same (virtual) machine, keeping the overall communication costs minimal. The proposed approach thus solves the dual-objective service deployment problem effectively. Figure 3.14 shows the service deployment arrangement for the example composite SaaS applications in Figure 3.4, which is determined by running the greedy minimum k-cut algorithm in Figure 3.6 on the SRG in Figure 3.13
Figure 3.12 An example of merge of SDG and SCG
Figure 3.14 Service deployment results for integrated approach
In the following, we present three examples for illustrating the execution of three online requests based on three different service deployment results, respectively. Figure 3.15 is the case for random deployment. Figure 3.16 shows the results based on service deployment aiming to reduce communication costs only. Figure 3.17 illustrates an example for service deployment considering both reducing communication costs and increasing parallelism. Table 3.1 shows the comparison of the three different service deployment strategies in terms of average response time of the three online requests. It is clear that considering both communication costs and parallelism can achieve the best performance.
Figure 3.15 Execution of 3 online requests based on Random service deployment
communication cost
Figure 3.17 Execution of 3 online requests based on the service deployment for both reducing communication cost and increasing parallelism
Table 3.1 Performance Comparison of the three service deployment results Random Reduced
communication only
Reduced communication and increased parallelism Average Response Time 240 205 201.7
Chapter 4. Simulation Environment
This chapter presents the simulation environment we developed for conducting the performance evaluation experiments which will be presented in chapter 5. Section 4.1 is an introduction to the toolkit, CloudSim [14][15], which our simulation environment is based on. Section 4.2 presents the extended functions we developed for CloudSim to conduct our simulation experiments.
4.1
CloudSim
Our simulation environment was developed based on the CloudSim toolkit [14][15], which is a simulation system built by the Cloud Computing and Distributed Systems (CLOUDS) Laboratory of University of Melbourne. CloudSim provides a platform for the providers and researchers of cloud services to conduct simulation experiment. Figure 4.1 shows the multi-layered design of the CloudSim software framework and its architectural components, which was built based on the GridSim toolkit and SimJava framework [15]. It offers basic components, such as host, datacenter, VM, service brokers, application allocation policies, for simulating large-scale cloud computing environments.
Figure 4.1 Layered CloudSim architecture.
Figure 4.2 shows the system architecture of CloudSim in which user requests are called cloudlets. The request execution time has to be set up when creating a cloudlet. A resource for executing cloudlets is called a VM residing in a host. A host may contain several PE’s (processing elements). A set of hosts are put together to form a datacenter. Before a simulation starts, both cloudlets and VM’s should be created and configured properly. It is the module called broker in the figure that dynamically assigns cloudlets to specific VMs for execution according to a predefined resource allocation policy. Besides, the broker has to
configure service components on VMs properly according to the service deployment strategies discussed in chapter 3 before simulation.
Resource Datacenter HOST PE PE PE HOST PE PE PE HOST PE PE PE HOST PE PE PE HOST PE PE PE HOST PE PE PE HOST PE PE PE HOST PE PE PE HOST PE PE PE VM 2 VM 3 VM 4 VM n VM 1 Request
Cloudlet 1 Cloudlet 2 Cloudlet 3 Cloudlet n
Broker
Dispatcher 1 Dispatcher 2 Dispatcher n
Figure 4.2 System architecture in CloudSim
4.2
Our Simulation Environment
The designer of CloudSim advises that users should design their own resource allocation policies fitting their research purposes before doing simulations. Therefore, we modified and extended some modules in CloudSim for our simulation experiments. One major extension is to support the execution of composite SaaS applications where the execution dependency between services has to be maintained. Cloudlets representing the execution of services have to be created dynamically during runtime according to the definitions of composite SaaS
Switcher 2 Switcher 1 Switcher 1 Switcher 1 Switcher n Switcher 1
applications. For this extension, we modified the kernel of CloudSim and developed a new Dag_generator class to generate the input workload of composite SaaS applications.
Figure 4.3 shows the layered architecture of our simulation environment. The rectangle with green background represents the class that we designed for the simulation environment, while the rectangles with red background indicate that the classes were derived from the original components in CloudSim. In the main class, we can define workflows, requests (cloudlets), switchers, resources (VMs) and deployment plans. Before a simulation starts, the main class will uses Dag_generator to generate a set of composite SaaS applications as input workload, create resource switchers, uses Deployment_Strategy to conduct the service deployment plan, and manage available VMs in Resource_switcher.
Each SaaS request in the simulation represents an invocation of a particular composite SaaS application. As the simulated system receives such a request, a cloudlet will be created and submitted to DatacenterBroker for executing the deployed service of the first task in the corresponding composite SaaS application. Then, DatacenterBroker will send cloudlets to Datacenter for allocating them onto a particular VM with the help of Resource_switcher. The responsibility of Resource_switcher is to maintain the service deployment results, indicating which service is deployed on which VM. When a cloudlet finishes its execution, the execution thread will return to the DatacenterBroker class. With our extended functions in DatacenterBroker, the finish of a cloudlet will result in the dynamic creation of another cloudlet according to the definition of the executed composite SaaS application unless the finished cloudlet represents the last task in the application. The deployment strategies are implemented in the Deployment_strategy class. We also modified the DatecenterBroker class to simulate the online behavior of incoming requests which arrive at different time instants according to a controllable exponential distribution.
Chapter 5. Performance Evaluation
This chapter presents a series of simulation experiments used to evaluate the proposed service deployment strategies. Two scenarios were considered in conducting the performance evaluation. In the first scenario, only one single composite SaaS application will be executed at a time. On the other hand, the second scenario is concerned with online execution of multiple composite SaaS applications where different applications might come at different time instants and their execution period might overlap with each other.
5.1
Experimental Setting
In the following experiments, we assume that a SaaS provider rents 5 virtual machines for deploying 20 services to support 10 different composite SaaS applications simultaneously. Each service will be deployed on only one virtual machine and the 20 services will be distributed over the 5 virtual machines as evenly as possible. The resources of each virtual machine, e.g. memory, disk, are assumed to be enough for all the services deployed on it. In this study, the critical resource we are concerned about is the processor. Each virtual machine is assumed to have only one processor core shared by all the services deployed on it. The processor core can only process one service at a time. Different service requests will be processed in a First-Come-First-Serve (FCFS) manner. No time sharing is allowed among different service requests.
Figure 5.1 shows the structures of the ten composite SaaS applications used in the following experiments. The proposed service deployment strategies were evaluated in terms of average response time of an entire composite SaaS application. In the scenario of one
single application, each composite SaaS application was executed for once and the average response time of all the ten applications was used to compare different service deployment strategies. In the scenario of online applications, totally 1000 service requests will arrive at the SaaS platform, each invoking one of the ten different composite SaaS applications randomly. The average response time of the 1000 requests will be used to evaluate different service deployment strategies. Five approaches proposed in chapter 3 are evaluated in the following experiments, where SD-RC represents the service deployment strategy for reducing communication costs and SD-RCIP-I, SD-RCIP-II, SD-RCIP-III, SD-RCIP-IV are the service deployment strategies for reducing communication costs and increasing parallelism simultaneously with four different parallelism determination mechanisms, respectively.
We also developed four other methods for comparison, including Random, First Fit Decreasing (FFD), Genetic Algorithm (GA), and MC-BT [17]. The Random approach simply deploys the services onto the virtual machines in random without any specific optimization goal. FFD is a heuristic strategy for the bin packing problem, which operates by first sorting the items to be inserted in decreasing order by their sizes, and then inserting each item into the first bin in the list with sufficient remaining space [18]. In our implementation, the items are the services to be deployed and the bins are the virtual machines. The size of a service is its required execution time. The size of each bin is set to the sum of all services’ execution time divided by the number of virtual machines. For the last few services being deployed, there might be no virtual machines with enough remaining space to accommodate them. In that case, these services will be deployed onto the virtual machines with the least amount of required execution time of the deployed services. Service deployment based on FFD has the potential to achieve good load balancing effects. Some previous works, such as [60], have tried to adopt genetic algorithms for deploying services in order to minimize the required
execution time of an entire composite SaaS application. Therefore, we implemented a service deployment strategy based on genetic algorithms for comparison, indicated as GA in the following experiments. MC-BT is a method proposed in [17] for the problem of virtual machine placement, which aims to minimize the communication costs between physical machines through a combination of the minimum cut approach and binary tree representation. In [17], it is not clear how the minimum cut is performed. In our experiments, we implemented the MC-BT approach with the maximum adjacency search [74] for finding the minimum cut. In our implementation, both GA and MC-BT were modified to allow a bound to be put on each virtual machine, which defines the maximum number of services allowed to be deployed on each virtual machine. The bound is defined as follows, where is the number of services and is the number of virtual machines.
,
,
5.2
Experimental Results for Single Composite SaaS
This section presents the performance results of executing a single composite SaaS application at a time based on the service deployment results of different approaches. Since most of the previous methods focus on communication cost reduction without considering the parallelism issue. We first evaluate the effectiveness of our approach, SD-RC, for communication cost reduction in Figure 5.2. It is not surprising that the Random approach delivers the worst performance. The experimental results indicate that our approach, SD-RC, outperforms the other methods significantly.
Figure 5.2 Evaluation of the effects of reducing communication costs
The following experiments evaluate the effectiveness of taking parallelism into consideration when deploying services onto virtual machines. In chapter 3, we propose four possible methods to determine the potential parallelism to use in service deployment.
Figure 5.3 compares these four methods and SD-RC. The experimental results show that all the four approaches considering both communication costs and parallelism achieve better performance than SD-RC. Among the four approaches, SD-RCIP-II with the best-case
EST-EFT method delivers the best performance. Moreover, the experimental results also
confirm that taking parallelism into consideration is effective for designing service deployment strategies since the all the four SD-RCIP approaches outperform SD-RC which considers only communication cost reduction.
Figure 5.3 Evaluation of different methods for determining parallelism
5.3
Experimental Results for Multiple Online Composite
SaaS
This section presents the performance results of online execution of 1000 service requests which arrive might arrive at different time instants and request different composite SaaS applications. The inter-arrival time between two consecutive requests is assumed to conform to an exponential distribution. Table 5.1 summarizes actually how many requests
each composite SaaS application receives in the following experiments.
Figures 5.4 to 5.6 compare our approaches with the four other methods, Random, FFD, GA, MC-BT, assuming three different Communication-to-Computation (CCR) ratios [71] of the composite SaaS applications, 0.1, 1, 10, respectively. The experimental results show that taking both reducing communication costs and increasing parallelism into consideration can lead to better service deployment results. In general, our approach, SD-RCIP, outperforms the other methods under all the three CCR values. However, the relative performance of different parallelism determination methods in SD-RCIP varies with different CCR values. When CCR equals 0.1, as shown in Figure 5.4, SD-RCIP-I delivers the best performance. While in the other two cases, Figures 5.5 and 5.6, SD-RCIP-IV outperforms other approaches. Therefore, parallelism determination becomes a crucial issue for better service selection which is greatly affected by the properties of the composite SaaS applications.
Table 5.1 Number of requests for each composite SaaS application
Composite SaaS 1 2 3 4 5 6 7 8 9 10
Figure 5.4 Performance results of online execution of 1000 service requests with CCR=0.1
Figure 5.6 Performance results of online execution of 1000 service requests with CCR=10 Figure 5.7 compares the required runtime of each service selection approach for producing the service selection results. In general, our five approaches run faster than the GA approach but require longer runtime than the other three methods. However, comparing to the performance gain shown in previous figures, the required runtime of the proposed approaches has been paid back.
Chapter 6. Conclusions and Future Work
This thesis explores the issue of service deployment for SaaS providers or PaaS providers who need to host multiple composite SaaS applications which might share some common services based on the SOA methodology. The service deployment problem considered in this thesis is to determine which services should be deployed onto which virtual machines given a set of services, a collection of composite SaaS applications, and a particular number of virtual machines. The goal of service deployment is to minimize the response time of composite SaaS applications.
Most previous researches on service deployment and resource allocation focus on minimizing the inter-service communication costs. In this thesis, we propose an integrated approach to the service deployment problem which takes not only communication costs but also the potential parallelism among services into consideration. We developed two types of graphs to model the communication costs between services, Service Dependency Graph (SDG), and potential parallelism among services, Service Concurrence Graph (SCG), respectively. These two graphs are then integrated into a single Service Relationship Graph (SRG) and the service deployment problem is transformed into a minimum k-cut problem for solution. We conducted a series of simulation experiments to evaluate the proposed approach and compare it with several previous methods, FFD, GA, MC-BT. The experimental results show that our approach can achieve the shortest service response time for composite SaaS applications in both single application execution and execution of multiple online requests, leading to 40.6% performance improvement, compared to Random when CCR=1, in terms of average service response time.
As cloud computing emerges, software development and deployment based on the new models of SaaS and SOA are expected to bring a lot of benefits for both software developers
and users. Before the benefits can be realize, software service providers have to confront several technical challenges. Service deployment is one of the most critical issues for improving the QoS of composite SaaS applications. Our work in this thesis can contribute to the research and development on service deployment for the ever increasing composite SaaS applications.
Based on our work in this thesis, there are some promising future research directions requiring further investigation. The first is to take into consideration the issue of load balancing, balancing the totally required computation time of all deployed services on each (virtual) machine, when designing the service deployment algorithms. This is especially important for serving online requests. The second direction is about dynamic redeployment due to the time-varying workload commonly seen in real cloud environments. Finally, in this thesis, each service will be deployed on only one (virtual) machine. Another important research issue is to deal with the dynamic resource provisioning problem where each service can be deployed on more than one (virtual) machines to serve heavy workload. Determining the most appropriate amount of (virtual) machines to deploy each service according to the workload requirement is a crucial part for both maintaining acceptable QoS performance and minimizing the amount of resources used in order to reduce costs.
References
[1] R. Buyya, C. S. Yeo and S. Venugopal, “Market-oriented cloud computing: vision, hype, and reality for delivering IT services as computing utilities,” IEEE International
Conference, 2008.
[2] P. Hofmann and D. Woods, “Cloud computing: The limits of public clouds for business applications,” Internet Computing, IEEE, vol. 14, pp. 90-93, 2010.
[3] W. Yi , M. B. Blake, “Service-oriented computing and Cloud computing: challenges and opportunities,” Internet Computing, IEEE, vol. 14, pp. 72-75, 2010.
[4] T. Phan, W.-S. Li, B. Furht, A. Escalante, “Vertical load distribution for cloud computing via multiple implementation options handbook of cloud computing,” Springer US, pp. 277-308, 2010.
[5] A. Khalid, “Cloud computing: applying issues in small business,” in Signal Acquisition
and Processing, International Conference on ICSAP '10, pp. 278-281, 2010.
[6] J. N. Hoover and R. Martin, “Demystifying the cloud,” InformationWeek Research &
Reports, pp. 30-37, 2008.
[7] J. Junjie and, Z. Jian, “Research on open SaaS software architecture based on SOA,”
Proceedings of International Symposium on Computational Intelligence and Design (ISCID), pp. 144-147, 2010.
[8] The minimum k-cut problem in graph theory. Available: (2014.7) http://en.wikipedia.org/wiki/Minimum_k-cut
[9] The graph coloring problem in graph theory. Available: (2014.7) http://en.wikipedia.org/wiki/Graph_coloring
[10] Amazon Elastic Compute Cloud (Amazon EC2). Available: (2014.7) http://aws.amazon.com/ec2/
[11] Google. Google App Engine. Available: (2014.7) http://code.google.com/intl/en/appengine
[12] Microsoft Azure Platform. Available: (2014.7) http://www.windowsazure.com
[13] salesforce.com. salesforce. Available: (2014.7) http://www.salesforce.com/
[14] The Cloud Computing and Distributed Systems (CLOUDS) Laboratory, University of Melbourne, CloudSim: A framework for modeling and simulation of Cloud computing infrastructures and Services. Available: http://www.cloudbus.org/cloudsim/ (2014.7) [15] R. N. Calheiros, R. Ranjan, A. Beloglazov, C. A. F. De Rose, and R. Buyya, “CloudSim:
a toolkit for modeling and simulation of cloud computing environments and evaluation of resource provisioning algorithms,” Software: Practice and Experience, vol. 41, pp. 23-50, 2011.
[16] M. Mitchell, “An introduction to genetic algorithms,” A Bradford Book The MIT Press, fifth printing, 1999.
[17] J. Dong, X. Jin, H. Wang, Y. Li, P. Zhang and S. Cheng, “Energy-saving virtual machine placement in Cloud data centers,” 13th IEEE/ACM International Symposium on Cluster,
Cloud, and Grid Computing, 2013.
[18] Fist Fit Decresing (FFD). Available: (2014.7) http://en.wikipedia.org/wiki/Bin_packing_problem
[19] A. M. Nakai, E. Madeira, and L. E. Buzato, “Load balancing for internet distributed services using limited redirection rates,” 5th Latin-American in Dependable Computing
Symposium (LADC), pp. 156-165, 2011.
time distributions,” ACM SIGMETRICS international conference on Measurement and
modeling of computer systems (SIGMETRICS), vol. 38, pp. 275-286, 2010.
[21] C. Graham, “Chaoticity on path space for a queueing network with selection of the shortest queue among several,” Journal of Applied Probability, vol. 37, pp. 192-211, 2000.
[22] E. Oppong, S. Khaddaj, H. E. Elariss, “Cloud computing: resource management and service allocation,” 12th International Symposium on Distributed Computing and
Applications to Business, Engineering & Science, 2013.
[23] H. Yu and D. Wang, “System resource allocation algorithm for multi-tenant SaaS application,” International Conference on Cloud and Service Computing, 2011.
[24] M. Gusev, S. Ristov, G. Velkoski, M. Simjanoska, “Optimal resource allocation to host web services in Cloud,” IEEE Sixth International Conference on Cloud Computing, 2013.
[25] L. Ai, M. Tang and C. Fidge, “Resource allocation and scheduling of multiple composite web services in cloud computing using cooperative coevolution,” 18th international
conference on Neural Information Processing (ICONIP), 2011.
[26] B. Y. Wu, C. H. Chi, Z. Chen, M. Gu, J. Sun, “Workflow-based resource allocation to optimize overall performance of composite services,” Future Generation Computer
Systems, Volume 25, Issue 3, pp. 199-212, 2009.
[27] S. Ranjan, E. Knightly, “High-performance resource allocation and request redirection algorithms for web clusters,” IEEE Transactions on Parallel And Distributed Systems, Vol. 19, No. 9, 2008.
[28] S. Ranjan, R. Karrer, E. Knightly, “Wide area redirection of dynamic content by internet data centers,” Twenty-third AnnualJoint Conference of the IEEE Computer and
Communications Societies (INFOCOM), Vol. 2, 2004.
[29] R. Doyle, J. Chase, O. Asad, W. Jin, and A. Vahdat, “Model-based resource provisioning in a web service utility,” 4th conference on USENIX Symposium on Internet Technologies
and Systems (USITS), Vol. 4, 2003.
[30] P. Shivam, S. Babu, and J. Chase, “Learning application models for utility resource planning,” IEEE International Conference on Autonomic Computing (ICAC), pp. 255-264, 2006.
[31] P. Padala, K. G. Shin, X. Zhu, M. Uysal, Z. Wang, S. Singhal, A. Merchant, K. Salem, “Adaptive control of virtualized resources in utility computing environments,” 2nd ACM
SIGOPS/EuroSys European Conference on Computer Systems (Eurosys), 2007.
[32] J. Rao, X. Bu, C. Z. Xu, L. Wang, G. Yin, “VCONF: A reinforcement learning approach to virtual machines auto-configuration,” 6th International conference on Autonomic
computing (ICAC), pp. 137-146, 2009.
[33] S. Ranjan, J. Rolia, Fu, H., Knightly, R, “QoS-driven server migration for internet data centers,” 10th International Workshop on Quality of Service, 2002.
[34] H. Z. Zhou, K. C. Huang, and F. J. Wang, “Dynamic resource provisioning for interactive workflow applications on Cloud computing platform,” Lecture Notes in Computer
Science, Vol. 6083, pp. 115-125, 2011.
[35] C. H. Tsai, K. C. Huang, F. J. Wang, and C. H. Chen, “A distributed server architecture supporting dynamic resource provisioning for BPM-oriented workflow management systems,” Journal of Systems and Software,Vol. 83, Issue 8, pp. 1538-1552, 2010.
[36] E. Tejedor, J. Ejarque, F. Lordan, R. Rafanell, J. Alvarez, D. Lezzi, R. Sirvent and R. M. Badia, “A Cloud-unaware programming model for easy development of composite services,” Third IEEE International Conference on Coud Computing Technology and
Science, 2011.
[37] R. Wang, Y. Zhang, S. Liu, L. Wu, X. Meng, “A dependency-aware hierarchical service model for SaaS and Cloud services,” IEEE International Conference on Services
Computing, 2011.
[38] F. Casati, S. Ilnicki, L.-J. Jin, V. Krishnamoorthy, M.-C. Shan, “eFlow: a platform for developing and managing composite e-Services,” Academia/Industry Working
Conference on Research Challenges, 2000.
[39] S. v. d. Burg and E. Dolstra, “A self-adaptive deployment framework for service-oriented systems,” 6th International Symposium on Software Engineering for Adaptive and
Self-Managing Systems, 2011.
[40] N. Laranjeiro and M. Vieira, “Deploying fault tolerant web service compositions,”
International Journal on Computer Systems Science & Engineering, pp. 23-34, 2008.
[41] N. Bobroff, A. Kochut and K. Beaty, “Dynamic placement of virtual machines for managing SLA violations,” 10th IFIP/IEEE International Symposium in Integrated
Network Management, pp. 119-128, 2007.
[42] M. Wang, X. Meng and L. Zhang, “Consolidating virtual machines with dynamic bandwidth demand in data centers,” in INFOCOM, Proceedings IEEE, pp. 71-75, 2011. [43] X. Meng, V. Pappas and L. Zhang, “Improving the scalability of data center networks
with traffic-aware virtual machine placement,” IEEE INFOCOM, pp. 1-9, 2010.
[44] V. Mann, A. Kumar, P. Dutta, and S. Kalyanaraman, “VMFlow: leveraging VM mobility to reduce network power costs in data centers,” NETWORKING, pp. 198-211, 2011. [45] O. Biran, A. Corradi, M. Fanelli, L. Foschini, A. Nus, D. Raz, and E. Silvera, “A stable
network-aware VM placement for Cloud systems,” 12th IEEE/ACM International
[46] B. Zhang, Z. Qian, W. Huang, X. Li and S. Lu, “Minimizing communication traffic in data centers with power-aware VM placement,” 6th International Conference on
Innovative Mobile and Internet Services in Ubiquitous Computing, 2012.
[47] S. Shahand, S. J. Turner, W. Cai, M. Khademi, “DynaSched: a dynamic web service scheduling and deployment framework for data-intensive Grid workflows,” International
Conference on Computational Science, ICCS, p.p. 593-602, 2010.
[48] E. Juhnke, T. Dornemann, D. Bock, B. Freisleben, “Multi-objective scheduling of BPEL workflows in geographically distributed Clouds,” IEEE 4th International Conference on
Cloud Computing, 2011.
[49] T. Verbelen, T. Stevens, F. D. Turck, B. Dhoedt, “Graph partitioning algorithms for optimizing software deployment in mobile cloud computing,” Future Generation
Computer Systems 29, p.p.451-459, 2013.
[50] Z. Mao, J. Yang, Y. Shang, C. C. Liu and J. Chen, “A game theory of cloud service deployment,” IEEE 9th World Congress on Services, 2013.
[51] F. B. Charrada, N. Tebourski, S. Tata, S. Moalla, “Approximate placement of service-based applications in hybrid clouds,” IEEE 21st International Workshop on
Enabling Technologies: Infrastructure for Collaborative Enterprises (WETICE), 2012.
[52] Y. Laili, F. Tao, L. Zhang, Y. Cheng, Y. Luo and B. R. Sarker, “A ranking chaos algorithm for dual scheduling of cloud service and computing resource in private cloud,”
Journal Computers in Industry, Volume 64, Issue 4, pp. 448-463, 2013.
[53] L. L.-S. Jose, M.-V. Rafael, S. M. Ruben, M. L. Ignacio, “Scheduling strategies for optimal service deployment across multiple clouds,” Future Generation Computer
Systems, Vol. 29, Issue 6, pp. 1431-1441, 2013.


![Figure 3.6 The greedy minimum k-cut algorithm in [72]](https://thumb-ap.123doks.com/thumbv2/9libinfo/7441980.109209/23.892.154.740.309.893/figure-greedy-minimum-k-cut-algorithm.webp)