行政院國家科學委員會補助專題研究計畫
□ 成 果 報 告
■期中進度報告
冷媒流量和熱通量振盪引起之暫態新冷媒和 FC-72
流動沸騰研究(一)
計畫類別:■ 個別型計畫 □ 整合型計畫
計畫編號:NSC 96-2221-E-009-133-MY3
執行期間:民國 96 年 08 月 01 日 起至民國 97 年 07 月 31 日
計畫主持人:林清發 教授
共同主持人:
計畫參與人員:陳建安 楊政陞
成果報告類型(依經費核定清單規定繳交):■精簡報告 □完整報告
本成果報告包括以下應繳交之附件:
□赴國外出差或研習心得報告一份
□赴大陸地區出差或研習心得報告一份
□出席國際學術會議心得報告及發表之論文各一份
□國際合作研究計畫國外研究報告書一份
處理方式:除產學合作研究計畫、提升產業技術及人才培育研究計畫、
列管計畫及下列情形者外,得立即公開查詢
□涉及專利或其他智慧財產權,□一年□二年後可公開查詢
ABSTRACT
This study intends to explore how a time periodic coolant flow rate affects the
transient forced convective boiling heat transfer and associated bubble characteristics
of FC-72 over a small heated circular copper plate flush mounted on the bottom of a
horizontal rectangular channel with a cross section of 20 mm in width and 5 mm in
height. The diameter of the copper plate is 10 mm. More specifically, the effects of
the coolant flow rate oscillation in the form of nearly triangular wave on the transient
flow boiling will be examined in detail. In the experiment the time-average coolant
mass flux G is varied from 300 to 400 kg/m2s and the amplitude of the coolant mass
flux oscillation is fixed at 0%, 5% and 10% of G . The period of the coolant mass
flux oscillation varies from 10s to 30s. Besides, the liquid subcooling at the inlet of
the channel ranges from 0°C to 10°C and the heat flux imposed on the heated plate
varies from 0.1 to 10 W/cm2.
The experimental results show that the time-average data of the FC-72 transient
saturated and subcooled flow boiling heat transfer characteristics are not affected to a
significant degree by the amplitude and period of the coolant mass flux oscillation. In
fact, they resemble these for the stable flow boiling. However, in the transient
saturated and subccoled flow boiling of FC-72 significant temporal oscillations in the
boiling heat transfer coefficient, bubble departure diameter and frequency, and active
nucleation site density appear for the imposed heat flux slightly higher than that for
ONB. They oscillate at the same frequency as the mass flux oscillation. Besides, at a
higher imposed heat flux and for a larger amplitude of the mass flux oscillation
stronger oscillations in h2φ, dp, f and Nac are noted. But they are only slightly affected
by the period of the mass flux oscillation. Furthermore, in the time duration in which
nucleation site density decrease, but the bubble departure frequency increases. The
opposite processes occur for a sink of mass flux with time. We also note that an
increases in the inlet liquid subcooling causes stronger oscillations in the boiling heat
iii
TABLE OF CONTENTS
ABSTRACT i
TABLE OF CONTENTS iii
LIST OF TABLE iv
LIST OF FIGURE v
CHAPTER 1 INTRODUCTION 1
1.1 Motive of the Present Study 1
1.2 Literature Review 2
1.2.1 Stable Single-Phase and Convective Boiling Heat Transfer 2
1.2.2 Unstable Convective Boiling Heat Transfer 4
1.2.3 Bubble Characteristics 6
1.3 Objective of This Study 7
CHAPTER 2 EXPERIMENTAL APPARATUS AND PROCEDURES 11
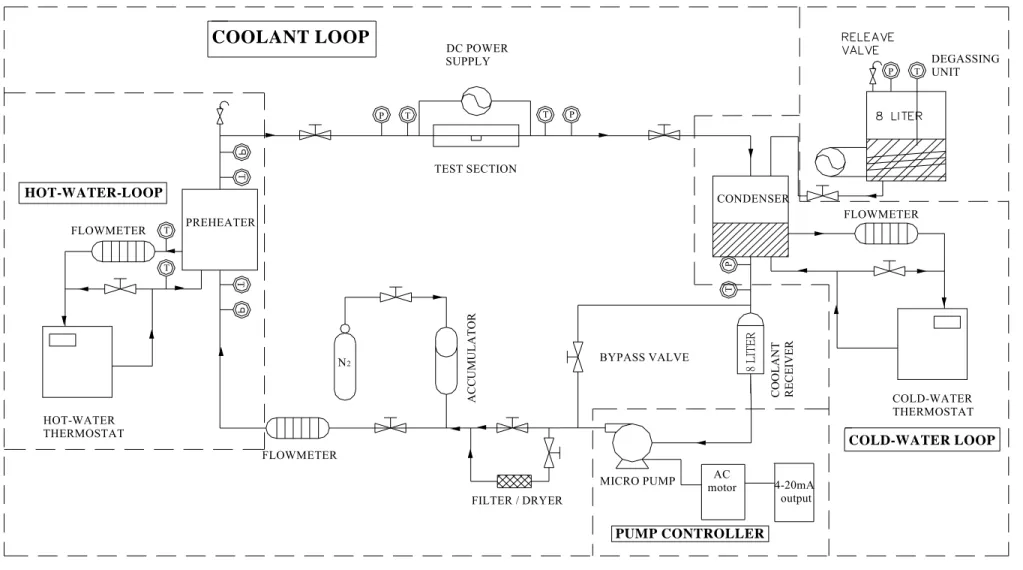
2.1 Degassing Unit 11 2.2 Coolant Loop 12 2.3 Test Section 13 2.4 Hot-water Loop 14 2.5 Cold-water Loop 15 2.6 DC Power Supply 15 2.7 Data Acquisition 15
2.8Optical Measurement Technique 16
2.9 Experimental Procedures 16
CHAPTER 3 DATA REDUCTION 27
3.1 Single Phase Heat Transfer 27
3.2 Two Phase Flow Boiling Heat Transfer 28
3.3 Uncertainty Analysis 29
CHAPTER 4 TRANSIENT SATURATED FLOW BOILING OF FC-72 OVER A SMALL HEATED COPPER PLATE 31
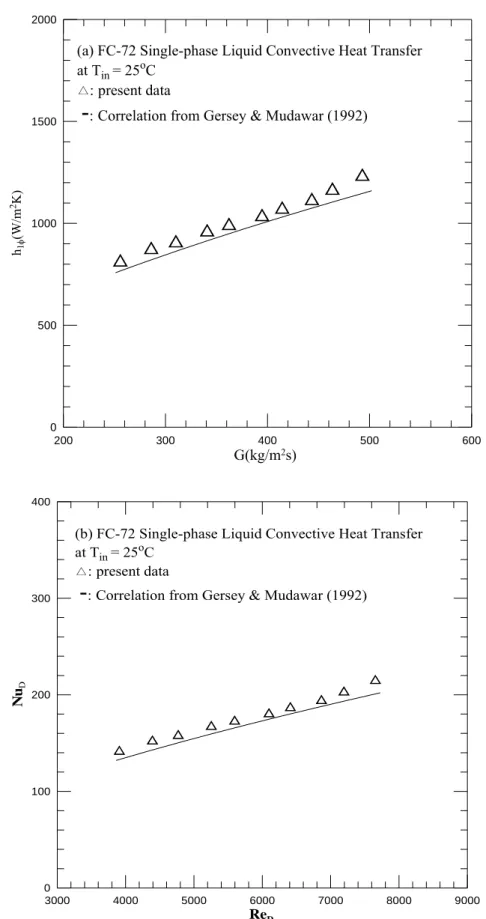
4.1 Single-phase Liquid Convective Heat Transfer 31
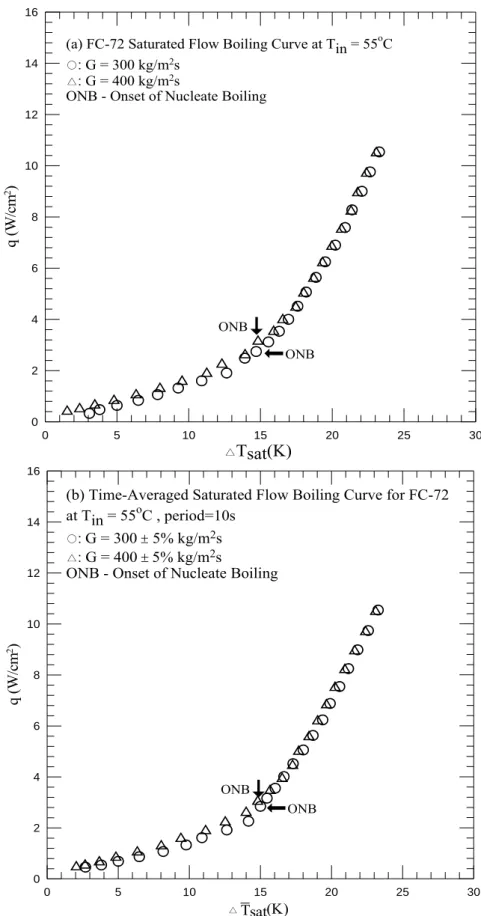
4.2 Stable and Time-average Saturated Flow Boiling Curves and Heat
Transfer Coefficient 32
4.3Transient Flow Boiling Heat Transfer Characteristics 34 4.4Transient Bubble Characteristics in Saturated Flow Boiling 36
4.5 Correlation Equations 39
CHAPTER 5 TRANSIENT SUBCOOLED FLOW BOILING OF FC-72 OVER
A SMALL HEATED COPPER PLATE 152
5.1 Stable and Time-average Subcooled Flow Boiling Curves and Heat
Transfer Coefficient 153
5.2Transient Subcooled Flow Boiling Heat Transfer Characteristics 155 5.3Transient Bubble Characteristics in Subcooled Flow Boiling 157
5.4 Correlation Equations 161
CHAPTER 6CONCLUDING REMARKS 387
iv
LIST OF TABLES
Table 1.1 Thermodynamic properties for FC-72 --- 9 Table 1.2 Some single-phase convection heat transfer correlations for electronic
cooling --- 10 Table 2.1 Experimental parameters --- 18 Table 2.2 Thermodynamic and transport properties of the dielectric refrigerant FC-72
list --- 19 Table 3.1 Summary of the uncertainty analysis --- 30 Table 4.1 Relative amplitudes of heated surface temperature and heat transfer
coefficient oscillations in transient oscillatory saturated flow boiling for various imposed heat fluxes and the amplitude and period of the coolant mass flux oscillation --- 43 Table 5.1 Relative amplitudes of heated surface temperature and heat transfer
coefficient oscillations in transient oscillatory subcooled flow boiling ΔTsub
= 5oC for various imposed heat fluxes and the amplitude and period of the coolant mass flux oscillation --- 164 Table 5.2 Relative amplitudes of heated surface temperature and heat transfer
coefficient oscillations in transient oscillatory subcooled flow boiling at
ΔTsub = 10oC for various imposed heat fluxes and the amplitude and period
LIST OF FIGURES
Experiment Apparatus
Fig 2.1 Schematic diagram of experimental apparatus --- 20
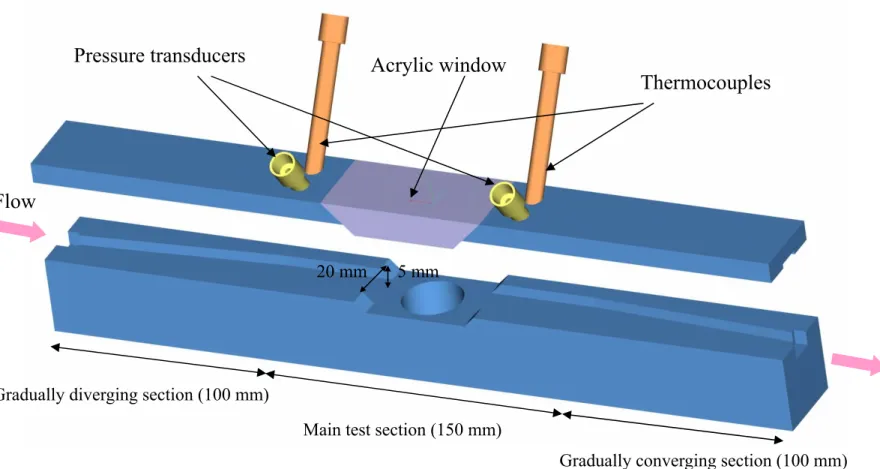
Fig 2.2 Three-dimensional plots of test section along with inlet and outlet sections --- 21
Fig 2.3 Three-dimensional plots illustrating the test section in the rectangular flow-channel --- 22
Fig 2.4 Three-dimensional pictures showing (a) hollow cylindrical Teflon block and (b) cylindrical Teflon bolt --- 23
Fig 2.5 Locations of thermocouples --- 24
Fig 2.6 Schematics of the silicon chip module --- 25
Fig 2.7 Locations of the thermocouple of the inside of the polyethylene insulation --- 26
Saturated Flow Boiling Fig 4.1 Comparison of the present steady single-phase liquid convection heat transfer data with the correlation of Gersey and Mudawar (1992) for (a) h1φ vs. G an (b) NuL vs. ReL --- 44
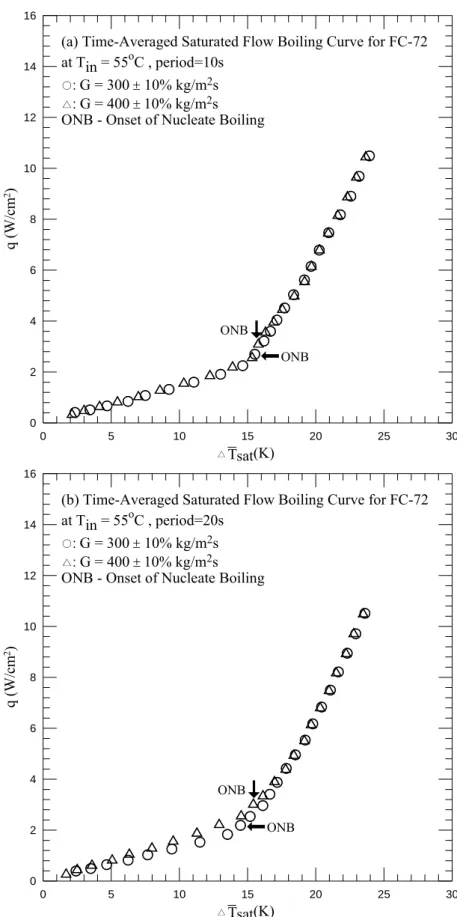
Fig 4.2 Time-average flow boiling curves for various coolant mass fluxes for stable saturated flow boiling (a) and transient saturated flow boiling for tp=10 sec (b), 20 sec (c) and 30 sec (d)--- 45
Fig 4.3 Time-average flow boiling curves for various coolant mass fluxes for transient saturated flow boiling at tp=10 sec (a), 20 sec (b) and 30 sec (c) --- 47
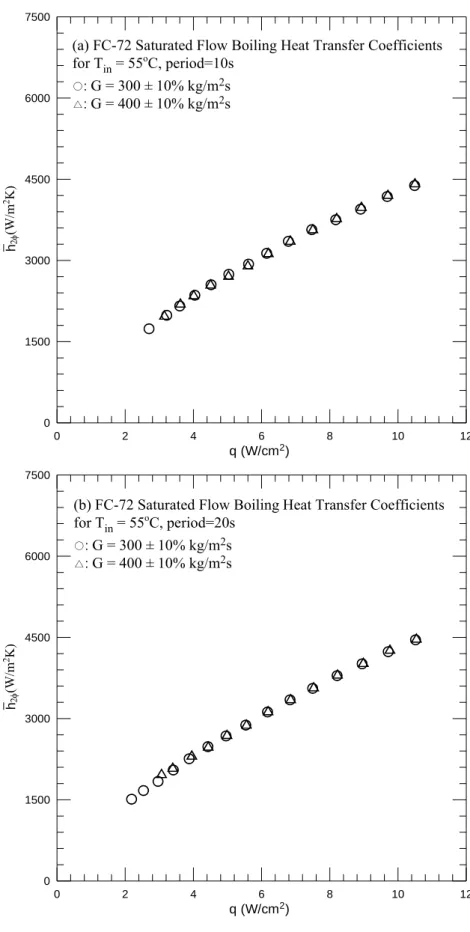
Fig 4.4 Time-average flow boiling heat transfer coefficients for various coolant mass fluxes for stable saturated flow boiling (a) and transient saturated flow boiling at tp=10 sec (b), 20 sec (c) and 30 sec (d) --- 49
Fig 4.5 Time-average flow boiling heat transfer coefficients for various coolant mass fluxes for transient saturated flow boiling at tp=10 sec (a), 20 sec (b) and 30 sec (c) --- 51
Fig 4.6 Time variations of the copper plate temperature in stable saturated flow boiling for various imposed heat fluxes at (a) G=300 kg/m2s and (b) G=400 kg/m2s --- 53
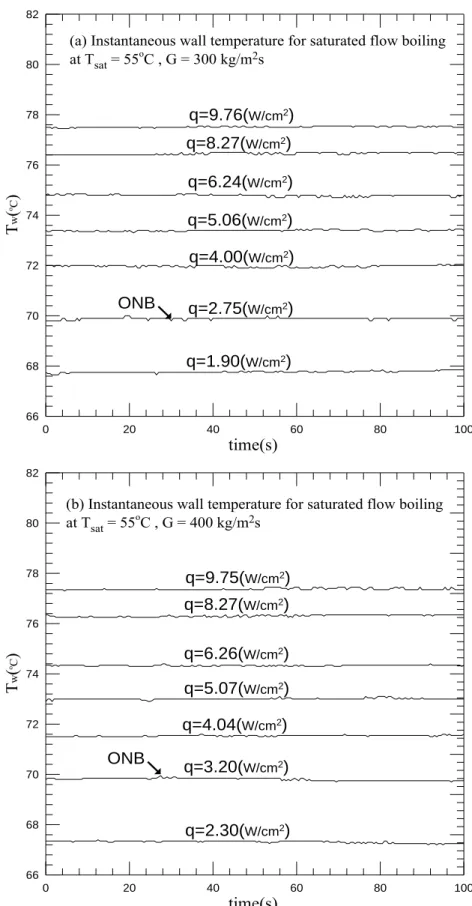
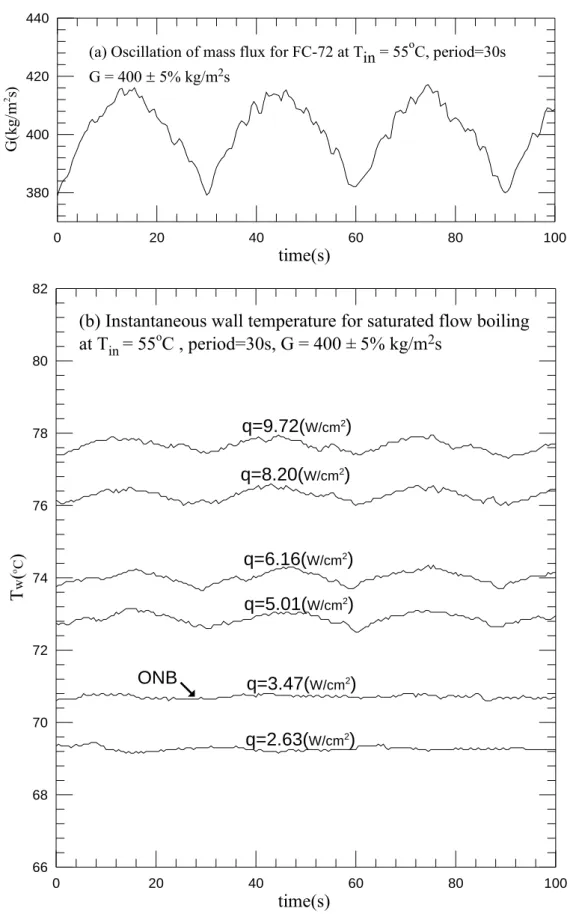
Fig 4.7 Time variations of (a) imposed coolant mass flux and (b) copper plate temperature in transient oscillatory saturated flow boiling for various imposed heat fluxes for G=300±5% kg/m2s with tp =10 sec.(qONB=2.84 w/cm2 at G =300 kg/m2s) --- 54 Fig 4.8 Time variations of (a) imposed coolant mass flux and (b) copper plate
vi
temperature in transient oscillatory saturated flow boiling for various imposed heat fluxes for G=400±5% kg/m2s with tp =10 sec.(qONB=3.09 w/cm
2 at G
=400 kg/m2s) --- 55 Fig 4.9 Time variations of (a) imposed coolant mass flux and (b) copper plate
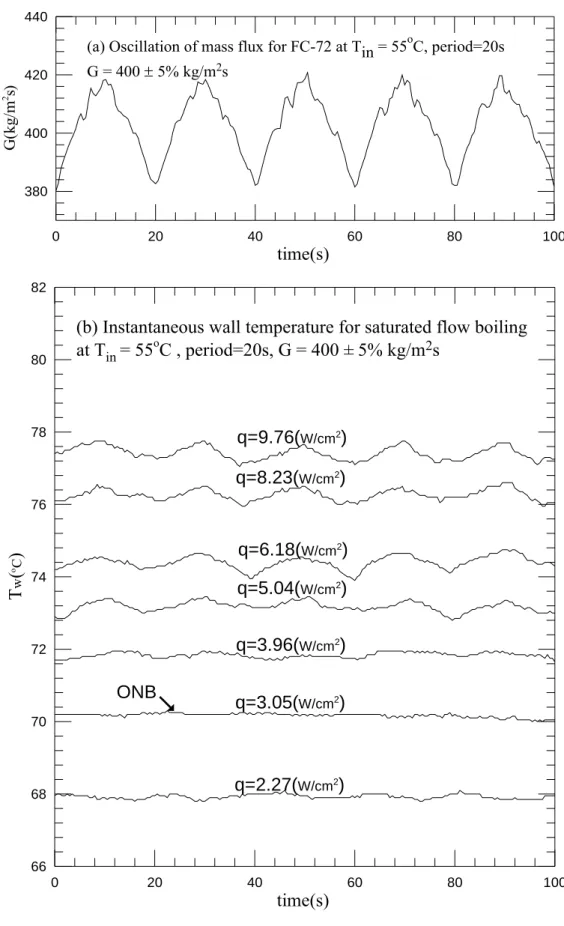
temperature in transient oscillatory saturated flow boiling for various imposed heat fluxes for G=300±5% kg/m2s with tp =20 sec.(qONB=2.62 w/cm
2 at G
=300 kg/m2s) --- 56 Fig 4.10 Time variations of (a) imposed coolant mass flux and (b) copper plate
temperature in transient oscillatory saturated flow boiling for various imposed heat fluxes for G=400±5% kg/m2s with tp =20 sec.(qONB=3.05 w/cm2 at G
=400 kg/m2s) --- 57 Fig 4.11 Time variations of (a) imposed coolant mass flux and (b) copper plate
temperature in transient oscillatory saturated flow boiling for various imposed heat fluxes for G=300±5% kg/m2s with tp =30 sec.(qONB=3.02 w/cm
2 at G
=300 kg/m2s) --- 58 Fig 4.12 Time variations of (a) imposed coolant mass flux and (b) copper plate
temperature in transient oscillatory saturated flow boiling for various imposed heat fluxes for G=400±5% kg/m2s with tp =30 sec.(qONB=3.47 w/cm2 at G
=400 kg/m2s) --- 59 Fig 4.13 Time variations of (a) imposed coolant mass flux and (b) copper plate
temperature in transient oscillatory saturated flow boiling for various imposed heat fluxes for G=300±10% kg/m2s with t
p =10 sec.(qONB=2.70 w/cm2 at G
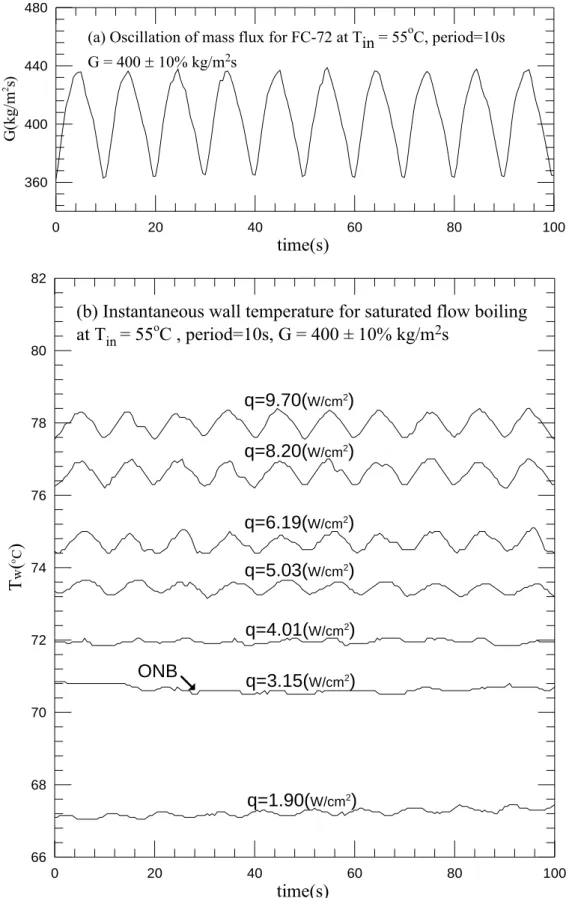
=300 kg/m2s) --- 60 Fig 4.14 Time variations of (a) imposed coolant mass flux and (b) copper plate
temperature in transient oscillatory saturated flow boiling for various imposed heat fluxes for G=400±10% kg/m2s with tp =10 sec.(qONB=3.15 w/cm
2 at G
=400 kg/m2s) --- 61 Fig 4.15 Time variations of (a) imposed coolant mass flux and (b) copper plate
temperature in transient oscillatory saturated flow boiling for various imposed heat fluxes for G=300±10% kg/m2s with tp =20 sec.(qONB=2.19 w/cm2 at G
=300 kg/m2s) --- 62 Fig 4.16 Time variations of (a) imposed coolant mass flux and (b) copper plate
temperature in transient oscillatory saturated flow boiling for various imposed heat fluxes for G=400±10% kg/m2s with tp =20 sec.(qONB=3.06 w/cm
2 at G
=400 kg/m2s) --- 63 Fig 4.17 Time variations of (a) imposed coolant mass flux and (b) copper plate
temperature in transient oscillatory saturated flow boiling for various imposed heat fluxes for G=300±10% kg/m2s with tp =30 sec.(qONB=2.17 w/cm
2 at G
=300 kg/m2s) --- 64 Fig 4.18 Time variations of (a) imposed coolant mass flux and (b) copper plate
temperature in transient oscillatory saturated flow boiling for various imposed heat fluxes for G=400±10% kg/m2s with tp =30 sec.(qONB=3.02 w/cm
2 at G
=400 kg/m2s) --- 65 Fig 4.19 Time variations of (a) imposed coolant mass flux and (b) flow boiling heat
transfer coefficients in transient oscillatory saturated flow boiling for various imposed heat fluxes for G=300± 5% kg/m2s with tp =10 sec --- 66
Fig 4.20 Time variations of (a) imposed coolant mass flux and (b) flow boiling heat transfer coefficients in transient oscillatory saturated flow boiling for various imposed heat fluxes for G=400± 5% kg/m2s with tp =10 sec --- 67
Fig 4.21 Time variations of (a) imposed coolant mass flux and (b) flow boiling heat transfer coefficients in transient oscillatory saturated flow boiling for various imposed heat fluxes for G=300± 5% kg/m2s with t
p =20 sec --- 68
Fig 4.22 Time variations of (a) imposed coolant mass flux and (b) flow boiling heat transfer coefficients in transient oscillatory saturated flow boiling for various imposed heat fluxes for G=400± 5% kg/m2s with tp =20 sec --- 69
Fig 4.23 Time variations of (a) imposed coolant mass flux and (b) flow boiling heat transfer coefficients in transient oscillatory saturated flow boiling for various imposed heat fluxes for G=300± 5% kg/m2s with tp =30 sec --- 70
Fig 4.24 Time variations of (a) imposed coolant mass flux and (b) flow boiling heat transfer coefficients in transient oscillatory saturated flow boiling for various imposed heat fluxes for G=400± 5% kg/m2s with tp =30 sec --- 71
Fig 4.25 Time variations of (a) imposed coolant mass flux and (b) flow boiling heat transfer coefficients in transient oscillatory saturated flow boiling for various imposed heat fluxes for G=300± 10% kg/m2s with tp =10 sec --- 72
Fig 4.26 Time variations of (a) imposed coolant mass flux and (b) flow boiling heat transfer coefficients in transient oscillatory saturated flow boiling for various imposed heat fluxes for G=400± 10% kg/m2s with tp =10 sec --- 73
Fig 4.27 Time variations of (a) imposed coolant mass flux and (b) flow boiling heat transfer coefficients in transient oscillatory saturated flow boiling for various imposed heat fluxes for G=300± 10% kg/m2s with tp =20 sec --- 74
Fig 4.28 Time variations of (a) imposed coolant mass flux and (b) flow boiling heat transfer coefficients in transient oscillatory saturated flow boiling for various imposed heat fluxes for G=400± 10% kg/m2s with tp =20 sec --- 75
viii
transfer coefficients in transient oscillatory saturated flow boiling for various imposed heat fluxes for G=300± 10% kg/m2s with tp =30 sec --- 76
Fig 4.30 Time variations of (a) imposed coolant mass flux and (b) flow boiling heat transfer coefficients in transient oscillatory saturated flow boiling for various imposed heat fluxes for G=400± 10% kg/m2s with tp =30 sec --- 77
Fig 4.31 Time variations of coolant mass flux and inlet pressure in transient oscillatory saturated flow boiling for various imposed heat fluxes at (a) q=4.01 W/cm2
and (b) q=8.25 W/cm2 for G=300±5% kg/m2s with tp =10 sec --- 78
Fig 4.32 Time variations of coolant mass flux and inlet pressure in transient oscillatory saturated flow boiling for various imposed heat fluxes at (a) q=3.98 W/cm2 and (b) q=8.26 W/cm2 for G=400±5% kg/m2s with tp =10 sec --- 79
Fig 4.33 Time variations of coolant mass flux and inlet pressure in transient oscillatory saturated flow boiling for various imposed heat fluxes at (a) q=3.93 W/cm2 and (b) q=8.24 W/cm2 for G=300±5% kg/m2s with tp =20 sec --- 80
Fig 4.34 Time variations of coolant mass flux and inlet pressure in transient oscillatory saturated flow boiling for various imposed heat fluxes at (a) q=3.96 W/cm2 and (b) q=8.23 W/cm2 for G=400±5% kg/m2s with tp =20 sec --- 81
Fig 4.35 Time variations of coolant mass flux and inlet pressure in transient oscillatory saturated flow boiling for various imposed heat fluxes at (a) q=3.93 W/cm2 and (b) q=8.21 W/cm2 for G=300±5% kg/m2s with tp =30 sec --- 82
Fig 4.36 Time variations of coolant mass flux and inlet pressure in transient oscillatory saturated flow boiling for various imposed heat fluxes at (a) q=3.47 W/cm2 and (b) q=8.20 W/cm2 for G=400±5% kg/m2s with tp =30 sec --- 83
Fig 4.37 Time variations of coolant mass flux and inlet pressure in transient oscillatory saturated flow boiling for various imposed heat fluxes at (a) q=4.04 W/cm2 and (b) q=8.17 W/cm2 for G=300±10% kg/m2s with tp =10 sec --- 84
Fig 4.38 Time variations of coolant mass flux and inlet pressure in transient oscillatory saturated flow boiling for various imposed heat fluxes at (a) q=4.01 W/cm2 and (b) q=8.20 W/cm2 for G=400±10% kg/m2s with tp =10 sec --- 85
Fig 4.39 Time variations of coolant mass flux and inlet pressure in transient oscillatory saturated flow boiling for various imposed heat fluxes at (a) q=3.41 W/cm2 and (b) q=8.21 W/cm2 for G=300±10% kg/m2s with t
p =20 sec --- 86
Fig 4.40 Time variations of coolant mass flux and inlet pressure in transient oscillatory saturated flow boiling for various imposed heat fluxes at (a) q=3.95 W/cm2 and (b) q=8.22 W/cm2 for G=400±10% kg/m2s with t
p =20 sec --- 87
Fig 4.41 Time variations of coolant mass flux and inlet pressure in transient oscillatory saturated flow boiling for various imposed heat fluxes at (a) q=3.39 W/cm2 and (b) q=8.18 W/cm2 for G=300±10% kg/m2s with tp =30 sec --- 88
Fig 4.42 Time variations of coolant mass flux and inlet pressure in transient oscillatory saturated flow boiling for various imposed heat fluxes at (a) q=3.95 W/cm2 and (b) q=8.20 W/cm2 for G=400±10% kg/m2s with tp =30 sec --- 89
Fig 4.43 Photos of stable saturated boiling flow at certain time instants for various imposed heat fluxes for (a) G =300 kg/m2s and (b) G =400 kg/m2s --- 90 Fig 4.44 Photos of transient oscillatory saturated flow boiling flow at certain time
instants for various imposed mass fluxes for q=6.2 W/cm2 at G=300±5%
kg/m2s with oscillation tp=10s --- 91
Fig 4.45 Photos of transient oscillatory saturated flow boiling flow at certain time instants for various imposed mass fluxes for q=7.5 W/cm2 at G=300±5% kg/m2s with oscillation tp=10s --- 92
Fig 4.46 Photos of transient oscillatory saturated flow boiling flow at certain time instants for various imposed mass fluxes for q=6.2 W/cm2 at G=400±5% kg/m2s with oscillation tp=10s --- 93
Fig 4.47 Photos of transient oscillatory saturated flow boiling flow at certain time instants for various imposed mass fluxes for q=9.0 W/cm2 at G=400±5% kg/m2s with oscillation tp=10s --- 94
Fig 4.48 Photos of transient oscillatory saturated flow boiling flow at certain time instants for various imposed mass fluxes for q=6.2 W/cm2 at G=300±5% kg/m2s with oscillation tp=20s --- 95
Fig 4.49 Photos of transient oscillatory saturated flow boiling flow at certain time instants for various imposed mass fluxes for q=7.5 W/cm2 at G=300±5% kg/m2s with oscillation tp=20s --- 96
Fig 4.50 Photos of transient oscillatory saturated flow boiling flow at certain time instants for various imposed mass fluxes for q=6.2 W/cm2 at G=400±5% kg/m2s with oscillation tp=20s --- 97
Fig 4.51 Photos of transient oscillatory saturated flow boiling flow at certain time instants for various imposed mass fluxes for q=9.0 W/cm2 at G=400±5% kg/m2s with oscillation tp=20s --- 98
Fig 4.52 Photos of transient oscillatory saturated flow boiling flow at certain time instants for various imposed mass fluxes for q=6.2 W/cm2 at G=300±5% kg/m2s with oscillation t
p=30s --- 99
Fig 4.53 Photos of transient oscillatory saturated flow boiling flow at certain time instants for various imposed mass fluxes for q=7.5 W/cm2 at G=300±5% kg/m2s with oscillation t
p=30s --- 100
Fig 4.54 Photos of transient oscillatory saturated flow boiling flow at certain time instants for various imposed mass fluxes for q=6.2 W/cm2 at G=400±5% kg/m2s with oscillation tp=30s --- 101
x
Fig 4.55 Photos of transient oscillatory saturated flow boiling flow at certain time instants for various imposed mass fluxes for q=9.0 W/cm2 at G=400±5% kg/m2s with oscillation tp=30s --- 102
Fig 4.56 Photos of transient oscillatory saturated flow boiling flow at certain time instants for various imposed mass fluxes for q=6.2 W/cm2 at G=300±10% kg/m2s with oscillation tp=10s --- 103
Fig 4.57 Photos of transient oscillatory saturated flow boiling flow at certain time instants for various imposed mass fluxes for q=7.5 W/cm2 at G=300±10% kg/m2s with oscillation tp=10s --- 104
Fig 4.58 Photos of transient oscillatory saturated flow boiling flow at certain time instants for various imposed mass fluxes for q=6.2 W/cm2 at G=400±10% kg/m2s with oscillation tp=10s --- 105
Fig 4.59 Photos of transient oscillatory saturated flow boiling flow at certain time instants for various imposed mass fluxes for q=8.9 W/cm2 at G=400±10% kg/m2s with oscillation tp=10s --- 106
Fig 4.60 Photos of transient oscillatory saturated flow boiling flow at certain time instants for various imposed mass fluxes for q=6.2 W/cm2 at G=300±10% kg/m2s with oscillation tp=20s --- 107
Fig 4.61 Photos of transient oscillatory saturated flow boiling flow at certain time instants for various imposed mass fluxes for q=7.5 W/cm2 at G=300±10% kg/m2s with oscillation tp=20s --- 108
Fig 4.62 Photos of transient oscillatory saturated flow boiling flow at certain time instants for various imposed mass fluxes for q=6.2 W/cm2 at G=400±10% kg/m2s with oscillation tp=20s --- 109
Fig 4.63 Photos of transient oscillatory saturated flow boiling flow at certain time instants for various imposed mass fluxes for q=9.0 W/cm2 at G=400±10% kg/m2s with oscillation t
p=20s --- 110
Fig 4.64 Photos of transient oscillatory saturated flow boiling flow at certain time instants for various imposed mass fluxes for q=6.1 W/cm2 at G=300±10% kg/m2s with oscillation t
p=30s --- 111
Fig 4.65 Photos of transient oscillatory saturated flow boiling flow at certain time instants for various imposed mass fluxes for q=7.5 W/cm2 at G=300±10%
kg/m2s with oscillation tp=30s --- 112
Fig 4.66 Photos of transient oscillatory saturated flow boiling flow at certain time instants for various imposed mass fluxes for q=6.2 W/cm2 at G=400±10%
kg/m2s with oscillation tp=30s --- 113
Fig 4.67 Photos of transient oscillatory saturated flow boiling flow at certain time instants for various imposed mass fluxes for q=9.0 W/cm2 at G=400±10%
kg/m2s with oscillation tp=30s --- 114
Fig 4.68 Mean bubble departure diameters for various coolant mass fluxes for stable saturated flow boiling (a) and various imposed heat fluxes for transient saturated flow boiling for G=300±5% kg/m2s with tp=10 sec (b), 20sec (c) and
30 sec (d) --- 115 Fig 4.69 Mean bubble departure diameters for various imposed heat fluxes for transient
saturated flow boiling for G=300±10% kg/m2s with t
p=10 sec (a), 20sec (b)
and 30 sec (c) --- 117 Fig 4.70 Mean bubble departure diameters for various imposed heat fluxes for transient
saturated flow boiling for G=400±5% kg/m2s with tp=10 sec (a), 20sec (b) and
30 sec (c) --- 118 Fig 4.71 Mean bubble departure diameters for various imposed heat fluxes for transient
saturated flow boiling for G=400±10% kg/m2s with tp=10 sec (a), 20sec (b)
and 30 sec (c) --- 119 Fig 4.72 Mean bubble departure diameters for various periods of the mass flux
oscillation for transient saturated flow boiling for G=300±5% kg/m2s with (a) q=6.2 W/cm2 and (b) q=7.5 W/cm2 --- 120 Fig 4.73 Mean bubble departure diameters for various periods of the mass flux
oscillation for transient saturated flow boiling for G=300±10% kg/m2s with (a) q=6.2 W/cm2 and (b) q=7.5 W/cm2 --- 121 Fig 4.74 Mean bubble departure diameters for various periods of the mass flux
oscillation for transient saturated flow boiling for G=400±5% kg/m2s with (a) q=6.2 W/cm2 and (b) q=9.0 W/cm2 --- 122 Fig 4.75 Mean bubble departure diameters for various periods of the mass flux
oscillation for transient saturated flow boiling for G=400±10% kg/m2s with (a) q=6.2 W/cm2 and (b) q=9.0 W/cm2 --- 123 Fig 4.76 Mean bubble departure diameters for various amplitudes of the mass fluxes
oscillation for transient saturated flow boiling for q=6.2 W/cm2 with period=10 sec (a), 20 sec (b), and 30 sec (c) --- 124 Fig 4.77 Mean bubble departure frequencies for various coolant mass fluxes for stable
saturated flow boiling (a) and various imposed heat fluxes for transient saturated flow boiling for G=300±5% kg/m2s with t
p=10 sec (b), 20sec (c) and
30 sec (d) --- 125 Fig 4.78 Mean bubble departure frequencies for various imposed heat fluxes for
transient saturated flow boiling for G=300±10% kg/m2s with t
p=10 sec (a),
20sec (b) and 30 sec (c) --- 127 Fig 4.79 Mean bubble departure frequencies for various imposed heat fluxes for
xii
20sec (b) and 30 sec (c) --- 128 Fig 4.80 Mean bubble departure frequencies for various imposed heat fluxes for
transient saturated flow boiling for G=400±10% kg/m2s with tp=10 sec (a),
20sec (b) and 30 sec (c) --- 129 Fig 4.81 Mean bubble departure frequencies for various periods of mass flux
oscillation for transient saturated flow boiling for G=300±5% kg/m2s with (a) q=6.2 W/cm2 and (b) q=7.5 W/cm2 --- 130
Fig 4.82 Mean bubble departure frequencies for various periods of mass flux oscillation for transient saturated flow boiling for G=300±10% kg/m2s with (a) q=6.2 W/cm2 and (b) q=7.5 W/cm2 --- 131 Fig 4.83 Mean bubble departure frequencies for various periods of mass flux
oscillation for transient saturated flow boiling for G=400±5% kg/m2s with (a)
q=6.2 W/cm2 and (b) q=9.0 W/cm2 --- 132 Fig 4.84 Mean bubble departure frequencies for various periods of mass flux
oscillation for transient saturated flow boiling for G=400±10% kg/m2s with (a) q=6.2 W/cm2 and (b) q=9.0 W/cm2 --- 133 Fig 4.85 Mean bubble departure frequencies for various amplitudes of the mass fluxes
oscillation for transient saturated flow boiling for q=6.2 W/cm2 with period=10 sec (a), 20 sec (b), and 30 sec (c) --- 134 Fig 4.86 Mean active nucleation site densities for various coolant mass fluxes for stable
saturated flow boiling (a) and various imposed heat fluxes for transient saturated flow boiling for G=300±5% kg/m2s with tp=10 sec (b), 20sec (c) and
30 sec (d) --- 135 Fig 4.87 Mean active nucleation site densities for various imposed heat fluxes for
transient saturated flow boiling for G=300±10% kg/m2s with tp=10 sec (a),
20sec (b) and 30 sec (c) --- 137 Fig 4.88 Mean active nucleation site densities for various imposed heat fluxes for
transient saturated flow boiling for G=400±5% kg/m2s with tp=10 sec (a),
20sec (b) and 30 sec (c) --- 138 Fig 4.89 Mean active nucleation site densities for various imposed heat fluxes for
transient saturated flow boiling for G=400±10% kg/m2s with tp=10 sec (a),
20sec (b) and 30 sec (c) --- 139 Fig 4.90 Mean active nucleation site densities for various periods of mass flux
oscillation for transient saturated flow boiling for G=300±5% kg/m2s with (a) q=6.2 W/cm2 and (b) q=7.5 W/cm2 --- 140
Fig 4.91 Mean active nucleation site densities for various periods of mass flux oscillation for transient saturated flow boiling for G=300±10% kg/m2s with (a) q=6.2 W/cm2 and (b) q=7.5 W/cm2 --- 141
Fig 4.92 Mean active nucleation site densities for various periods of mass flux oscillation for transient saturated flow boiling for G=400±5% kg/m2s with (a) q=6.2 W/cm2 and (b) q=9.0 W/cm2 --- 142 Fig 4.93 Mean active nucleation site densities for various periods of mass flux
oscillation for transient saturated flow boiling for G=400±10% kg/m2s with (a) q=6.2 W/cm2 and (b) q=9.0 W/cm2 --- 143 Fig 4.94 Mean active nucleation site densities for various amplitudes of the mass fluxes
oscillation for transient saturated flow boiling for q=6.2 W/cm2 with period=10 sec (a), 20 sec (b), and 30 sec (c) --- 144 Fig 4.95 Comparison of the measured data for mean bubble departure diameter for
saturated flow boiling of FC-72 with the proposed correlation --- 145 Fig 4.96 Comparison of the measured data for mean bubble departure diameter for
transient saturated flow boiling of FC-72 with the proposed correlation --- 146 Fig 4.97 Comparison of the measured data for mean bubble departure frequency for
saturated flow boiling of FC-72 with the proposed correlation --- 147 Fig 4.98 Comparison of the measured data for mean bubble departure frequency for
transient saturated flow boiling of FC-72 with the proposed correlation --- 148 Fig 4.99 Comparison of the measured data for mean active nucleation site density for
saturated flow boiling of FC-72 with the proposed correlation --- 149 Fig 4.100 Comparison of the measured data for mean active nucleation site density for
transient saturated flow boiling of FC-72 with the proposed correlation --- 150 Fig 4.101 Comparison of the measured data for boiling heat flux for stable saturated
flow boiling of FC-72 with the proposed correlation --- 151
Subcooled Flow Boiling
Fig 5.1 Time-average flow boiling curves for various coolant mass fluxes for stable subcooled flow boiling (a) and transient subcooled flow boiling at △Tsub =5oC
for tp=10 sec (b), 20 sec (c) and 30 sec (d)--- 166
Fig 5.2 Time-average flow boiling curves for various coolant mass fluxes for transient subcooled flow boiling at △Tsub =5oC for tp=10 sec (a), 20 sec (b) and 30 sec
(c) --- 168 Fig 5.3 Time-average flow boiling curves for various coolant mass fluxes for stable
subcooled flow boiling (a) and transient subcooled flow boiling at △Tsub
=10oC for tp=10 sec (b), 20 sec (c) and 30 sec (d) --- 170
Fig 5.4 Time-average flow boiling curves for various coolant mass fluxes for transient subcooled flow boiling at △Tsub =10oC for tp=10 sec (a), 20 sec (b) and 30 sec
(c) --- 172 Fig 5.5 Time-average flow boiling curves for various inlet subcoolings for stable
xiv
subcooled flow boiling at (a) G=300 kg/m2s and (b) G=400 kg/m2s --- 174 Fig 5.6 Time-average flow boiling curves for various inlet subcoolings for transient
subcooled flow boiling at (a) G=300±5% kg/m2s and (b) G=400±5% kg/m2s at tp=10 sec --- 175
Fig 5.7 Time-average flow boiling curves for various inlet subcoolings for transient subcooled flow boiling at (a) G=300±5% kg/m2s and (b) G=400±5% kg/m2s at tp=20 sec --- 176
Fig 5.8 Time-average flow boiling curves for various inlet subcoolings for transient subcooled flow boiling at (a) G=300±5% kg/m2s and (b) G=400±5% kg/m2s at tp=30 sec --- 177
Fig 5.9 Time-average flow boiling curves for various inlet subcoolings for transient subcooled flow boiling at (a) G=300±10% kg/m2s and (b) G=400±10%
kg/m2s at tp=10 sec --- 178
Fig 5.10 Time-average flow boiling curves for various inlet subcoolings for transient subcooled flow boiling at (a) G=300±10% kg/m2s and (b) G=400±10% kg/m2s at tp=20 sec --- 179
Fig 5.11 Time-average flow boiling curves for various inlet subcoolings for transient subcooled flow boiling at (a) G=300±10% kg/m2s and (b) G=400±10% kg/m2s at tp=30 sec --- 180
Fig 5.12 Time-average flow boiling heat transfer coefficients for various coolant mass fluxes for stable subcooled flow boiling (a) and transient subcooled flow boiling at △Tsub =5oC for tp=10 sec (b), 20 sec (c) and 30 sec (d) --- 181
Fig 5.13 Time-average flow boiling heat transfer coefficients for various coolant mass fluxes for transient subcooled flow boiling at △Tsub =5oC for tp=10 sec (a), 20
sec (b) and 30 sec (c) --- 183 Fig 5.14 Time-average flow boiling heat transfer coefficients for various coolant mass
fluxes for stable subcooled flow boiling (a) and transient subcooled flow boiling at △Tsub =10oC for tp=10 sec (b), 20 sec (c) and 30 sec (d) --- 185
Fig 5.15 Time-average flow boiling heat transfer coefficients for various coolant mass fluxes for transient subcooled flow boiling at △Tsub =10oC for tp=10 sec (a),
20 sec (b) and 30 sec (c)--- 187 Fig 5.16 Time-average flow boiling heat transfer coefficients for various inlet
subcoolings for stable subcooled flow boiling at (a) G=300 kg/m2s and (b) G=400 kg/m2s --- 189 Fig 5.17 Time-average flow boiling heat transfer coefficients for various inlet
subcoolings for stable subcooled flow boiling at (a) G=300±5% kg/m2s and (b) G=400±5% kg/m2s at tp=10 sec --- 190
subcoolings for stable subcooled flow boiling at (a) G=300±5% kg/m2s and (b) G=400±5% kg/m2s at tp=20 sec --- 191
Fig 5.19 Time-average flow boiling heat transfer coefficients for various inlet subcoolings for stable subcooled flow boiling at (a) G=300±5% kg/m2s and (b) G=400±5% kg/m2s at tp=30 sec --- 192
Fig 5.20 Time-average flow boiling heat transfer coefficients for various inlet subcoolings for stable subcooled flow boiling at (a) G=300±10% kg/m2s and
(b) G=400±10% kg/m2s at tp=10 sec --- 193
Fig 5.21 Time-average flow boiling heat transfer coefficients for various inlet subcoolings for stable subcooled flow boiling at (a) G=300±10% kg/m2s and (b) G=400±10% kg/m2s at tp=20 sec --- 194
Fig 5.22 Time-average flow boiling heat transfer coefficients for various inlet subcoolings for stable subcooled flow boiling at (a) G=300±10% kg/m2s and (b) G=400±10% kg/m2s at tp=30 sec --- 195
Fig 5.23 Time variations of the copper plate temperature in stable subcooled flow boiling for various imposed heat fluxes for △Tsub =5oC at (a) G=300 kg/m2s
and (b) G=400 kg/m2s --- 196 Fig 5.24 Time variations of (a) imposed coolant mass flux and (b) copper plate
temperature in transient oscillatory subcooled flow boiling for various imposed heat fluxes for G=300±5% kg/m2s with tp =10 sec.(qONB=3.59 w/cm
2
at G =300 kg/m2s) --- 197 Fig 5.25 Time variations of (a) imposed coolant mass flux and (b) copper plate
temperature in transient oscillatory subcooled flow boiling for various imposed heat fluxes for G=400±5% kg/m2s with tp =10 sec.(qONB=4.45 w/cm2
at G =400 kg/m2s) --- 198 Fig 5.26 Time variations of (a) imposed coolant mass flux and (b) copper plate
temperature in transient oscillatory subcooled flow boiling for various imposed heat fluxes for G=300±5% kg/m2s with t
p =20 sec.(qONB=3.43 w/cm2
at G =300 kg/m2s) --- 199 Fig 5.27 Time variations of (a) imposed coolant mass flux and (b) copper plate
temperature in transient oscillatory subcooled flow boiling for various imposed heat fluxes for G=400±5% kg/m2s with tp =20 sec.(qONB=4.35 w/cm
2
at G =400 kg/m2s) --- 200 Fig 5.28 Time variations of (a) imposed coolant mass flux and (b) copper plate
temperature in transient oscillatory subcooled flow boiling for various imposed heat fluxes for G=300±5% kg/m2s with tp =30 sec.(qONB=3.40 w/cm2
xvi
Fig 5.29 Time variations of (a) imposed coolant mass flux and (b) copper plate temperature in transient oscillatory subcooled flow boiling for various imposed heat fluxes for G=400±5% kg/m2s with tp =30 sec.(qONB=4.35 w/cm
2
at G =400 kg/m2s) --- 202 Fig 5.30 Time variations of (a) imposed coolant mass flux and (b) copper plate
temperature in transient oscillatory subcooled flow boiling for various imposed heat fluxes for G=300±10% kg/m2s with tp =10 sec.(qONB=3.44
w/cm2 at G =300 kg/m2s) --- 203 Fig 5.31 Time variations of (a) imposed coolant mass flux and (b) copper plate
temperature in transient oscillatory subcooled flow boiling for various imposed heat fluxes for G=400±10% kg/m2s with t
p =10 sec.(qONB=4.51
w/cm2 at G =400 kg/m2s) --- 204 Fig 5.32 Time variations of (a) imposed coolant mass flux and (b) copper plate
temperature in transient oscillatory subcooled flow boiling for various imposed heat fluxes for G=300±10% kg/m2s with tp =20 sec.(qONB=3.34
w/cm2 at G =300 kg/m2s) --- 205 Fig 5.33 Time variations of (a) imposed coolant mass flux and (b) copper plate
temperature in transient oscillatory subcooled flow boiling for various imposed heat fluxes for G=400±10% kg/m2s with tp =20 sec.(qONB=3.90
w/cm2 at G =400 kg/m2s) --- 206 Fig 5.34 Time variations of (a) imposed coolant mass flux and (b) copper plate
temperature in transient oscillatory subcooled flow boiling for various imposed heat fluxes for G=300±10% kg/m2s with tp =30 sec.(qONB=3.34
w/cm2 at G =300 kg/m2s) --- 207 Fig 5.35 Time variations of (a) imposed coolant mass flux and (b) copper plate
temperature in transient oscillatory subcooled flow boiling for various imposed heat fluxes for G=400±10% kg/m2s with tp =30 sec.(qONB=3.84
w/cm2 at G =400 kg/m2s) --- 208 Fig 5.36 Time variations of the copper plate temperature in stable subcooled flow
boiling for various imposed heat fluxes for △Tsub =10oC at (a) G=300 kg/m2s
and (b) G=400 kg/m2s --- 209 Fig 5.37 Time variations of (a) imposed coolant mass flux and (b) copper plate
temperature in transient oscillatory subcooled flow boiling for various imposed heat fluxes for G=300±5% kg/m2s with tp =10 sec.(qONB =4.33
w/cm2 at G =300 kg/m2s) --- 210
Fig 5.38 Time variations of (a) imposed coolant mass flux and (b) copper plate temperature in transient oscillatory subcooled flow boiling for various
imposed heat fluxes for G=400±5% kg/m2s with tp =10 sec.(qONB=6.13 w/cm2
at G =400 kg/m2s) --- 211 Fig 5.39 Time variations of (a) imposed coolant mass flux and (b) copper plate
temperature in transient oscillatory subcooled flow boiling for various imposed heat fluxes for G=300±5% kg/m2s with tp =20 sec.(qONB=4.28 w/cm
2
at G =300 kg/m2s) --- 212 Fig 5.40 Time variations of (a) imposed coolant mass flux and (b) copper plate
temperature in transient oscillatory subcooled flow boiling for various imposed heat fluxes for G=400±5% kg/m2s with tp =20 sec.(qONB=6.04 w/cm2
at G =400 kg/m2s) --- 213 Fig 5.41 Time variations of (a) imposed coolant mass flux and (b) copper plate
temperature in transient oscillatory subcooled flow boiling for various imposed heat fluxes for G=300±5% kg/m2s with t
p =30 sec.(qONB=4.79 w/cm2
at G =300 kg/m2s) --- 214 Fig 5.42 Time variations of (a) imposed coolant mass flux and (b) copper plate
temperature in transient oscillatory subcooled flow boiling for various imposed heat fluxes for G=400±5% kg/m2s with tp =30 sec.(qONB=5.96 w/cm
2
at G =400 kg/m2s) --- 215 Fig 5.43 Time variations of (a) imposed coolant mass flux and (b) copper plate
temperature in transient oscillatory subcooled flow boiling for various imposed heat fluxes for G=300±10% kg/m2s with tp =10 sec.(qONB=4.32
w/cm2 at G =300 kg/m2s) --- 216 Fig 5.44 Time variations of (a) imposed coolant mass flux and (b) copper plate
temperature in transient oscillatory subcooled flow boiling for various imposed heat fluxes for G=400±10% kg/m2s with tp =10 sec.(qONB=5.58
w/cm2 at G =400 kg/m2s) --- 217 Fig 5.45 Time variations of (a) imposed coolant mass flux and (b) copper plate
temperature in transient oscillatory subcooled flow boiling for various imposed heat fluxes for G=300±10% kg/m2s with tp =20 sec.(qONB=4.30
w/cm2 at G =300 kg/m2s) --- 218 Fig 5.46 Time variations of (a) imposed coolant mass flux and (b) copper plate
temperature in transient oscillatory subcooled flow boiling for various imposed heat fluxes for G=400±10% kg/m2s with t
p =20 sec.(qONB=5.47
w/cm2 at G =400 kg/m2s) --- 219 Fig 5.47 Time variations of (a) imposed coolant mass flux and (b) copper plate
xviii
imposed heat fluxes for G=300±10% kg/m2s with tp =30 sec.(qONB=4.28
w/cm2 at G =300 kg/m2s) --- 220 Fig 5.48 Time variations of (a) imposed coolant mass flux and (b) copper plate
temperature in transient oscillatory subcooled flow boiling for various imposed heat fluxes for G=400±10% kg/m2s with tp =30 sec.(qONB=5.44
w/cm2 at G =400 kg/m2s) --- 221 Fig 5.49 Time variations of (a) imposed coolant mass flux and (b) flow boiling heat
transfer coefficients in transient oscillatory subcooled flow boiling for various imposed heat fluxes for G=300±5% kg/m2s with tp =10 sec--- 222
Fig 5.50 Time variations of (a) imposed coolant mass flux and (b) flow boiling heat transfer coefficients in transient oscillatory subcooled flow boiling for various imposed heat fluxes for G=400±5% kg/m2s with tp =10 sec--- 223
Fig 5.51 Time variations of (a) imposed coolant mass flux and (b) flow boiling heat transfer coefficients in transient oscillatory subcooled flow boiling for various imposed heat fluxes for G=300±5% kg/m2s with tp =20 sec--- 224
Fig 5.52 Time variations of (a) imposed coolant mass flux and (b) flow boiling heat transfer coefficients in transient oscillatory subcooled flow boiling for various imposed heat fluxes for G=400±5% kg/m2s with tp =20 sec--- 225
Fig 5.53 Time variations of (a) imposed coolant mass flux and (b) flow boiling heat transfer coefficients in transient oscillatory subcooled flow boiling for various imposed heat fluxes for G=300±5% kg/m2s with t
p =30 sec--- 226
Fig 5.54 Time variations of (a) imposed coolant mass flux and (b) flow boiling heat transfer coefficients in transient oscillatory subcooled flow boiling for various imposed heat fluxes for G=400±5% kg/m2s with t
p =30 sec--- 227
Fig 5.55 Time variations of (a) imposed coolant mass flux and (b) flow boiling heat transfer coefficients in transient oscillatory subcooled flow boiling for various imposed heat fluxes for G=300±10% kg/m2s with tp =10 sec --- 228
Fig 5.56 Time variations of (a) imposed coolant mass flux and (b) flow boiling heat transfer coefficients in transient oscillatory subcooled flow boiling for various imposed heat fluxes for G=400±10% kg/m2s with tp =10 sec --- 229
Fig 5.57 Time variations of (a) imposed coolant mass flux and (b) flow boiling heat transfer coefficients in transient oscillatory subcooled flow boiling for various imposed heat fluxes for G=300±10% kg/m2s with tp =20 sec --- 230
Fig 5.58 Time variations of (a) imposed coolant mass flux and (b) flow boiling heat transfer coefficients in transient oscillatory subcooled flow boiling for various imposed heat fluxes for G=400±10% kg/m2s with tp =20 sec --- 231
Fig 5.59 Time variations of (a) imposed coolant mass flux and (b) flow boiling heat transfer coefficients in transient oscillatory subcooled flow boiling for various
imposed heat fluxes for G=300±10% kg/m2s with tp =30 sec --- 232
Fig 5.60 Time variations of (a) imposed coolant mass flux and (b) flow boiling heat transfer coefficients in transient oscillatory subcooled flow boiling for various imposed heat fluxes for G=400±10% kg/m2s with tp =30 sec --- 233
Fig 5.61 Time variations of (a) imposed coolant mass flux and (b) flow boiling heat transfer coefficients in transient oscillatory subcooled flow boiling for various imposed heat fluxes for G=300±5% kg/m2s with t
p =10 sec--- 234
Fig 5.62 Time variations of (a) imposed coolant mass flux and (b) flow boiling heat transfer coefficients in transient oscillatory subcooled flow boiling for various imposed heat fluxes for G=400±5% kg/m2s with tp =10 sec--- 235
Fig 5.63 Time variations of (a) imposed coolant mass flux and (b) flow boiling heat transfer coefficients in transient oscillatory subcooled flow boiling for various imposed heat fluxes for G=300±5% kg/m2s with tp =20 sec--- 236
Fig 5.64 Time variations of (a) imposed coolant mass flux and (b) flow boiling heat transfer coefficients in transient oscillatory subcooled flow boiling for various imposed heat fluxes for G=400±5% kg/m2s with tp =20 sec--- 237
Fig 5.65 Time variations of (a) imposed coolant mass flux and (b) flow boiling heat transfer coefficients in transient oscillatory subcooled flow boiling for various imposed heat fluxes for G=300±5% kg/m2s with tp =30 sec--- 238
Fig 5.66 Time variations of (a) imposed coolant mass flux and (b) flow boiling heat transfer coefficients in transient oscillatory subcooled flow boiling for various imposed heat fluxes for G=400±5% kg/m2s with tp =30 sec--- 239
Fig 5.67 Time variations of (a) imposed coolant mass flux and (b) flow boiling heat transfer coefficients in transient oscillatory subcooled flow boiling for various imposed heat fluxes for G=300±10% kg/m2s with tp =10 sec --- 240
Fig 5.68 Time variations of (a) imposed coolant mass flux and (b) flow boiling heat transfer coefficients in transient oscillatory subcooled flow boiling for various imposed heat fluxes for G=400±10% kg/m2s with tp =10 sec --- 241
Fig 5.69 Time variations of (a) imposed coolant mass flux and (b) flow boiling heat transfer coefficients in transient oscillatory subcooled flow boiling for various imposed heat fluxes for G=300±10% kg/m2s with tp =20 sec --- 242
Fig 5.70 Time variations of (a) imposed coolant mass flux and (b) flow boiling heat transfer coefficients in transient oscillatory subcooled flow boiling for various imposed heat fluxes for G=400±10% kg/m2s with tp =20 sec --- 243
Fig 5.71 Time variations of (a) imposed coolant mass flux and (b) flow boiling heat transfer coefficients in transient oscillatory subcooled flow boiling for various imposed heat fluxes for G=300±10% kg/m2s with tp =30 sec --- 244
xx
transfer coefficients in transient oscillatory subcooled flow boiling for various imposed heat fluxes for G=400±10% kg/m2s with tp =30 sec --- 245
Fig 5.73 Time variations of coolant mass flux and inlet pressure in transient oscillatory subcooled flow boiling for various imposed heat fluxes at (a) q=3.59 W/cm2 and (b) q=8.19 W/cm2 for G=300±5% kg/m2s with tp =10 sec --- 246
Fig 5.74 Time variations of coolant mass flux and inlet pressure in transient oscillatory subcooled flow boiling for various imposed heat fluxes at (a) q=5.55 W/cm2
and (b) q=8.17 W/cm2 for G=400±5% kg/m2s with tp =10 sec --- 247
Fig 5.75 Time variations of coolant mass flux and inlet pressure in transient oscillatory subcooled flow boiling for various imposed heat fluxes at (a) q=4.96 W/cm2 and (b) q=8.17 W/cm2 for G=300±5% kg/m2s with tp =20 sec --- 248
Fig 5.76 Time variations of coolant mass flux and inlet pressure in transient oscillatory subcooled flow boiling for various imposed heat fluxes at (a) q=5.46 W/cm2 and (b) q=8.11 W/cm2 for G=400±5% kg/m2s with tp =20 sec --- 249
Fig 5.77 Time variations of coolant mass flux and inlet pressure in transient oscillatory subcooled flow boiling for various imposed heat fluxes at (a) q=4.95 W/cm2 and (b) q=8.15 W/cm2 for G=300±5% kg/m2s with tp =30 sec --- 250
Fig 5.78 Time variations of coolant mass flux and inlet pressure in transient oscillatory subcooled flow boiling for various imposed heat fluxes at (a) q=5.48 W/cm2 and (b) q=8.10 W/cm2 for G=400±5% kg/m2s with tp =30 sec --- 251
Fig 5.79 Time variations of coolant mass flux and inlet pressure in transient oscillatory subcooled flow boiling for various imposed heat fluxes at (a) q=4.39 W/cm2 and (b) q=8.14 W/cm2 for G=300±10% kg/m2s with tp =10 sec --- 252
Fig 5.80 Time variations of coolant mass flux and inlet pressure in transient oscillatory subcooled flow boiling for various imposed heat fluxes at (a) q=5.50 W/cm2 and (b) q=8.12 W/cm2 for G=400±10% kg/m2s with tp =10 sec --- 253
Fig 5.81 Time variations of coolant mass flux and inlet pressure in transient oscillatory subcooled flow boiling for various imposed heat fluxes at (a) q=4.43 W/cm2 and (b) q=8.10 W/cm2 for G=300±10% kg/m2s with tp =20 sec --- 254
Fig 5.82 Time variations of coolant mass flux and inlet pressure in transient oscillatory subcooled flow boiling for various imposed heat fluxes at (a) q=5.02 W/cm2 and (b) q=8.19 W/cm2 for G=400±10% kg/m2s with t
p =20 sec --- 255
Fig 5.83 Time variations of coolant mass flux and inlet pressure in transient oscillatory subcooled flow boiling for various imposed heat fluxes at (a) q=4.43 W/cm2 and (b) q=8.11 W/cm2 for G=300±10% kg/m2s with t
p =30 sec --- 256
Fig 5.84 Time variations of coolant mass flux and inlet pressure in transient oscillatory subcooled flow boiling for various imposed heat fluxes at (a) q=4.88 W/cm2 and (b) q=8.12 W/cm2 for G=400±10% kg/m2s with tp =30 sec --- 257
Fig 5.85 Time variations of coolant mass flux and inlet pressure in transient oscillatory subcooled flow boiling for various imposed heat fluxes at (a) q=4.33 W/cm2 and (b) q=8.12 W/cm2 for G=300±5% kg/m2s with tp =10 sec --- 258
Fig 5.86 Time variations of coolant mass flux and inlet pressure in transient oscillatory subcooled flow boiling for various imposed heat fluxes at (a) q=6.13 W/cm2 and (b) q=8.81 W/cm2 for G=400±5% kg/m2s with tp =10 sec --- 259
Fig 5.87 Time variations of coolant mass flux and inlet pressure in transient oscillatory subcooled flow boiling for various imposed heat fluxes at (a) q=4.28 W/cm2 and (b) q=8.05 W/cm2 for G=300±5% kg/m2s with tp =20 sec --- 260
Fig 5.88 Time variations of coolant mass flux and inlet pressure in transient oscillatory subcooled flow boiling for various imposed heat fluxes at (a) q=6.04 W/cm2 and (b) q=8.78 W/cm2 for G=400±5% kg/m2s with tp =20 sec --- 261
Fig 5.89 Time variations of coolant mass flux and inlet pressure in transient oscillatory subcooled flow boiling for various imposed heat fluxes at (a) q=4.79 W/cm2 and (b) q=8.74 W/cm2 for G=300±5% kg/m2s with tp =30 sec --- 262
Fig 5.90 Time variations of coolant mass flux and inlet pressure in transient oscillatory subcooled flow boiling for various imposed heat fluxes at (a) q=5.96 W/cm2 and (b) q=8.73 W/cm2 for G=400±5% kg/m2s with tp =30 sec --- 263
Fig 5.91 Time variations of coolant mass flux and inlet pressure in transient oscillatory subcooled flow boiling for various imposed heat fluxes at (a) q=4.32 W/cm2 and (b) q=8.10 W/cm2 for G=300±10% kg/m2s with tp =10 sec --- 264
Fig 5.92 Time variations of coolant mass flux and inlet pressure in transient oscillatory subcooled flow boiling for various imposed heat fluxes at (a) q=5.58 W/cm2 and (b) q=8.22 W/cm2 for G=400±10% kg/m2s with tp =10 sec --- 265
Fig 5.93 Time variations of coolant mass flux and inlet pressure in transient oscillatory subcooled flow boiling for various imposed heat fluxes at (a) q=4.30 W/cm2 and (b) q=8.06 W/cm2 for G=300±10% kg/m2s with t
p =20 sec --- 266
Fig 5.94 Time variations of coolant mass flux and inlet pressure in transient oscillatory subcooled flow boiling for various imposed heat fluxes at (a) q=5.47 W/cm2 and (b) q=8.08 W/cm2 for G=400±10% kg/m2s with t
p =20 sec --- 267
Fig 5.95 Time variations of coolant mass flux and inlet pressure in transient oscillatory subcooled flow boiling for various imposed heat fluxes at (a) q=4.28 W/cm2
and (b) q=8.05 W/cm2 for G=300±10% kg/m2s with tp =30 sec --- 268
Fig 5.96 Time variations of coolant mass flux and inlet pressure in transient oscillatory subcooled flow boiling for various imposed heat fluxes at (a) q=5.44 W/cm2
and (b) q=8.07 W/cm2 for G=400±10% kg/m2s with tp =30 sec --- 269
Fig 5.97 Photos of stable subcooled boiling flow at certain time instants for various imposed heat fluxes at ΔTsub= 5oC for (a) G =300 kg/m2s and (b) G =400
xxii
kg/m2s --- 270 Fig 5.98 Photos of transient oscillatory subcooled flow boiling flow at certain time
instants for various imposed mass fluxes for q=6.2 W/cm2 and ΔTsub= 5oC at
G=300±5% kg/m2s with oscillation tp=10s --- 271
Fig 5.99 Photos of transient oscillatory subcooled flow boiling flow at certain time instants for various imposed mass fluxes for q=7.5 W/cm2 and ΔTsub= 5oC at
G=300±5% kg/m2s with oscillation t
p=10s --- 272
Fig 5.100 Photos of transient oscillatory subcooled flow boiling flow at certain time instants for various imposed mass fluxes for q=7.5 W/cm2 and ΔTsub= 5oCat
G=400±5% kg/m2s with oscillation tp=10s --- 273
Fig 5.101 Photos of transient oscillatory subcooled flow boiling flow at certain time instants for various imposed mass fluxes for q=8.9 W/cm2 and ΔT
sub= 5oCat
G=400±5% kg/m2s with oscillation tp=10s --- 274
Fig 5.102 Photos of transient oscillatory subcooled flow boiling flow at certain time instants for various imposed mass fluxes for q=6.1 W/cm2 and ΔTsub= 5oCat
G=300±5% kg/m2s with oscillation tp=20s --- 275
Fig 5.103 Photos of transient oscillatory subcooled flow boiling flow at certain time instants for various imposed mass fluxes for q=7.5 W/cm2 and ΔTsub= 5oCat
G=300±5% kg/m2s with oscillation tp=20s --- 276
Fig 5.104 Photos of transient oscillatory subcooled flow boiling flow at certain time instants for various imposed mass fluxes for q=7.4 W/cm2 and ΔTsub= 5oCat
G=400±5% kg/m2s with oscillation tp=20s --- 277
Fig 5.105 Photos of transient oscillatory subcooled flow boiling flow at certain time instants for various imposed mass fluxes for q=8.9 W/cm2 and ΔTsub= 5oCat
G=400±5% kg/m2s with oscillation tp=20s --- 278
Fig 5.106 Photos of transient oscillatory subcooled flow boiling flow at certain time instants for various imposed mass fluxes for q=6.1 W/cm2 and ΔTsub= 5oC at
G=300±5% kg/m2s with oscillation tp=30s --- 279
Fig 5.107 Photos of transient oscillatory subcooled flow boiling flow at certain time instants for various imposed mass fluxes for q=7.4 W/cm2 and ΔTsub= 5oCat
G=300±5% kg/m2s with oscillation tp=30s --- 280
Fig 5.108 Photos of transient oscillatory subcooled flow boiling flow at certain time instants for various imposed mass fluxes for q=7.4 W/cm2 and ΔTsub= 5oCat
G=400±5% kg/m2s with oscillation tp=30s --- 281
Fig 5.109 Photos of transient oscillatory subcooled flow boiling flow at certain time instants for various imposed mass fluxes for q=8.8 W/cm2 and ΔTsub= 5oCat
G=400±5% kg/m2s with oscillation tp=30s --- 282
instants for various imposed mass fluxes for q=6.1 W/cm2 and ΔTsub= 5oCat
G=300±10% kg/m2s with oscillation tp=10s --- 283
Fig 5.111 Photos of transient oscillatory subcooled flow boiling flow at certain time instants for various imposed mass fluxes for q=7.4 W/cm2 and ΔTsub= 5oCat
G=300±10% kg/m2s with oscillation tp=10s --- 284
Fig 5.112 Photos of transient oscillatory subcooled flow boiling flow at certain time instants for various imposed mass fluxes for q=7.4 W/cm2 and ΔT
sub= 5oCat
G=400±10% kg/m2s with oscillation tp=10s --- 285
Fig 5.113 Photos of transient oscillatory subcooled flow boiling flow at certain time instants for various imposed mass fluxes for q=8.8 W/cm2 and ΔTsub= 5oCat
G=400±10% kg/m2s with oscillation tp=10s --- 286
Fig 5.114 Photos of transient oscillatory subcooled flow boiling flow at certain time instants for various imposed mass fluxes for q=6.0 W/cm2 and ΔTsub= 5oCat
G=300±10% kg/m2s with oscillation tp=20s --- 287
Fig 5.115 Photos of transient oscillatory subcooled flow boiling flow at certain time instants for various imposed mass fluxes for q=7.4 W/cm2 and ΔTsub= 5oCat
G=300±10% kg/m2s with oscillation tp=20s --- 288
Fig 5.116 Photos of transient oscillatory subcooled flow boiling flow at certain time instants for various imposed mass fluxes for q=7.5 W/cm2 and ΔTsub= 5oCat
G=400±10% kg/m2s with oscillation tp=20s --- 289
Fig 5.117 Photos of transient oscillatory subcooled flow boiling flow at certain time instants for various imposed mass fluxes for q=8.9 W/cm2 and ΔTsub= 5oCat
G=400±10% kg/m2s with oscillation tp=20s --- 290
Fig 5.118 Photos of transient oscillatory subcooled flow boiling flow at certain time instants for various imposed mass fluxes for q=6.1 W/cm2 and ΔTsub= 5oCat
G=300±10% kg/m2s with oscillation tp=30s --- 291
Fig 5.119 Photos of transient oscillatory subcooled flow boiling flow at certain time instants for various imposed mass fluxes for q=7.4 W/cm2 and ΔTsub= 5oCat
G=300±10% kg/m2s with oscillation tp=30s --- 292
Fig 5.120 Photos of transient oscillatory subcooled flow boiling flow at certain time instants for various imposed mass fluxes for q=7.4 W/cm2 and ΔTsub= 5oCat
G=400±10% kg/m2s with oscillation t
p=30s --- 293
Fig 5.121 Photos of transient oscillatory subcooled flow boiling flow at certain time instants for various imposed mass fluxes for q=8.9 W/cm2 and ΔTsub= 5oCat
G=400±10% kg/m2s with oscillation t
p=30s --- 294
Fig 5.122 Photos of stable subcooled boiling flow at certain time instants for various imposed heat fluxes at ΔTsub= 10oC for (a) G =300 kg/m2s and (b) G =400
xxiv
Fig 5.123 Photos of transient oscillatory subcooled flow boiling flow at certain time instants for various imposed mass fluxes for q=6.7 W/cm2 and ΔTsub= 10oC at
G=300±5% kg/m2s with oscillation tp=10s --- 296
Fig 5.124 Photos of transient oscillatory subcooled flow boiling flow at certain time instants for various imposed mass fluxes for q=8.1 W/cm2 and ΔTsub= 10oC at
G=300±5% kg/m2s with oscillation tp=10s --- 297
Fig 5.125 Photos of transient oscillatory subcooled flow boiling flow at certain time instants for various imposed mass fluxes for q=8.1 W/cm2 and ΔTsub= 10oCat
G=400±5% kg/m2s with oscillation tp=10s --- 298
Fig 5.126 Photos of transient oscillatory subcooled flow boiling flow at certain time instants for various imposed mass fluxes for q=9.6 W/cm2 and ΔTsub= 10oCat
G=400±5% kg/m2s with oscillation tp=10s --- 299
Fig 5.127 Photos of transient oscillatory subcooled flow boiling flow at certain time instants for various imposed mass fluxes for q=6.7 W/cm2 and ΔTsub= 10oCat
G=300±5% kg/m2s with oscillation tp=20s --- 300
Fig 5.128 Photos of transient oscillatory subcooled flow boiling flow at certain time instants for various imposed mass fluxes for q=8.1 W/cm2 and ΔTsub= 10oCat
G=300±5% kg/m2s with oscillation tp=20s --- 301
Fig 5.129 Photos of transient oscillatory subcooled flow boiling flow at certain time instants for various imposed mass fluxes for q=8.1 W/cm2 and ΔTsub= 10oCat
G=400±5% kg/m2s with oscillation tp=20s --- 302
Fig 5.130 Photos of transient oscillatory subcooled flow boiling flow at certain time instants for various imposed mass fluxes for q=9.5 W/cm2 and ΔTsub= 10oCat
G=400±5% kg/m2s with oscillation tp=20s --- 303
Fig 5.131 Photos of transient oscillatory subcooled flow boiling flow at certain time instants for various imposed mass fluxes for q=6.6 W/cm2 and ΔTsub= 10oC at
G=300±5% kg/m2s with oscillation t
p=30s --- 304
Fig 5.132 Photos of transient oscillatory subcooled flow boiling flow at certain time instants for various imposed mass fluxes for q=8.0 W/cm2 and ΔTsub= 10oCat
G=300±5% kg/m2s with oscillation t
p=30s --- 305
Fig 5.133 Photos of transient oscillatory subcooled flow boiling flow at certain time instants for various imposed mass fluxes for q=8.0 W/cm2 and ΔT
sub= 10oCat
G=400±5% kg/m2s with oscillation tp=30s --- 306
Fig 5.134 Photos of transient oscillatory subcooled flow boiling flow at certain time instants for various imposed mass fluxes for q=9.5 W/cm2 and ΔT
sub= 10oCat
G=400±5% kg/m2s with oscillation tp=30s --- 307
Fig 5.135 Photos of transient oscillatory subcooled flow boiling flow at certain time instants for various imposed mass fluxes for q=6.7 W/cm2 and ΔTsub= 10oCat
G=300±10% kg/m2s with oscillation tp=10s --- 308
Fig 5.136 Photos of transient oscillatory subcooled flow boiling flow at certain time instants for various imposed mass fluxes for q=8.1 W/cm2 and ΔTsub= 10oCat
G=300±10% kg/m2s with oscillation tp=10s --- 309
Fig 5.137 Photos of transient oscillatory subcooled flow boiling flow at certain time instants for various imposed mass fluxes for q=8.2 W/cm2 and ΔTsub= 10oCat
G=400±10% kg/m2s with oscillation t
p=10s --- 310
Fig 5.138 Photos of transient oscillatory subcooled flow boiling flow at certain time instants for various imposed mass fluxes for q=9.7 W/cm2 and ΔTsub= 10oCat
G=400±10% kg/m2s with oscillation tp=10s --- 311
Fig 5.139 Photos of transient oscillatory subcooled flow boiling flow at certain time instants for various imposed mass fluxes for q=6.7 W/cm2 and ΔT
sub= 10oCat
G=300±10% kg/m2s with oscillation tp=20s --- 312
Fig 5.140 Photos of transient oscillatory subcooled flow boiling flow at certain time instants for various imposed mass fluxes for q=8.1 W/cm2 and ΔTsub= 10oCat
G=300±10% kg/m2s with oscillation tp=20s --- 313
Fig 5.141 Photos of transient oscillatory subcooled flow boiling flow at certain time instants for various imposed mass fluxes for q=8.1 W/cm2 and ΔTsub= 10oCat
G=400±10% kg/m2s with oscillation tp=20s --- 314
Fig 5.142 Photos of transient oscillatory subcooled flow boiling flow at certain time instants for various imposed mass fluxes for q=9.6 W/cm2 and ΔTsub= 10oCat
G=400±10% kg/m2s with oscillation tp=20s --- 315
Fig 5.143 Photos of transient oscillatory subcooled flow boiling flow at certain time instants for various imposed mass fluxes for q=6.7 W/cm2 and ΔTsub= 10oCat
G=300±10% kg/m2s with oscillation tp=30s --- 316
Fig 5.144 Photos of transient oscillatory subcooled flow boiling flow at certain time instants for various imposed mass fluxes for q=8.1 W/cm2 and ΔTsub= 10oCat
G=300±10% kg/m2s with oscillation tp=30s --- 317
Fig 5.145 Photos of transient oscillatory subcooled flow boiling flow at certain time instants for various imposed mass fluxes for q=8.1 W/cm2 and ΔTsub= 10oCat
G=400±10% kg/m2s with oscillation tp=30s --- 318
Fig 5.146 Photos of transient oscillatory subcooled flow boiling flow at certain time instants for various imposed mass fluxes for q=8.9 W/cm2 and ΔTsub= 10oCat
G=400±10% kg/m2s with oscillation tp=30s --- 319
Fig 5.147 Mean bubble departure diameters for various coolant mass fluxes for stable subcooled flow boiling (a) and various imposed heat fluxes for transient subcooled flow boiling for G=300±5% kg/m2s and ΔTsub= 5oC with tp=10 sec
xxvi
Fig 5.148 Mean bubble departure diameters for various imposed heat fluxes for transient subcooled flow boiling for G=300±10% kg/m2s and ΔTsub= 5oC with tp=10 sec
(a), 20sec (b) and 30 sec (c) --- 322 Fig 5.149 Mean bubble departure diameters for various imposed heat fluxes for transient
subcooled flow boiling for G=400±5% kg/m2s and ΔTsub= 5oC with tp=10 sec
(a), 20sec (b) and 30 sec (c) --- 323 Fig 5.150 Mean bubble departure diameters for various imposed heat fluxes for transient
subcooled flow boiling for G=400±10% kg/m2s and ΔTsub= 5oC with tp=10 sec
(a), 20sec (b) and 30 sec (c) --- 324 Fig 5.151 Mean bubble departure diameters for various period of mass flux oscillation
for transient subcooled flow boiling for G=300±5% kg/m2s and ΔTsub= 5oC
with (a) q=6.1 W/cm2 and (b) q=7.5 W/cm2 --- 325 Fig 5.152 Mean bubble departure diameters for various period of mass flux oscillation
for transient subcooled flow boiling for G=300±10% kg/m2s and ΔTsub= 5oC
with (a) q=6.1 W/cm2 and (b) q=7.4 W/cm2 --- 326 Fig 5.153 Mean bubble departure diameters for various period of mass flux oscillation
for transient subcooled flow boiling for G=400±5% kg/m2s and ΔTsub= 5oC
with (a) q=7.4 W/cm2 and (b) q=8.9 W/cm2 --- 327 Fig 5.154 Mean bubble departure diameters for various period of mass flux oscillation
for transient subcooled flow boiling for G=400±10% kg/m2s and ΔTsub= 5oC
with (a) q=7.4 W/cm2 and (b) q=8.9 W/cm2 --- 328 Fig 5.155 Mean bubble departure diameters for various amplitudes of the mass fluxes
oscillation for transient subcooled flow boiling for q=7.4 W/cm2 and ΔTsub=
5oC with period=10 sec (a), 20 sec (b), and 30 sec (c) --- 329 Fig 5.156 Mean bubble departure frequencies for various coolant mass fluxes for stable
subcooled flow boiling (a) and various imposed heat fluxes for transient subcooled flow boiling for G=300±5% kg/m2s and ΔT
sub= 5oC with tp=10 sec
(b), 20sec (c) and 30 sec (d) --- 330 Fig 5.157 Mean bubble departure frequencies for various imposed heat fluxes for
transient subcooled flow boiling for G=300±10% kg/m2s and ΔT
sub= 5oC with
tp=10 sec (a), 20sec (b) and 30 sec (c) --- 332
Fig 5.158 Mean bubble departure frequencies for various imposed heat fluxes for transient subcooled flow boiling for G=400±5% kg/m2s and ΔTsub= 5oC with
tp=10 sec (a), 20sec (b) and 30 sec (c) --- 333
Fig 5.159 Mean bubble departure frequencies for various imposed heat fluxes for transient subcooled flow boiling for G=400±10% kg/m2s and ΔTsub= 5oC with
tp=10 sec (a), 20sec (b) and 30 sec (c) --- 334
oscillation for transient subcooled flow boiling for G=300±5% kg/m2s and ΔTsub= 5oC with (a) q=6.1 W/cm2 and (b) q=7.4 W/cm2 --- 335
Fig 5.161 Mean bubble departure frequencies for various periods of mass flux oscillation for transient subcooled flow boiling for G=300±10% kg/m2s and ΔTsub= 5oC with (a) q=6.1 W/cm2 and (b) q=7.4 W/cm2 --- 336
Fig 5.162 Mean bubble departure frequencies for various periods of mass flux oscillation for transient subcooled flow boiling for G=400±5% kg/m2s and
ΔTsub= 5oC with (a) q=7.4 W/cm2 and (b) q=8.9 W/cm2 --- 337
Fig 5.163 Mean bubble departure frequencies for various periods of mass flux oscillation for transient subcooled flow boiling for G=400±10% kg/m2s and ΔTsub= 5oC with (a) q=7.4 W/cm2 and (b) q=8.9 W/cm2 --- 338
Fig 5.164 Mean bubble departure frequencies for various amplitudes of the mass fluxes oscillation for transient subcooled flow boiling for q=7.4 W/cm2 and ΔTsub=
5oC with period=10 sec (a), 20 sec (b), and 30 sec (c) --- 339 Fig 5.165 Mean active nucleation site densities for various coolant mass fluxes for stable
subcooled flow boiling (a) and various imposed heat fluxes for transient subcooled flow boiling for G=300±5% kg/m2s and ΔTsub= 5oC with tp=10 sec
(b), 20sec (c) and 30 sec (d) --- 340 Fig 5.166 Mean active nucleation site densities for various imposed heat fluxes for
transient subcooled flow boiling for G=300±10% kg/m2s and ΔTsub= 5oC with
tp=10 sec (a), 20sec (b) and 30 sec (c) --- 342
Fig 5.167 Mean active nucleation site densities for various imposed heat fluxes for transient subcooled flow boiling for G=400±5% kg/m2s and ΔTsub= 5oC with
tp=10 sec (a), 20sec (b) and 30 sec (c) --- 343
Fig 5.168 Mean active nucleation site densities for various imposed heat fluxes for transient subcooled flow boiling for G=400±10% kg/m2s and ΔTsub= 5oC with
tp=10 sec (a), 20sec (b) and 30 sec (c) --- 344
Fig 5.169 Mean active nucleation site densities for various periods of mass flux oscillation for transient subcooled flow boiling for G=300±5% kg/m2s and ΔTsub= 5oC with (a) q=6.1 W/cm2 and (b) q=7.4 W/cm2 --- 345
Fig 5.170 Mean active nucleation site densities for various periods of mass flux oscillation for transient subcooled flow boiling for G=300±10% kg/m2s and
ΔTsub= 5oC with (a) q=6.1 W/cm2 and (b) q=7.4 W/cm2 --- 346
Fig 5.171 Mean active nucleation site densities for various periods of mass flux oscillation for transient subcooled flow boiling for G=400±5% kg/m2s and
ΔTsub= 5oC with (a) q=7.4 W/cm2 and (b) q=8.9 W/cm2 --- 347
Fig 5.172 Mean active nucleation site densities for various periods of mass flux oscillation for transient subcooled flow boiling for G=400±10% kg/m2s and
xxviii
ΔTsub= 5oC with (a) q=7.4 W/cm2 and (b) q=8.9 W/cm2 --- 348
Fig 5.173 Mean active nucleation site densities for various amplitudes of the mass fluxes oscillation for transient subcooled flow boiling for q=7.4 W/cm2 and ΔTsub=
5oC with period=10 sec (a), 20 sec (b), and 30 sec (c) --- 349 Fig 5.174 Mean bubble departure diameters for various coolant mass fluxes for stable
subcooled flow boiling (a) and various imposed heat fluxes for transient subcooled flow boiling for G=300±5% kg/m2s and ΔT
sub= 10oC with tp=10 sec
(b), 20sec (c) and 30 sec (d) --- 350 Fig 5.175 Mean bubble departure diameters for various imposed heat fluxes for transient
subcooled flow boiling for G=300±10% kg/m2s and ΔTsub= 10oC with tp=10
sec (a), 20sec (b) and 30 sec (c) --- 352 Fig 5.176 Mean bubble departure diameters for various imposed heat fluxes for transient
subcooled flow boiling for G=400±5% kg/m2s and ΔTsub= 10oC with tp=10 sec
(a), 20sec (b) and 30 sec (c) --- 353 Fig 5.177 Mean bubble departure diameters for various imposed heat fluxes for transient
subcooled flow boiling for G=400±10% kg/m2s and ΔTsub= 10oC with tp=10
sec (a), 20sec (b) and 30 sec (c) --- 354 Fig 5.178 Mean bubble departure diameters for various period of mass flux oscillation
for transient subcooled flow boiling for G=300±5% kg/m2s and ΔTsub= 10oC
with (a) q=6.7 W/cm2 and (b) q=8.1 W/cm2 --- 355 Fig 5.179 Mean bubble departure diameters for various period of mass flux oscillation
for transient subcooled flow boiling for G=300±10% kg/m2s and ΔTsub= 10oC
with (a) q=6.7W/cm2 and (b) q=8.1 W/cm2 --- 356 Fig 5.180 Mean bubble departure diameters for various period of mass flux oscillation
for transient subcooled flow boiling for G=400±5% kg/m2s and ΔTsub= 10oC
with (a) q=8.1 W/cm2 and (b) q=9.5 W/cm2 --- 357 Fig 5.181 Mean bubble departure diameters for various period of mass flux oscillation
for transient subcooled flow boiling for G=400±10% kg/m2s and ΔTsub= 10oC
with (a) q=8.1 W/cm2 and (b) q=9.6 W/cm2 --- 358 Fig 5.182 Mean bubble departure diameters for various amplitudes of the mass fluxes
oscillation for transient subcooled flow boiling for q=8.1 W/cm2 and ΔTsub=
10oC with period=10 sec (a), 20 sec (b), and 30 sec (c) --- 359
Fig 5.183 Mean bubble departure frequencies for various coolant mass fluxes for stable subcooled flow boiling (a) and various imposed heat fluxes for transient subcooled flow boiling for G=300±5% kg/m2s and ΔT
sub= 10oC with tp=10 sec
(b), 20sec (c) and 30 sec (d) --- 360 Fig 5.184 Mean bubble departure frequencies for various imposed heat fluxes for