國
立
交
通
大
學
多媒體工程研究所
碩
士
論
文
語 者 識 別 的 研 究
A Study on Speaker Identification
研 究 生:詹子杰
指導教授:陳玲慧 教授
語 者 識 別 的 研 究
A Study on Speaker Identification
研 究 生:詹子杰 Student:Tzu-Chieh Chan
指導教授:陳玲慧 Advisor:Ling-Hwei Chen
國 立 交 通 大 學
多 媒 體 工 程 研 究 所
碩 士 論 文
A ThesisSubmitted to Institute of MultimediaEngineering College of Computer Science
National Chiao Tung University in partial Fulfillment of the Requirements
for the Degree of Master
in
Computer Science
July 2012
Hsinchu, Taiwan, Republic of China
i
語者辨別的研究
研究生:詹子杰
指導教授:陳玲慧 博士
國立交通大學多媒體工程研究所
摘要
近年來,以生物特徵為基礎的認證系統已經廣泛的被應用在我們的日
常生活中,像是智慧型手機、筆記型電腦、門禁管理…等。聲音為人類最
自然、簡單的表現行為,將其應用在以生物特徵為基礎的認證系統中是合
適的。因為不同錄音裝置還有錄音環境的影響,會導致以聲音為基礎的認
證系統辨識率下降。而我們稱這些錄音裝置還有環境的影響叫做通道效應。
在本論文中,我們提出了一個去除通道效應的新方法。基於已被廣泛使用
的梅爾倒頻譜(Mel-scale frequency cepstral coefficients)係數特徵,
使用我們的去除通道效應方法去取得新特徵。然後根據我們取出的新特徵
和高斯混合模型(Gaussian Mixture Models),就可以判斷語者是誰。根據
實驗結果,我們的去通道效應方法擁有比較高的辨識率。
ii
A Study on Speaker Identification
Student: Tzu-Chieh Chan Advisor: Dr. Ling-Hwei Chen
Institute of Multimedia Engineering
National Chiao Tung University
Abstract
In recent years, the biometric-based authentication systems have been widely used in our
life, like the smart-phones, laptops, access control systems, etc. As the most natural,
economical, and expressive behavior, the voice is a suitable characteristic for an
authentication system. But the channel effects that speeches recorded form different record
devices or in a noisy environment make the identification rate decreased. In this thesis, we
provide a new channel effect remover to improve the identification rate. Based on the
Mel-scale frequency cepstral coefficients (MFCC) features, we use our channel effect
remover to extract the new features. According to these new features and Gaussian Mixture
models (GMMs), we can recognize the speaker. Experiment results show that our method has
iii
ACKNOWLEDGMENTS
這篇論文的完成,首先要感謝指導教授陳玲慧博士,在這兩年碩士生涯
中,老師在學業上與生活上給予許多關心和指導,讓我學到的不僅是學業
上的知識,還有更多做人處事的道理。此外,要感謝李建興教授、李遠坤
教授以及李坤龍博士於口試中給予的指導與建議,讓我得到很多寶貴的意
見使整篇論文更加完善。
接著,要感謝實驗室一起生活、一起奮鬥的夥伴們,博士班的學長姐們,
文超、惠龍、俊旻、占和、盈如、芳如以及懷三。畢業的學長宗熹和日前
已經回去中國的學長張駿。以及同屆的同學厚邑、維綱以及學弟志錡、昱
嘉和明昌。因為有大家的陪伴,讓我兩年的碩士生涯過得充實又豐富。另
外要感謝交大其他同學、學長姐和資工系系辦小姐們以及其他很多幫助過
我的人,在我有困難的時候給予我協助。
最後要感謝我最重要的家人,給了我相當好的環境能夠專心於研究上,
讓我無後顧之憂,我才能順利完成本篇研究。謹以此篇論文獻給我的家人,
以及所有關心我、鼓勵我的人,並且再次感謝所有幫助過我的人。
iv
TABLE OF CONTENTS
ABSTRACT (IN CHINESE)……….………. i
ABSTRACT (IN ENGLISH)………. ii
ACKNOWLEDGMENTS (IN CHINESE).…….………iii
TABLE OF CONTENTS………...iv
LIST OF FIGURES………....………vi
LIST OF TABLES……….………..……...………vii
CHAPTER 1 INTRODUCTION………..………..1
1.1 Motivation………...1
1.2 Related Work………..1
1.3 Organization of the Thesis……….3
CHAPTER 2 THE PROPOSED SYSTEM………...4
2.1 Feature Extraction………..5
2.2 Channel Effect Removing………11
2.3 Gaussian Mixture Models Training Method………...14
CHAPTER 3 EXPERIMENT RESULTS………...17
3.1 Feature Dimension and Mixture Number Decision………...18
3.2 Comparison of Different Threshold t
silent………..21
3.3 Comparison of Different Methods.………...…..………...….22
v
CHAPTER 4 CONCLUSIONS AND FUTURE WORKS……….26
REFERENCES………..27
vi
LIST OF FIGURES
Fig. 1. The architecture of the proposed speaker identification system……..………4
Fig. 2. The block diagram of feature extraction………..5
Fig. 3. The effects of the pre-emphasis………...6
Fig. 4. The Hamming window and its effect of applying Hamming window………7
Fig. 5. The Mel-scale band-pass filter……….9
Fig. 6. Identification rates using different dimensions and mixture numbers for CMU PDA Database………....19
Fig. 7. Identification rates using different dimensions and mixture numbers for our database……….………20
vii
LIST OF TABLES
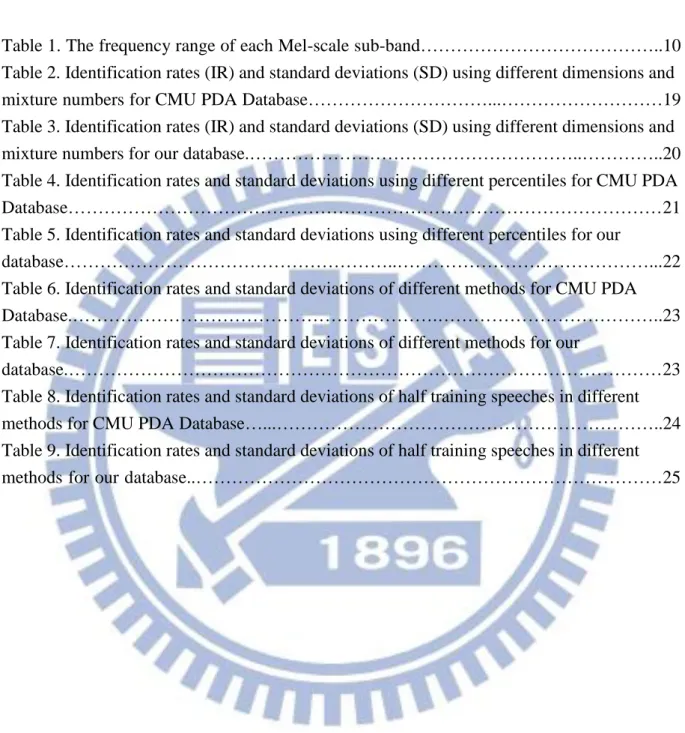
Table 1. The frequency range of each Mel-scale sub-band………..10 Table 2. Identification rates (IR) and standard deviations (SD) using different dimensions and mixture numbers for CMU PDA Database………...………19 Table 3. Identification rates (IR) and standard deviations (SD) using different dimensions and mixture numbers for our database.………..…………..20 Table 4. Identification rates and standard deviations using different percentiles for CMU PDA Database………21 Table 5. Identification rates and standard deviations using different percentiles for our
database………..………...22 Table 6. Identification rates and standard deviations of different methods for CMU PDA Database.……….………..23 Table 7. Identification rates and standard deviations of different methods for our
database.………23 Table 8. Identification rates and standard deviations of half training speeches in different methods for CMU PDA Database…...………..24 Table 9. Identification rates and standard deviations of half training speeches in different methods for our database..………25
1
CHAPTER 1
INTRODUCTION
1.1 Motivation
In recent years, the biometric-based authentication systems have been widely used in our
life, like the smart-phones, laptops, access control systems, etc. A biometric-based
authentication system is a pattern recognition system. Various human physiological or
behavioral characteristics like speech, face, fingerprint, etc, are considered as the different
features used in the pattern recognition system. As the most natural, economical, and
expressive behavior, the voice is a suitable feature for person identification. No two
individuals have the same voice, because their sound production organizations are different
[1]. We will propose a method based on the Mel-scale frequency cepstral coefficients (MFCC)
[2-4] to get voice features of a person. Based on these voice features, we can determine the speaker. We record our lab members’ speech and take the CMU PDA Database from the internet as the database of our experiments.
1.2 Related Work
Speaker identification system can be text-dependent and text-independent. For
text-dependent system, the speaker is required to utter a specific phrase or sentence. But the
2 a text-independent system.
Reynolds et al. [5, 6] first proposed an architecture of the text-independent speaker
identification system using Gaussian mixture models (GMM). In their method, they extract
the MFCC features from speeches, and train each speaker’s GMM using these MFCC features.
To determine a unknown speaker, the MFCC features are extracted from the speaker’s speech.
The extracted MFCC features are inputted to each GMM model to calculate their probability,
then the speech is determined to be spoken by the speaker with the highest probability. In
2000, Reynolds et al. [7] based on [5, 6] to propose a new architecture of the adapted
Gaussian Mixture Models used in the text-independent speaker verification system. In their
new architecture, a huge GMM called universal background model (UBM) is trained. The UBM contains all speakers’ features. For each speaker, they adapt the coefficients of the UBM to get his/her own GMM coefficients. For an input speech, they extract the MFCC
features, then the probabilities of the claimed speaker’s GMM and the UBM are calculated,
finally a threshold is used to determine whether the input speech is from the claimed speaker
or not.
In [5, 6], an input speech can be from different record devices or recorded in a noisy
environment these are called channel effects and make the identification rate decreased. To
solve this problem, Reynolds [8] proposed a method based on the cepstral mean subtraction [9,
3
dependent cepstral mean subtraction to remove the channel effects and to achieve a higher
identification rate.
Hanson et al. [11] proposed delta-spectrum features to represent dynamic features of the
speech spectrum to improve the speech recognition. Chen and Hong [12] proposed a
two-level decision method based on the GMM and the hidden Markov model (HMM) to
achieve a higher identification rate. Ajmera et al. [13] also proposed a Radon and discrete
cosine transform based on the GMM architecture to achieve a higher identification rate.
From the above mentioned methods, we see that the GMM has become the main
approach for modeling speech in text-independent speaker identification and verification
system over the past years. But the channel effects will make extracted features with some
variation which will decrease the identification rate. Our system is based on the MFCC
feature and the GMM, but we provide a new method to remove channel effects to achieve a
higher identification rate than that in [8].
1.3 Organization of the Thesis
The thesis is organized as follows. In Chapter 1, the motivation and previous work are
introduced. In Chapter 2, we will describe our method. In Chapter 3, we will show the
4
CHAPTER 2
THE PROPOSED SYSTEM
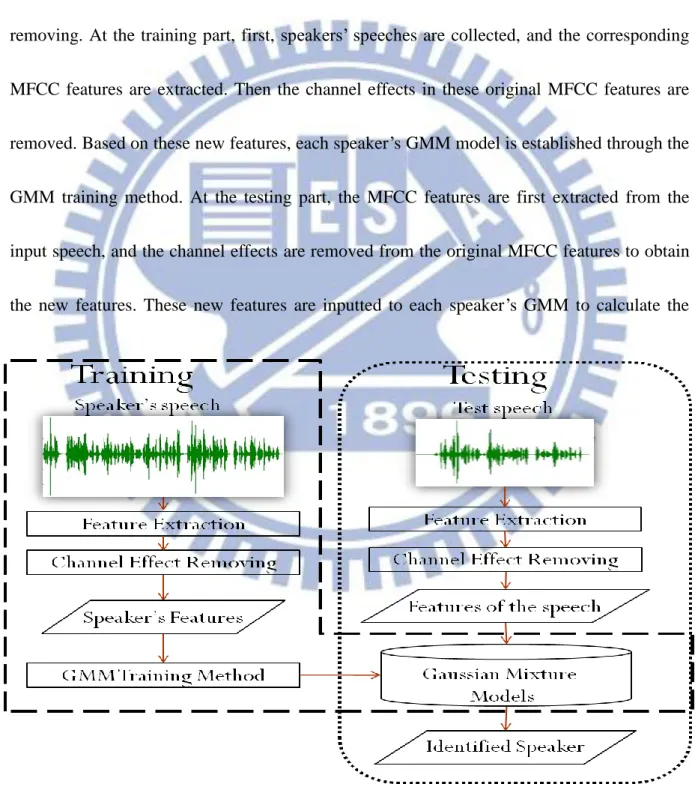
The proposed speaker identification system (see Fig. 1) has two parts: training and
testing. These two parts contain two same components: feature extraction and channel effects
removing. At the training part, first, speakers’ speeches are collected, and the corresponding
MFCC features are extracted. Then the channel effects in these original MFCC features are
removed. Based on these new features, each speaker’s GMM model is established through the
GMM training method. At the testing part, the MFCC features are first extracted from the
input speech, and the channel effects are removed from the original MFCC features to obtain
the new features. These new features are inputted to each speaker’s GMM to calculate the
5
probability. Then the input speech is determined to be spoken by the speaker with the highest
probability.
In the following, we will describe the details of feature extraction, channel effects
removing, and GMM training method.
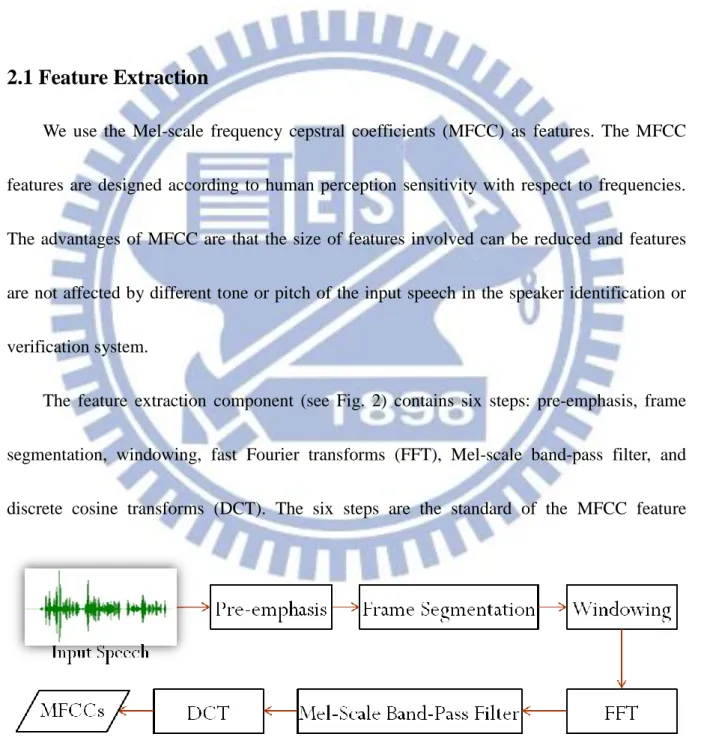
2.1 Feature Extraction
We use the Mel-scale frequency cepstral coefficients (MFCC) as features. The MFCC
features are designed according to human perception sensitivity with respect to frequencies.
The advantages of MFCC are that the size of features involved can be reduced and features
are not affected by different tone or pitch of the input speech in the speaker identification or
verification system.
The feature extraction component (see Fig. 2) contains six steps: pre-emphasis, frame
segmentation, windowing, fast Fourier transforms (FFT), Mel-scale band-pass filter, and
discrete cosine transforms (DCT). The six steps are the standard of the MFCC feature
6 extraction [2-4].
Pre-emphasis
Human’s sound production organization suppresses the high frequency part when they sound. The goal of pre-emphasis is to compensate the high frequency part (see Fig. 3). The
pre-emphasis formula is as below
t t a
t1 , (1)
where
t is the current sample,
t1 is the previous sample of the original waveform, and a is a constant value 0.97. Frame Segmentation
After applying pre-emphasis to an input speech signal, S, the resulting signal S is
segmented into H frames with size 20-30 ms per frame, sliding with a half-frame size rate.
Each frame h
p has P samples (0 pP1,1hH). The following steps are applied Fig. 3 The effect of the pre-emphasis. (a) The input waveform. (b) The waveform after pre-emphasis. (c) The spectrum energy in frequency domain of (a). (d) The spectrum energy in frequency domain of (b).7 to each frame.
Windowing
For each frame h
p , a Hamming window is applied. The Hamming window is used tokeep the continuity of the first and the last points in a frame. The Hamming window and its
effect are shown in Fig. 4. The windowing formula is as below
,~ p p wp
h h
(2)
where the Hamming window w
p is defined as
p 0.540.46cos
2 p/
P1
,0 pP1.w (3)
Fast Fourier Transform
Note that no two individuals have the same voice, because their sound production
organizations are different. The different sound production organizations produce the speech Fig. 4. The Hamming window and its effect of applying Hamming window. (a) Hamming window. (b) The waveform of an input speech without applying Hamming window. (c) The waveform of an input speech with Hamming window applied.
8
signals with different frequencies. Thus the speech signal is transformed into frequency
domain by FFT. The FFT formula is as below
~
2 ,0 1, 1 0
p e k P k A Pp k j P p h h (4)where k is the frequency index.
After applying the FFT, for each frequency index, we can calculate its energy h
k :
k Ah
k 2,0k P1.h
(5)
The energy is called the spectrum energy and the spectrum energy will be used to obtain
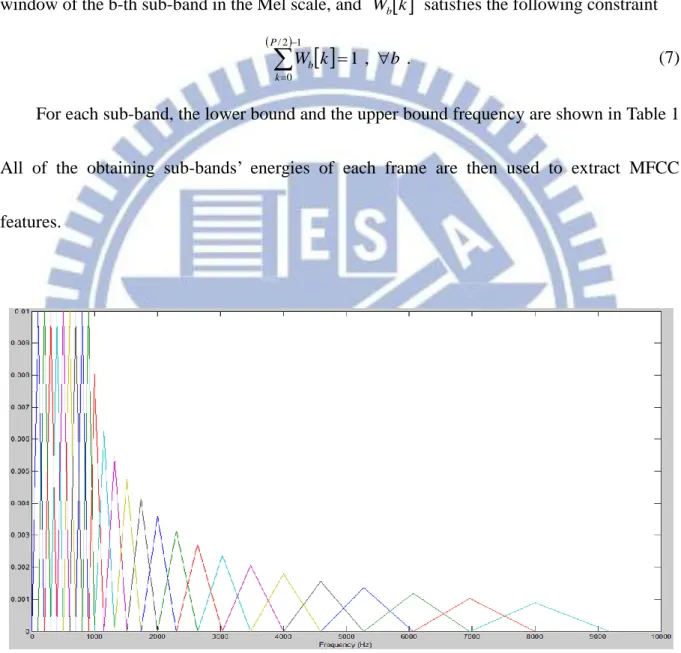
MFCC features through Mel-scale band-pass filter and discrete cosine transform. Mel-Scale Band-Pass Filter
The Mel-scale band-pass filter (see Fig. 5) is designed according to human hearing
perception sensitivity with respect to frequencies. It first divides the frequency domain into
several sub-bands. Each sub-band represents the same human hearing perception sensitivity
level. Human is sensitive to low frequency, but insensitive to the high frequency. The
sub-band’s bandwidth is determined according to the human perception sensitivity with
respect to frequencies; hence the bandwidth is narrow at the low frequency, but broad at the
high frequency. Then, for each sub-band, a triangular window is applied to get the sub-band
energy. The center of each triangular window is the human most sensitive frequency. And the
triangular window of a sub-band is used to avoid the boundary effects of these continuous
9
For frame h , each sub-band’s energy is obtained by the following equation
,1 , 1 2 / 0 B b k W k b E P k b h h
(6)where B is the total number of sub-bands (B is 25 in this thesis), Wb
k is the triangular window of the b-th sub-band in the Mel scale, and Wb
k satisfies the following constraint
. , 1 1 2 / 0 b k W P k b
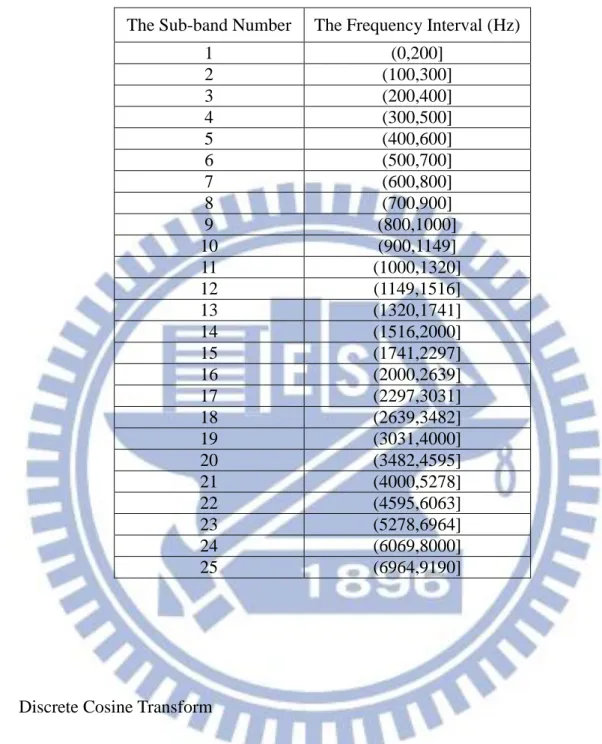
(7)For each sub-band, the lower bound and the upper bound frequency are shown in Table 1.
All of the obtaining sub-bands’ energies of each frame are then used to extract MFCC
features.
10 Discrete Cosine Transform
After obtaining B sub-band energies Eh
b through the Mel-scale band-pass filter, theDCT is applied to these sub-band energies. The purpose of applying DCT is to transform
frequency domain back to time-like domain. The formula of DCT is as the following
0.5 /
log
1
,0 1. cos 1 0 10 ,
B l b E B b l c B b h l h (8)After performing the DCT, for frame h , we can obtain B coefficients called the
The Sub-band Number The Frequency Interval (Hz)
1 (0,200] 2 (100,300] 3 (200,400] 4 (300,500] 5 (400,600] 6 (500,700] 7 (600,800] 8 (700,900] 9 (800,1000] 10 (900,1149] 11 (1000,1320] 12 (1149,1516] 13 (1320,1741] 14 (1516,2000] 15 (1741,2297] 16 (2000,2639] 17 (2297,3031] 18 (2639,3482] 19 (3031,4000] 20 (3482,4595] 21 (4000,5278] 22 (4595,6063] 23 (5278,6964] 24 (6069,8000] 25 (6964,9190]
11
Mel-scale frequency cepstral coefficients. The B coefficients are also called a MFCC feature
vector as shown below
h,0, h,1,..., h,B1
T. h c c c x (9)
Thus, for an input speech, we can obtain H MFCC feature vectors, X ,
x x xH
X 1, 2,..., . Note that in the proposed method, for each frame, we only take L
coefficients to form a L -dimensional feature vector.
2.2 Channel Effect Removing
The speeches recorded from different record devices or recorded in a noisy environment
will have some variation, which makes the identification rate decreased. The variation is
called channel effect.
The traditional method of removing the channel effect is the cepstral mean subtraction [9,
10]. For an input speech, the MFCC feature vectors X (X
x1,x2,...,xH
) are first extracted. Then the mean feature vector mtotal of the MFCC feature vectors is calculated. Foreach MFCC feature vector, the mtotal is subtracted to obtain a new feature vector.
In [8], based on the traditional cepstral mean subtraction, Douglas proposed an energy
dependent cepstral mean subtraction method. For an input speech, the MFCC feature vectors
are extracted and for each frame, the frame total energy is calculated. According to the frame
12
class with the same energy level, the cepstral mean vector is calculated. For each frame, each
MFCC feature vector is subtracted by its corresponding cepstral mean vector.
Here, we propose a new channel effect remover. First, frames are classified into two
types, one is called silent and the other is called real speech. The silent frames are those
frames between speaking sentences or with murmurous speech or without speaker speaking.
The real speech frames are the remaining ones. For these two types of frames, the MFCC
feature vectors are extracted. Then for each real speech frame, the cepstral mean feature
vector of silent frames is subtracted from its MFCC feature vector. The cepstral mean feature
vector of silent frames is considered as the channel effect. Only real speech frames are kept to
do further processes, those silent frames are discarded.
The proposed channel effect remover contains three steps: frame total energy calculation,
the silent frame mean vector calculation, and the silent frame mean vector subtraction. The
details are described as follows: Frame Total Energy Calculation
For each frame, its total energy is evaluated by Eq. (10).
. ˆ 1 0
P k h h k (10)The frame total energy ˆ is used to classify frames as silent frames or real speech h frames.
13 frame; otherwise as a real speech one.
The Silent Frame Mean Vector Calculation
For silent frames, the cepstral mean feature vector msilent is evaluated based on their
MFCC feature vectors , 1 1
silent silent silent H h h silent silent H x m (11)where Hsilent is the total number of silent frames,
silen t
h
x is the MFCC feature vector of a
silent frame.
silent
m is then considered as the channel effect of the input speech. The Silent Frame Mean Vector Subtraction
For the MFCC feature vector,
rea l
h
x , of each real speech frame, it is subtracted by msilent
to obtain a new feature vector
. ~ silent h hreal x real m x (12)
For an input speech, the new feature vectors extracted are denoted as
~,~ ,...,~
, ~ 2 1 x xHreal x X (13)where Hreal is the total number of real speech frames.
Note that threshold tsilent used to classify the silent frames and real speech frames is not
a constant value. It is set according to the frame energy. After calculating each frame energy,
set a percentile of the frame energies as the threshold.
14
2.3 Gaussian Mixture Models Training Method
For a text-independent speaker identification or verification system, we do not limit what
the speaker will say. In [5-8, 12, 13], the Gaussian mixture models (GMM) has been used to
represent speaker’s speech feature distribution.
The GMM can be denoted as
m,μm,m
, m1,2,...,M, where M is the mixture number, m is the weight of the m-th Gaussian distribution p (m 11
M m m ), μm is the mean vector of p , and m m is the covariance matrix of p . mFor a L -dimensional feature vector, xhrea l
~ , we can calculate its probability in the GMM
as below
~
~ , 1
M m h m m hreal p real p x x (14)
~
~
. 2 1 exp 2 1 ~ 1 2 / 1 2 / m h m T m h m L hm real real real
p x x μ x μ
(15)
According to our system architecture, there are two parts: the training part and the testing
part. In the training part, the GMM for each speaker is established. In the testing part, the
speech feature vectors of a speaker are input into each speaker’s GMM to calculate the
corresponding probabilities. Then the speech is considered to be spoken by the speaker with
the highest probability.
In the training part, for each speaker, his speeches are collected as the training speeches.
15
cluster method [5, 14] is used to classify these feature vectors into M classes. Then, the
mean vector, 0
m
μ , and covariance matrix, 0
m
, for class m are calculated. Suppose class m
has n feature vectors. Set m
M i i m m n n 1 0 . The 0 m μ , 0 m and 0 m
are considered as the initial parameters of the speaker’s GMM. Finally, the initial parameters and these training
feature vectors are used to estimate the maximum likelihood model parameters by the iterative
expectation maximization (EM) algorithm [5, 15]. The EM algorithm refines the GMM
parameters iteratively and monotonically increases the likelihood of the estimated model.
The feature vectors,
real
H
x x x
X~ ~1,~2,...,~ , are assumed independent. The probability of X~ in a model is evaluated as below
~
~
. 1
real real real H h h p p X x (16)To avoid a frame with probability very close to 0 dominating the probability, the
probability of a frame less than 1025 is reset to 1025. For implementation convenience, the log-likelihood probability is used as the below formula
~ log
~
. log 1
real real real H h h p p X x (17)In the testing part, for an input speech, the feature vectors for all real speech frames are
extracted and the log-likelihood probability for each speaker’s GMM through the above
methods is evaluated. The speech is determined to be spoken by the speaker Sˆ with the highest probability
16
~ , log max arg ˆ 1i S p i S X (18)17
CHAPTER 3
EXPERIMENT RESULTS
In this chapter, we present the experiment results of our system. The databases used in
our experiments are the CMU PDA Database and our own database from our lab members’
speeches.
The CMU PDA Database is a free database that is released by the Carnegie Mellon
University in the internet. There are 16 speakers in this database. 51 different speeches are
recorded for each speaker. When a speaker speaks, the speech that is spoken by the speaker is
recorded by 5 record devices at the same time. So each speech of a speaker has five record
files, and each speaker has total 255 record files. The sampling frequency is 16000 Hz in this
database. The durations of these speeches are 3-5 seconds.
In our database, we record the speeches from our lab members. There are 8 speakers. For
each speaker, 5 different speeches are recorded. And each speech is spoken 5 times using the
same record device. Thus, each speaker has total 25 record files. The sampling frequency is
44100 Hz in our database. The durations of these speeches are 10-15 seconds.
In our experiments, we take 100 speeches as the training speeches and the remaining 155
speeches as the testing speeches for each speaker in the CMU PDA Database. And the 30 percentile energy is used as threshold tsilent in this database. In our database, we use 10
18
the 20 percentile energy is used as threshold tsilent in our database. For each experiment, we
take different training speeches to do 4 times. The experiment result shows the average
identification rates and the standard deviations.
3.1 Feature Dimension and Mixture Number Decision
For our system, we need to determine the dimension L of the MFCC feature vector and
the mixture number M of the GMM. The identification rate will be affected by different L
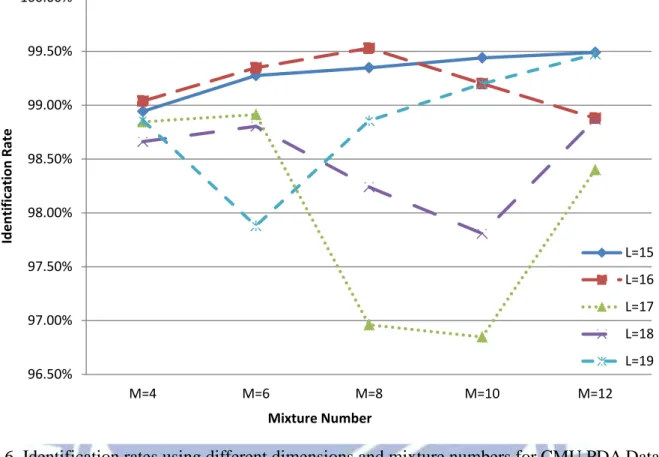
and M . In this experiment, we try different dimensions L15, 16, 17,18, 19, and different
mixture numbers M 4, 6, 8,10, 12. The results of CMU PDA Database are shown in Fig.
6 and Table 2. And the results of our database are shown in Fig. 7 and Table 3.
According to this experiment results, we choose the dimension L16 and the mixture
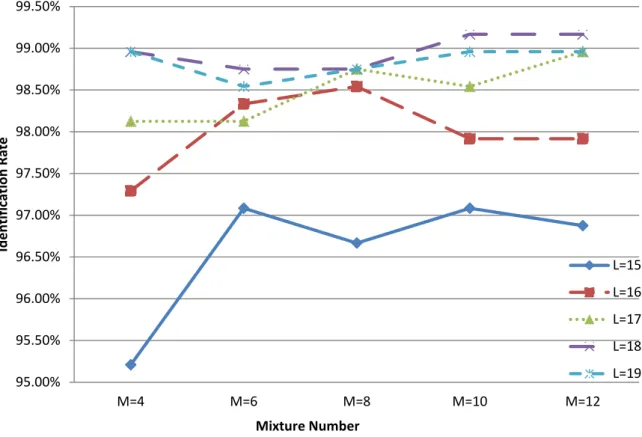
number M 8 with the highest identification rate of CMU PDA Database. In our database,
10 ,
18
M
L and L18, M 12 have the same identification rate. The more mixture
number makes the computing complexity increased; hence we choose the dimension L18
19 96.50% 97.00% 97.50% 98.00% 98.50% 99.00% 99.50% 100.00% M=4 M=6 M=8 M=10 M=12 Ide n ti fi cat ion Rate Mixture Number L=15 L=16 L=17 L=18 L=19
Fig. 6. Identification rates using different dimensions and mixture numbers for CMU PDA Database.
IR(SD) L=15 L=16 L=17 L=18 L=19 M=4 98.94%(0.24%) 99.04%(0.40%) 98.85%(0.55%) 98.66%(0.94%) 98.86%(0.63%) M=6 99.28%(0.28%) 99.35%(0.18%) 98.91%(0.86%) 98.80%(1.39%) 97.88%(1.79%) M=8 99.35%(0.23%) 99.53%(0.25%) 96.96%(2.04%) 98.24%(1.54%) 98.86%(0.94%) M=10 99.44%(0.31%) 99.20%(0.58%) 96.85%(2.27%) 97.81%(2.16%) 99.20%(0.45%) M=12 99.49%(0.34%) 98.88%(0.70%) 98.40%(1.65%) 98.87%(0.97%) 99.47%(0.35%)
Table 2. Identification rates (IR) and standard deviations (SD) using different dimensions and mixture numbers for CMU PDA Database.
20 95.00% 95.50% 96.00% 96.50% 97.00% 97.50% 98.00% 98.50% 99.00% 99.50% M=4 M=6 M=8 M=10 M=12 Id e n tif ic ation R ate Mixture Number L=15 L=16 L=17 L=18 L=19
Fig. 7. Identification rates using different dimensions and mixture numbers for our database.
IR(SD) L=15 L=16 L=17 L=18 L=19 M=4 95.21%(2.49%) 97.29%(2.08%) 98.13%(2.19%) 98.96%(0.80%) 98.96%(0.80%) M=6 97.08%(3.23%) 98.33%(1.80%) 98.13%(2.19%) 98.75%(1.08%) 98.54%(1.42%) M=8 96.67%(2.45%) 98.54%(1.42%) 98.75%(1.08%) 98.75%(1.08%) 98.75%(1.08%) M=10 97.08%(2.59%) 97.92%(1.73%) 98.54%(1.42%) 99.17%(0.68%) 98.96%(0.80%) M=12 96.88%(2.29%) 97.92%(1.73%) 98.96%(0.80%) 99.17%(0.68%) 98.96%(0.80%)
Table 3. Identification rates (IR) and standard deviations (SD) using different dimensions and mixture numbers for our database.
21
3.2 Comparison of Different Threshold
tsilentIn our channel effect remover, we need to set a threshold tsilent to classify frames as
silent frames or real speech frames. The tsilent is set according to the percentile of the frame
energy. Different percentile energies affect the identification rate. In this experiment of CMU
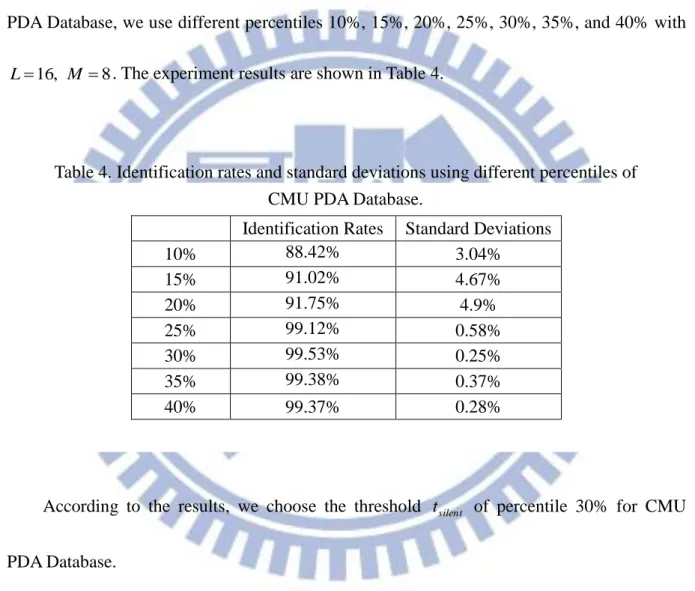
PDA Database, we use different percentiles 10%, 15%, 20%, 25%, 30%, 35%, and 40% with 8
, 16
M
L . The experiment results are shown in Table 4.
According to the results, we choose the threshold tsilent of percentile 30% for CMU
PDA Database.
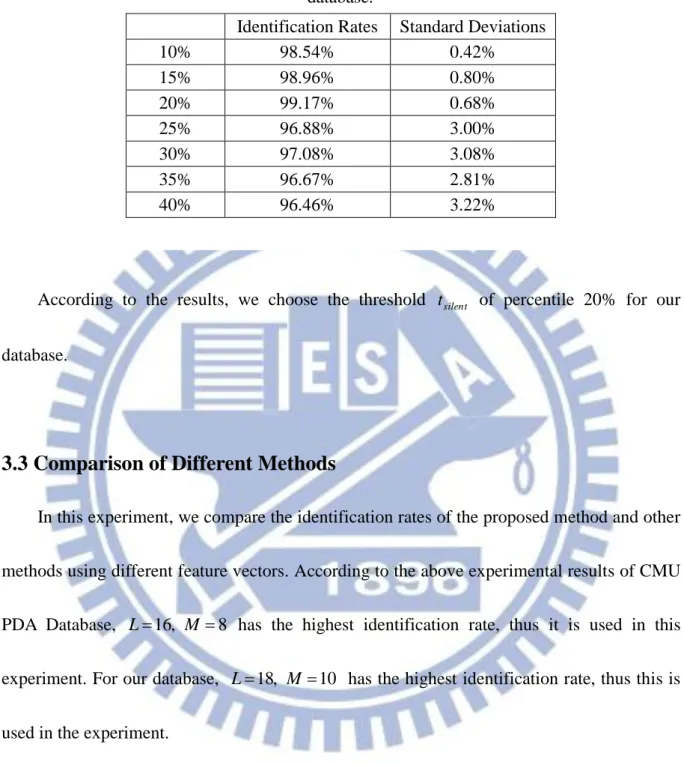
For our database, we also use different percentiles 10%, 15%, 20%, 25%, 30%, 35%, and 40% with L18, M 10. The experiment results are shown in Table 5.
Identification Rates Standard Deviations
10% 88.42% 3.04% 15% 91.02% 4.67% 20% 91.75% 4.9% 25% 99.12% 0.58% 30% 99.53% 0.25% 35% 99.38% 0.37% 40% 99.37% 0.28%
Table 4. Identification rates and standard deviations using different percentiles of CMU PDA Database.
22
According to the results, we choose the threshold tsilent of percentile 20% for our
database.
3.3 Comparison of Different Methods
In this experiment, we compare the identification rates of the proposed method and other
methods using different feature vectors. According to the above experimental results of CMU
PDA Database, L16, M 8 has the highest identification rate, thus it is used in this
experiment. For our database, L18, M 10 has the highest identification rate, thus this is
used in the experiment.
The methods used in this experiment include the proposed method, the MFCC, the
MFCC of the real speech frames, the MFCC using the traditional cepstral mean subtraction
(CMS) [9, 10], the delta-cepstrum of MFCC [11], and the MFCC using CMS of the real
speech frames. The experimental results of CMU PDA Database are shown in Table 6. And Identification Rates Standard Deviations
10% 98.54% 0.42% 15% 98.96% 0.80% 20% 99.17% 0.68% 25% 96.88% 3.00% 30% 97.08% 3.08% 35% 96.67% 2.81% 40% 96.46% 3.22%
Table 5. Identification rates and standard deviations using different percentiles of our database.
23
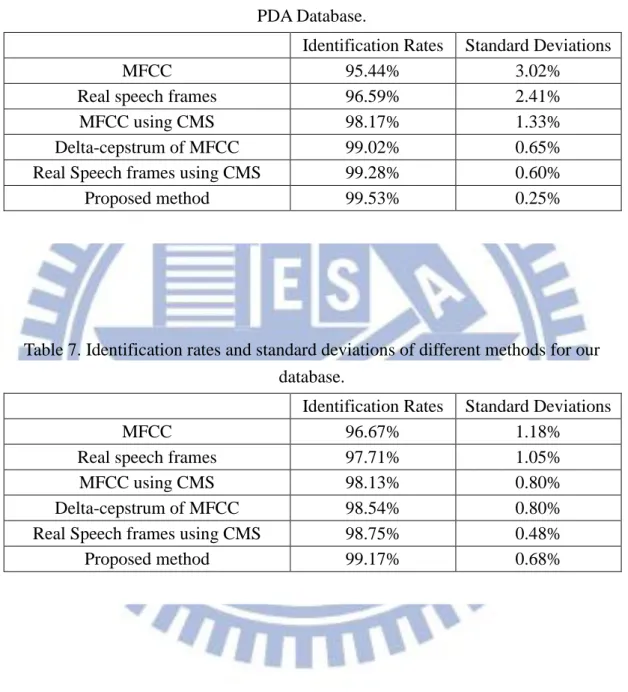
the experiment results of our database are shown in Table 7.
These experiment results show that the identification rate of the proposed method is the
highest, it is increased 4.09% relative to that of using the original MFCC for CMU PDA
Database, and increased 2.5% for our database. And the identification rate of the proposed Identification Rates Standard Deviations
MFCC 95.44% 3.02%
Real speech frames 96.59% 2.41%
MFCC using CMS 98.17% 1.33%
Delta-cepstrum of MFCC 99.02% 0.65%
Real Speech frames using CMS 99.28% 0.60%
Proposed method 99.53% 0.25%
Table 6. Identification rates and standard deviations of different methods for CMU PDA Database.
Identification Rates Standard Deviations
MFCC 96.67% 1.18%
Real speech frames 97.71% 1.05%
MFCC using CMS 98.13% 0.80%
Delta-cepstrum of MFCC 98.54% 0.80%
Real Speech frames using CMS 98.75% 0.48%
Proposed method 99.17% 0.68%
Table 7. Identification rates and standard deviations of different methods for our database.
24
method is increased 0.25% relative to that of using the real speech frames using CMS for
CMU PDA Database, and increased 0.42% for our database. The proposed method has the
highest identification rate and the lowest standard deviations for CMU PDA Database, and
has the highest identification rate for our database.
3.4 System Robustness Testing
In this experiment, we test the robustness of our system. For the two databases, we use
half training speeches to train the GMMs for each speaker. The experiment results are shown
in Tables 8, 9 to compare the mentioned methods with our proposed method.
Identification Rates Standard Deviations MFCC + Delta-cepstrum (L32) 88.43% 2.97%
MFCC 94.22% 4.30%
Real speech frames 95.20% 4.51%
MFCC using CMS 97.12% 1.06%
Delta-cepstrum of MFCC 98.64% 1.21%
Real Speech frames using CMS 98.88% 0.94%
Proposed method 99.16% 0.57%
Table 8. Identification rates and standard deviations of half training speeches in different methods for CMU PDA Database.
25
These experiment results using half training speeches show that the rate of the proposed
method is the highest, it is increased 0.28% relative to that of using the real speech frames
using CMS for CMU PDA Database, and increased 0.31% for our database. The proposed
method has the highest identification rate and the lowest standard deviations for CMU PDA
Database, and has the highest identification rate for our database.
Identification Rates Standard Deviations MFCC + Delta-cepstrum (L32) 42.66% 19.31%
MFCC 95.00% 1.35%
Real speech frames 96.56% 1.20%
MFCC using CMS 97.66% 1.39%
Delta-cepstrum of MFCC 98.13% 0.88%
Real Speech frames using CMS 98.28% 0.60%
Proposed method 98.59% 0.79%
Table 9. Identification rates and standard deviations of half training speeches in different methods for our database.
26
CHAPTER 4
CONCLUSIONS AND FUTURE WORKS
In this thesis, we proposed a speaker identification system. A new channel effect remover
is provided to get a higher identification rate. In the channel effect remover, the channel
effects for speeches recorded from different record devices or in a noisy environment are
decreased. In our system, for each input speech, the MFCC feature vectors are first extracted.
Secondly, these feature vectors are inputted into the proposed channel effect remover to obtain
new feature vectors. Finally, in the training part, these new feature vectors are used to get the
GMM of each speaker, and in the testing part, these feature vectors are inputted to GMM to
determine the speaker. Experiment results show that the proposed method provides a higher
identification rate.
In our channel effect remover, the threshold used to classify frames into silent type and
real speech type is adapted according to different databases. We use a constant percentile of
the frame energies as the threshold for all speeches in the same database. In the future, we
want to develop a method to adapt the threshold according to each speech. With the
automatically adapted threshold, the real speech frames and silent frames can be classified
27
REFERENCES
[1] J. P. Campbell Jr, “Speaker Recognition: A Tutorial,” Proceedings of the IEEE, Vol.85,
pp. 1437-1462, Sep. 1997.
[2] R. Vergin, D. O’Shaughnessy, and V. Gupta, “Compensated Mel Frequency Cepstrum
Coefficients,” 1996 IEEE International Conference on Acoustics, Speech, and Signal
Processing, 1996 (ICASSP ’96), Vol. 1, pp. 323-326, Atlanta, GA. USA, 07-10 May
1996.
[3] S. Molau, M. Pitz, R. Schluter, and Ney H., “Computing Mel-Frequency Cepstral
Coefficients on the Power Spectrum,” 2001 IEEE International Conference on Acoustics, Speech, and Signal Processing, 2001. Proceedings (ICASSP ’01), Vol. 1, pp. 73-76, Salt Lake City, UT., USA, 07-11 May 2001.
[4] J. C. Wang, J. F. Wang, and Y. S. Weng, ”Chip Design of MFCC Extraction for Speech
Recognition,” Integration, the VLSI Journal, Vol. 32, pp. 111-131, Nov. 2002.
[5] D. A. Reynolds, and R. C. Rose, “Robust Text-Independent Speaker Identification Using
Gaussian Mixture Speaker Models,” IEEE Transactions on Speech and Audio Processing,
Vol. 6, pp. 72-83, Jan. 1995.
[6] D. A. Reynolds, “A Gaussian Mixture Modeling Approach to Text-Independent Speaker
Identification,” Georgia Institute of Technology, Ph. D., Aug. 1992.
28
Gaussian Mixture Models,” Digital Signal Processing, Vol. 10, pp. 19-41, Jan. 2000.
[8] D. A. Reynolds, “The Effects of Handset Variability on Speaker Recognition
Performance: Experiments on the Switchboard Corpus,” 1996 IEEE International
Conference on Acoustics, Speech, and Signal Processing, 1996. Conference Proceedings. (ICASSP ’96), Vol.1, pp. 113-116, Atlanta, GA. USA, 07-10 May 1996.
[9] B. S. Atal, “Effectiveness of Linear Prediction Characteristics of the Speech Wave for
Automatic Speaker Identification and Verification,” Journal of the Acoustical Society of
America, Vol. 55, pp. 1304-1312, June 1974.
[10] S. Furui, “Cepstral Analysis Technique for Automatic Speaker Verification,” IEEE
Transactions on Acoustics, Speech and Signal Processing, Vol. 29, pp. 254-272, Apr.
1981.
[11] B. A. Hanson, T. H. Applebau, and J. C. Junqua, “Spectral Dynamics for Speech
Recognition Under Adverse Conditions,” in Automatic Speech and Speaker Recognition:
Advanced Topics, C. H. Lee, F. K. Soong, and K. K. Paliwal, Eds. Boston, MA: Kluwer,
1996.
[12] Y. Chen, and Q. Y. Hong, “Voiceprint Verification Based on Two-Level Decision
HMM-UBM,” 2009 1st International Conference on Information Science and
Engineering (ICISE), pp. 3556-3559, Nanjing, China, 26-28 Dec. 2009.
29
Using Radon and Discrete Cosine Transforms Based Features from Speech Spectrogram,”
Pattern Recognition, Vol. 44, pp. 2749-2759, Oct.-Nov. 2011.
[14] J. A. Hartigan and M. A. Wong, “Algorithm AS 136: A K-Means Clustering Algorithm,”
Journal of the Royal Statistical Society. Series C (Applied Statistics), Vol. 28, No. 1, pp.
100-108, 1979.
[15] A. P. Dempster, N. M. Laird, and D. B. Rubin, “Maximum Likelihood from Incomplete
Data via the EM Algorithm,” Journal of the Royal Statistical Society. Series B