Performance Modelling and Evaluation for the
XMP
Shared-Bus
Multiprocessor Architecture
Chiung-San
Lee and Tai-Ming Parng
Dept. of Electrical Engineering National Taiwan University, R.O.C.Abstract
This paper presents the performance modelling and evaluation of a shared bus multiprocessor, XMP. A key characteristic of XMP is that it employs a special shared bus scheme featuring separate address bus and data bus with split transaction, pipelined cycle (called SSTP scheme). To assist evaluating the architectural alterna- tives of XMP, the features of the SSTP bus scheme as
well as two important performance impacting factors: (1) cache, bus, and memory interferences and ( 2 ) DMA transfer, are modelled. We employ a Subsystem Access Time (SAT) modelling methodology. It is based on a
Subsystem Access Time Per Instruction (SATPI) con- cept, in which we treat major components other than pro- cessors (e.g. off-chip cache, bus, memory, VO) as
subsystems and model for each of them the mean access time per instruction from each processor. Validated by statistical simulations, the performance model is fed with
a given set of representative workload parameters, and then used to conduct performance evaluation for some initial system design issues. Furthermore, the SATPIs of the subsystems are directly utilized to identify the bottle- neck subsystems and to help analyze the cause of the bottleneck.
1: Introduction
A shared-bus multiprocessor system is one of impor- tant class of computer architecture. Such a system con- sists of multiple bus musters, such as processors and DMA controllers, and subsystems, such as shared bus, main memory, and I/O. The design of an multiprocessor system is complex, and prototyping the system is expen- sive. Therefore, multiprocessor systems present an im-
portant opportunity for performance models to contribute to the actual design process.
XMP is a new shared-bus multiprocessor system [SI. It supports a special shared bus scheme which features separated address-bus (Abus) and data-bus (Dbus) with split
transaction,
pipelined (called SSTP bus scheme) cycle [S, 91. Here, "separate" means the Abus and Dbus c m be controlled independently and used by twoJew-Chin Lee, Cheng-Nan Tsai, Kwo-Jean Farn
Lung-Chung Chang, Te-Yu Chung, and Lu-Ping Chen Industrial Technology Research Institude
Hsinchu, Taiwan, R.O.C.
different transactions at the same time. In other words, the Abus is used by the master to send the address and the Dbus is used by the subsystem to transmit the re- turned data. The XMP system has been developed in ITRI.
This paper presents a performance model that we have used to study the feasibility and several issues for the XMP architecture design. The issues that must be consid- ered in the preliminary design of the XMP system in- clude the optimal number of processors connected to a
shared bus, number of memory modules, memory laten- cy, and so on. To obtain accurate prediction results, the performance model takes two important performance im- pacting factors into accounts: (1) the cache, bus, memory interference, (2) DMA transfer.
The performance model we develop for XMP is based on the siibsystem access time (SAT) modelling metliod- ology [ll]. The SAT modelling approach takes a subsys- tem oriented point of view and models the mean access time of each subsystem for the execution of each proces- sor instruction (called Subsystem Access Time Per In- struction, SATPI). The SATPIs of all subsystems in XMP, in addition to being used for predicting perform- ance, can also be used for identifying which subsystem is the bottleneck and then exploring different configura- tions of the subsystem for potential perfonnance improvements.
The rest of this paper is organized as follows. In Sec- tion 2, we introduce the XMP architecture of interest and its bus requests. Section 3 presents the performance mod- el based on SAT modelling. In Section 4, given a set of workload parameters, we utilize the SAT models to pre- dict the system performance for the XMP architecture design and identify the bottleneck for potential perform- ance improvement. Finally, the conclusion is given in Section 5.
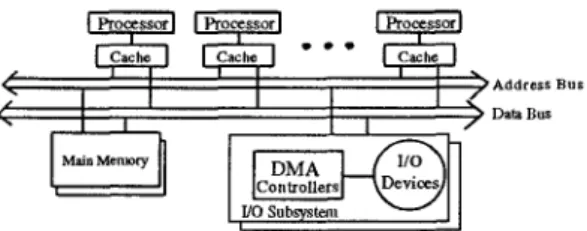
2: The XMP Architecture
The XMP system consists of several processors, main memory subsystems, and 110 subsystems connected to- gether by a shared bus based on a separated address bus
and
a
data bus (Fig.1).
Each processor hasa
local memory (private cache) from which it normally reads and to which it normally writes. However, if the private cache does not contain the necessary data item, a request to the shared bus occurs. The request, which may be a memory read or write, is queued until the shared bus is ready. In such a system with multiple caches, the same information can be shared and may reside in a number of copies in the main memory and in some of the caches. To keep different copies of the shared data consistent, we assume that the cache coherence is maintained through the MESI protocol [SI, and the private cache is of write- back type [5, 81. In addition, the processor executes I/O instructions to obtain I/O status or to program a DMA (Directed Memory Access) controller for dam transfer between main memory and an I/O device.The XMP architecture adopts a two-level cache struc- ture, a very popular architecture for reducing bus traffic
[8, 13, 151. We assume that each processor is equipped with an on-chip cache to reduce the off-chip requests. In
this paper the on-chip cache is referred to as the L1
cache, while the off-chip one as the L2 cache.
Address B U S Data Bus
Fig. 1. The XMP architecture with a separate address bus and data bus
The DMA controller is usually started by using I/O instructions and the following data transfers (referred to
as DMA-transfer request) can proceed without, being in- tervented by the processors. It is reasonable to assume that the processor execution of an application process is completely overlapped with the DMA transfers of anoth- er application process. Therefore, the DMA transfers cause bus and memory interferences to processor's re- quests. For modelling the DMA transfers, we use a pa- rameter, the number of bits of DMA t r a n ~ e r per instruction, to characterize the effect of DMA transfers.
In this study, we consider a special shared bus scheme which features separate address-bus (Abus) and data-bus (Dbus) (i.e., the address-bus and data-bus can be con- trolled or used independently) with split transaction sup- port [4, 8, 91. A split transaction, pipelined (STP) bus should support two types of bus operations: sending the address and receiving or sending Uie data. The split transactions are usually defined by what they do to memory: a memory read transaction transfers data from memory, and a memory write transaction writes the data
to memory. The read transaction is broken into a read- request transaction that. contains the address and com- mand indicating
a
read, anda
memory-reply transaction that contains the returned data. During the memory read split transactions, after the address is sent, the address bus is made available for other processors before the ac- cessed memory data is ready to be returned. A memory write, which requires the processor to send both the ad- dress and data and doesn't require the returned data, is not a split transaction. With separated Abus and Dbus, the shared bus has three operating modes: Abus-only, Dbus-only, and Abus-and-Dbus. The Abus-only mode is used in some bus transactions, such as read-request trans- actions, that transfer only the memory address. The Dbus-only mode is used in memory-reply transactions that respond the returned data to the requester. The Abus-and-Dbus mode is used during main memory write transactions, such as a dirty cache line writeback. In or- der to support the bus with split transaction cycles, in the memory modulean
input queue (IQ) and output queue (OQ) are used to save the incoming requests and returned data. In this bus scheme, the separated Abus and Dbus may serve two different requests at the same time, and can support higher throughput than non-separated bus. An STP bus with the separated Abus and Dbus (called SSTP bus) is yet a newer high-performance bus adopted in the XMP system.For analysis purposes, the following types of requests are included in the analytical model:
red-miss, representing that the processor requests a data which is currently not in its L2 cache and must access memory via the Abus.
memory-reply, representing the process that puts the requested data onto the Dbus when the memory read operation is complete.
invalidation, representing that the processor writes and hits a 'shared state line, and then its L2 cache issues a signal via the Abus to invalidate other cache line copies.
d
writeback, representing that the L2 cache must write back a dirty cache line into the memory via the Abus and Dbus. The memory write operation completes asynchronously and write acknowledgment does not interfere with other bus requests.
DMA-transfer, representing that the DMA
controller transfers data to/from memory via the Abus and Dbus.
In Fig. 2, each ‘arc’ connecting two nodes represents a path along which a request may flow from one node to the other. For a request departing a node from which two or more arcs emanate, the request must choose based on certain probability one of the arcs to pass. The probabili- ty can be obtained according to the frequency distribu- tions of processor instructions from existing literatures [l, 3,7, 13, 15-17] for a wide variety of workloads.
3: SAT
Modelling
of
the
XMP
Architecture
In this subsection, we apply the SAT modelling meth- odology presented in [l 11 for the XMP architecture with SSTP bus scheme. There
are
three major subsystems, namely the L2 cache, shared bus, and memory, in the target model. Performance metrics, such as response time, SATPI, average execution time per instruction, partial utilization, partial queue length, and waiting time, will be derived.3.1: Modelling the target architecture
In the following, let Hi denote the set of all request types that will visit the ith subsystem and B, , a subset of
H, , denote the set of blocking request types that will ac- cess the ith subsystem. We use the notation presented in Table I for the SAT modelling of the target architecture. From Table I and Fig. 2, we can see that the request types of the three subsystems include L1-Miss, Miss, icl,
wb, dma, and rep requests. Two request types, Ll-Miss and icl, will visit the L2 cache; the LI-Miss is a blocking request, because the processor waits until it receives a re- sponse for the instruction that cause the LI-Miss request. There are five request types that visit the shared bus; two of them, Miss and id, will block the requesting master. Three request types, including Miss, wb, and dma, visit the memory subsystem; only the Miss request will cause the requester to be blocked. Note that the i d is a block- ing request to the bus, but a nonblocking one to the L2 cache. This is because no data response is required for the icl request and the internal operation for the L2 cache to update its tag will not cause any delay to the requester.
TABLE I
Notation for SAT Modelling of the Target Architecture Request Types:
+ HLz={Ll-Miss,icl), Hb,={Miss, icl,dma,wb, rep},
H,,={Miss,dma,wb} denote the sets of request types that
visit the L2 cache, shared bus and memory. Ll-Miss, MiAs,
icl, dma, wb, rep are the L1-miss, read-miss, invalidation,
DMA-transfer, writeback, and memory-reply requests. The request of type dmu includes dinuR (DMA read from memory) and dmaW (DMA write into memory).
+ B,={LI-Miss}, B,,={Miss,icZ} and B,nem={Miss} denote the
sets of blocking request types that visit the L2 cache, shared bus, and memory.
Input Parameters:
rz is total number of processors connected to the shared bus.
t,, and tLz are the internal processing time of the processor and the latency of the L2 cache.
t,, and ,,t, are the service time of main memory for read and write requests, respectively. forb, is the shared bus, i.e., Abus or Dbus, arbitration time, when a request arrives at the bus and the bus is ready.
4 todd, is the time for transmitting an address on the Abus, excluding the time for Abus arbitration.
tdah is the time for transmitting data of a cache line size on the Dbus, excluding the time for Dbus arbitration.
pLl and pLz Mm are the probability of L1-cache miss and L2-cache miss, respectively.
pMms is the probability of read-miss requests from an L2
cache including requests of read-to-M line; note that
P M ~ ~ = P L I - M ~ ’ L Z _ M ~ ~ ~ *
4 prep is the probability of memory-reply per instruction; note that it is equal to pLI M ~ Mm. u
pwb i s the probability that-an L2-cache miss results in a
writeback of a dirty cache line.
4 p U L is the probability that a request is an invalidate-cache-line operation.
4 pdm is the probability of DMA transfer per instruction. W e
usepdm, and pdmW to denote the probabilities that the DMA
reads from and writes into the main memory, respectively. The output parameters are def-ined in the development of the equations.
Note that Pdmo =Pd,mR + P d r r s W .
(1) Service Time: As mentioned previously, in general, some subsystems take a fixed length of time to serve an arriving request, while others take a time that depends on the request type as well as on state of the subsystem (whether it is busy or not). As a result, the service time, denoted as St,, of the ith subsystem for a request of type j
is either a given constant value or a function of other model parameters. Most service times of subsystems are deterministic, but some are request- or utilization- dependent. The service times of the processors and L2 cache, which are assumed to be constant, are denoted as
t,, and tu, respectively. The service time of the memory subsystem depends on the type of requests being served. The service time for a read request, denoted as
tmd, includes the latency of input queue, memory, and output queue, while a write request, denoted as tmemw in- cludes the latency of input queue and memory.
The service time of the Abus and the Dbus are depen- dent on their own utilization. The service time of the Abus can be derived as follows: let U,, denote the par- tial utilization of the Abus raised by the requests from a
particular processor. A new request from the other 12-1 processors can be issued during the remaining part of time (when the Abus is not busy), i.e., (l-U&,). Thus,
(nUAb,-UAb,) is the partial utilization of the Abus taken to serve the requests from other processors. The proba- bility that the Abus is busy when a request from a par- ticular processor arrives is (nUAb,-UAb,)l(l-UAbzu).
A bus tenure is a duration that a master is controlling (using) the bus. At any point during a master's bus ten- ure, the bus arbitration process can proceed concurrently
with the data transferring process. We approximate the arbitration time of a request's bus service tenure by con- sidering it to be proportional to the probability that bus is ready when a request arrives. Therefore, the mean time for transferring an address on Abus, SAbur, is
Similarly, the mean time for transferring a cache line on Dbus, SDb,, is
n UDbu.r-UDbu.r l-uDbus
SDbW = (1
-
tarbi -k tdakz.NOR that the equations of partial utilizations UAbw and
UDb, will be derived and presented later.
(2) Response Time: The mean response time of a type j
blocking request to the ith subsystem, R,, is dependent on the waiting time caused by those requests that are cur- rently queued or being served in the subsystem and on the service time of the blocking request itself and can be estimated as
R , = WGj,,
+
Si,j; i E {L2, bus, mem}, j E Bi (1)where
c
Wlj,,
is the mean waiting time of a blocking request of type j at the ith subsystem caused by all re- quest types in Hi.(3) Subsystem Access Time Per Instruction: The subsys- tem SATPI of the ith subsystem is the sum of the re- sponse time of those blocking requests from a particular processor and can be represented as
k E Hi kE Hi
T
= p j Ripj i E {L2, bus, mem} ( 2 )j E B i
where pi denotes the probability of type j requests.
(4) Averuge Execution Time Per Instruction: The average
execution time per instruction seen by each processor equals to the sum of processor internal processing time, i.e., tCpu, and all SATPIs and can be expressed as
T,, = t,, + T , . (3)
iE {L2,bus,mem}
(5) Partial Utilization: The partial utilization of the ith subsystem by any request of type k from a particular pro- cessor, U,,, is the ratio of the service time by the requests over total elapsed time, T,,, and can be estimated as
k~ HI where pk is the probability that the request is of type
k;
S,,, is the ith subsystem service time for the re- quest of type k.The partial utilization of the ith subsystem by a par- ticular processor is U, and can be estimated as
U,, = pk& 1 Texe;
i E
(U,
bus,meml,
m 7
ui=
Ui,e i E {L2, bus, mem)k E Hi
(6) Partial queue length: The average partial queue length of the
ilh
subsystem includes the average number of requests that is currently being served by the subsys- tem. Therefore, the mean partial queue lengths of re- quests of type k at the ilh subsystem, Qik, by a particular processor can be approximated byQik =p,( Wi,kr+Si,k)/ Texe; i E {L2, bus, mem), kE Hi.
(7) Wuiting Time: An arriving request at the ith subsys- tem will wait for the mean residual service time, i.e., mean remaining service time, of the request in service, plus one mean subsystem service time for every other re- quests in the queue when it arrives. We assume that the service time at each subsystem is deterministic;
so
the re- sidual service time is approximately one-half its service time. Thus, the waiting time of a request of type j at the ith subsystem caused by a request of type k, for i E {bus, mem], and j,keHi,
isW i j , k =
{
<n-l>((Qi,k- sj,k+ui,k sj,kn>; i f j = k
n
((e,,-
Ui,,) Si,k+Ui,k Si,,D); otherwiseThe L2 cache must serve the requests from its local processor and from the shared bus. The requests from the shared bus, such as invalidation, takes priority in the L2 cache. So if an invalidation request from the shared bus arrives concurrently with a read request from the proces- sor, the bus request is served h t . In other words, the
W,,-Mbs,,, is the average: waiting time in the L2 cache of
a request from its local processor and their computation formula can be derived a s follows:
WL2LI_Mb~,icl=tL2picl
E
Prob. [CPU succeeds on kth trial]m kl
where the probability, P,,, tliat a processor successful- ly accesses its L2 cache is given by
Note that the derivation of Wu,U-Mirs.icr does not follow the Equation (7), because the L2 cache favors the shared bus requests.
Pjuccess= (1 - picl>"-'*
(8) Subsystem Utilization: The utilization of one L2 cache (U,) is the sum of the time fraction that the L2 cache takes to serve the requests from the processor and from the shared bus. It is represented as
The total utilization of Abus and Dbus are equal to
n* UAbw and n* UDbur, respectively.
The t o d utilization of main memory is estimated
as
The processor utilization can be obtained by tcpJTexe.U,= uL2p,-Miss+ uL2,ic1*
',em= n(um~Mirs'Umemwb -k mem,dr~R + u m m , d m d *
(9) Throughput: The processor throughput and system
throughput are measured as million instruction per se- cond (MIPS) and can computed by UTexe and n/T,,,,
respectively.
(IO) Bottleneck Analysis: In addition to providing per- formance evaluation results, the other important applica- tion of the SAT modelling melhodology is to identify the potential causes of bottlenecks existing in a complex multiprocessor system. Based on the SAPTI concept, the SAT modelling methodology has an important advantage over other modelling approaches in that it tells the archi- tecture designer which of the various subsystems is sig- nificant in determining the system performance. Specifically, from Equation (3), we observe that the rela- tive contribution of the various SATPIs to the overall system throughput is immediately obvious.
In other words, a subsystem with the longest SATPI is the one that limits processor performance and creates a bottleneck to the system. Particularly, a large difference between subsystem SATPIs is a symptom indicating ex- istence of a bottleneck. Since every multiprocessor sys- tem has at least one bottleneck, we can find that the subsystem b is a bottleneck, if
We can continue to identify the cause the bottleneck of
the bth subsystem based on the Equation (1) and (2). The
Tb is composed of many time components including the waiting time of each type of requests arriving at the bth subsystem and the service time. We can find the maxi- mum term of these components and identify the type of request that causes the bottleneck.
We have developed statistical simulations using SES/workbench [ 141 to obtain average execution time
T b = 1nm {Tu, Tbw, Tm,-}.
per instruction and validate tlie results from our analyti- cal model. By comparing the results obtained from both analytical and simulation models, we find that in about
86% of all cases the magnitude of the percentage differ- ence in average execution time per instruction from the two techniques is less than 3%. We can also see that in less than 1% of all cases the magnitude of the percentage difference is greater than 5%.
4: Performance Analysis of the XMP System
In this section, we conduct performance evaluation for the target architecture using the SAT modelling results. We will describe tlie workloads for feeding the SAT models and discuss in detail Ihe performance prediction and bottleneck identification for the target architecture. Also, we will explore the impact of the following per- formance influencing factors: memory latency, cache size, data bus width, as well as DMA transfer.4.1: Workloads for the analytical Model
We take most of the workloads for the SAT model of
the target architecture from existing literatures. Many pa- pers [I, 3-4,743, 13, 15-18] published some architecture- dependent parameters. For examples, Przybylski [ 131 collected a variety of miss rates for various two-level cache size/structures; Akella and Siewiorek [3] measured the number of bits of DMA transfer per instruction ex- ecuted by a CPU from VAXl1/780 system. To provide input parameters to the SAT modelling, we obtain the values of pMkS, pzcl, pwb, and ph, from these papers that are representative of the workload for which we want to predict system throughput.
The cache miss rate and DMA transfer rate per instruc- tion are also important workloads. In general, the cache miss rate is inversely proportional to the cache size in the target architecture. Based on the results of Przybylski's collected, the L2 cache size of 256K bytes size has an average cache miss rate of 1%. We assume that the num- ber of bits of DMA transfer per instruction is in tlie range of 1 to 8 bits and the block data size per DMA transfer is based on the cache line size. In the case of cache line of
32, bytes, the probability of DMA transfer, i.e., p-,
ranges from U512 to 1/32.
4.2:
Performance Prediction and Bottleneck
Identification
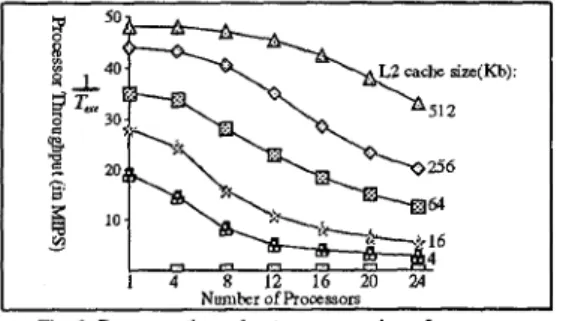
Our SAT modelling can serve to predict the processor throughput and identify potential bottlenecks. We obtain the processor throughput by computing the average
execution time per instruction,
as
the number of proces-sors
and L2 cache size are varied. Fig. 3 shows these re- sults. For a system with 8 processors and 256-Kbyte L2 cache, the processor throughput and system throughput are about 40 MIPS and 320 MIPS, respectively. Howev- er, as we can see, the processor throughput decreases with the increase of number of processors. In other words, there exists a bottleneck causing performance degradation in the target architecture.7
r
soP
8 L 4 0$
Tu 304
1
208
lo c; 1 4 8 12 16 20 24 Nunlher of RocessorsFig. 3. Processor throughput versus number of processors
For bottleneck identification, we compute the SATPI for each subsystem. Fig. 4 shows the results with different number of processors, assuming that 256-Kbyte L2 cache and 120-nsec memory are used. In each case, the SATPI of memory is the largest among these subsystems includ- ing the L2 cache, shared bus, and memory. In addition, since the increase of the SAPTI in the memory subsys- tem with varying number of processors keeps being the largest, the bottleneck must be present in the memory subsystem. 1 4 8 12 16 20 24 1 0 2'0 3 0 4 0 S O N .
Avemgc Execution Time Per Instruct" T,x, Fig. 4. The SATPh versus nunher of processors
-
(with L2 cache size of 256 Kbytes and memory latency of 120 nsec) In addition, we can estimate an adequate number of
processors in the target system based on processor uti- lization. The value of per processor utilization (tqJ T J
can be obtained according to the results shown in Fig. 4. For a 4-processor system, the per processor utilization is equal to 65%. When the processor's number is more than 12, the per processor utilization is less than 50%. Based on the suggestions of Jain [lo], the optimum value of uti- lization lies in the range from 50% to 75%. Therefore, the adequate number of processors for the given set of
workload parameters is 12 or sinaller.
4.3:
Impact of Memory Latency and Number
of
Memory Modules
In this subsection, we apply the SAT models of the memory subsystem in analyzing the bottleneck in the memory subsystem and exploring the impacts of memory latency and number of memory modules on system throughput.
M m Memory Latency
Wahng b e caused by other processor requests
/
Watng b e c a u s e d by DMA requests 4 8 I2 1 6 2 0 T m m 2 4 n s ]Fig. Sa. The SATPI coniponents of the nieniory subsystem (with memory latency of 120 ns and one memory modules)
The SATPI of the memory subsystem
(T,,,)
can be used to find the cause of the bottleneck which has been identified to exist in the memory subsystem in the pre- vious subsection. Based on the types of memory re- quests,T,,,
can be decomposed into three parts: main memory latency, the waiting time caused by DMA re- quests, and the waiting time caused by other processor requests. Fig. 5a shows the values ofTmem
and its compo- nents versus various number of processors. It shows that the SATPI is primarily due to tlie memory waiting timeif the number of processors is larger than 8. In other words, too many requests waiting in the memory subsys- tem is the cause of the bottleneck. This means that there is a mismatch between {he memory service rate and the memory request rate.
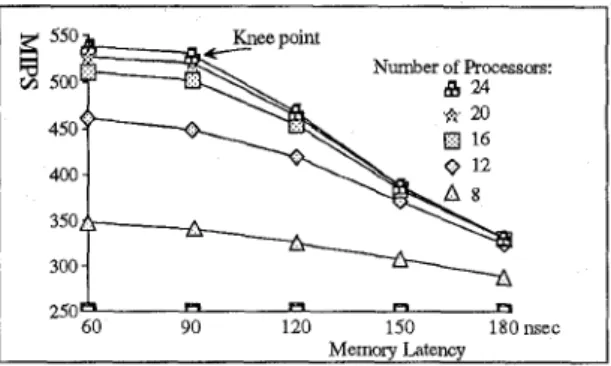
The bottleneck in the memory subsystem can be re- moved either by using faster memory chips to increase memory service rate or by using multiple memory mod- ules to distribute the memory requests into the modules. Thereby, the memory waiting time is reduced and the performance of the memory subsystem can be improved. Fig. 5b and 5c show the system throughput impact of memory latency and number of memory modules,
re-
spectively. From Fig. 5b, we can see a knee point at memory latency of 90 nsec. Before the knee, the throughput does not increase significantly. This is the point beyond which the hhroughput decreases rapidly as a function of memory latency. As the knee of the through- put curve is considered the optimal operating point [131, therefore, the main memory latency of 90 nsec under our workload is a good choic~e.I 12 16 20 2 A . 550 Number of Processors:
z
500 450 400 350 300 1 93 I O 77 I.,d0.22 250A R R R U 60 90 120 150 180 nsec Memory LatencyFIg. 5b. System thoughput versus memory latency
550 Nuniber of Processors:
350
300
250
1 2 3 4
Number of Memory Modules
Fig. 5c. System throughput versus nuniber of memory modules
(with memory latency of 120 nsec)
From Fig. 5c, using two memory modules can improve the system throughput. However, the curves indicate that no further performance improvement can be achieved for number of memory modules greater than two. Fig. 5b and 5c also imply that even if we minimize the memory access time, the system throughput may still be limited because of other types of subsystem access delays, such
as bus delay. (According to Fig. 4, the shared-bus access delay is the second factor that reduces performance, and will be further investigated in detail later.) Fig. 5d shows the SATPI of the memory by using the 90-nsec memory and two memory modules. By comparing Fig. 5a with 5d, we find that using high speed memory and multiple memory modules
are
effective methods for improving the performance in the memory subsystem.,
MenisyLate;;,
Waiting time caiised by other processor requests
1
-a
/Waryg (mnie causedby UlcDMArequests1 2 T 3-=
Fig. 5d. The SATPI coniponents of the nieniory subsystem (with nieniory latency of 90 nsec and two memory niodules)
4.4:
Exploring the cause
of
bottleneck in shared
bus
To find the factor in the shared-bus subsystem that de- grades the system performance, we decompose the SAT- PI of the shared bus, Tbm, into two components: the waiting time and the holding time. The bus holding time is the sum of arbitration time and addresddata transfer- ring time. Fig. 6a shows the results. Since the arbitration time is overlapped with bus service tenure, increasing the number of processors results in decrease in the bus hold- ing time. Furthermore, Fig. 6a also shows that the wait- ing time on the Dbus is longer than on the Abus, because the time of transferring a cache line on the Dbus usually takes a longer time than the time of transferring an ad- dress on the Abus. In other words, the SATPI of the shared bus is more sensitive to the Dbus holding time than to the Abus. Therefore, in the shared-bus subsystem, the Dbus with a long waiting time is one of the major factors that drops the processor throughput.
4: 16
8 24
E
201 2 '4 4, 5 6 7 l n s e e Fig. 6a. Shared bus access tinie (Dbus width of 8 bytes)
4.5:
Impact of
DMA
transfer
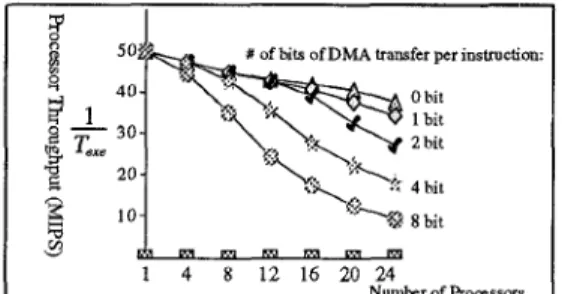
Another special consideration in our performance model is the impact of DMA transfer. Fig. 7 shows the evaluation results. It is clear that if the number of bits of DMA transfer per instruction is less than 1 bit (i.e., less
than 1 Mbit/sec per MIPS following Amdahl's Law [l]),
the system throughput remains almost constant for up to 12 processors. As the number of bits of DMA transfer per instruction is increased up to 8 bits (i.e., 1 Mbyte/sec for 1 MIPS following the results measured from VAX machine by Akella and Siewiorek [3]), the system throughput drops about 45%. In addition, Fig. 5a also shows the impact of DMA transfer on memory access time; one bit of DMA transfer per instruction is assumed. If the number of processors is less than 8, the memory access time impact of DMA transfer is negligible. For 16 processors system, the effect of DMA transfer on the SATPI of the memory subsystem is significant (increase
to about 16.5%). For applications which require higher DMA transfer rate than 1 bit per instruction, the impact of DMA transfer on the SATPI of memory will increase.
Thus we believe that the impact of DMA transfer for most applications will be significant and should be in- cluded in the performance model of a shared bus multi- processor system.
I
I
1 4 8 12 16 20 24
Numkr of Rocrssors Fig. 7. Iinpact of DMA transfer one processor throughput
5: Conclusion
We have developed an analytical model based on sub- system access time (SAT) modelling approach for the XMP shared-bus multiprocessor system. The system is
composed of bus masters, such as processor and DMA
controller, and subsystems, including cache, bus, and memory. A key characteristic of the target system, name- ly the support of separate address-bus (Abus) and data- bus (Dbus) with split transaction, pipelined cycle, is modelled. Furthermore, several performance factors: cache interference, bus interference, memory interfer- ence, and the impact of DMA transfer are also consid- ered in the model. The SAT modelling can facilitate computing the average subsystem access time per in- struction (SATPI) of all subsystems and evaluating some initial system design issues. By comparing these SATPIs, we can easily identify the subsystem having the longest SATPI to be the bottleneck and then explore potential improvements of system performance.
Using the analytical model, we have explored the im- pact of DMA transfer on system performance. We find that the effect of DMA transfer drops the system throughput about up to 45% according to the workloads measured by Akella and Siewiorek from VAX machines
[3]. Consequently, it is essential to include the impact of DMA transfer in a performance model.
We have also explored the application of the SATPI of the shared bus subsystem. Result shows that the shared bus performance is quite sensitive to the Dbiis delay (more than the Abus delay).
References
[ l ] T. Adams and R. Zimmerman, "An analysis of 8086 in- struction set usage in MS DOS programs," Proc. Third Symposiunt on Architectural Support f o r Programming
Language and Oper. Syst., pp. 152-161,1989.
[2] G. M. Amdahl, "Validity of the single processor ap-
proach to archiving large scale computing capability,"
American Fedemtion! of Infoimance Processing Soci-
eties, pp. 483-485, 19167.
J. Akella and D. P. Siewiorek, "Modeling and measure- ment of the impact of input/output on system performan- ce," Proc. of the 18th .Annu. Symp. Comput. Architecture,
M. C. Chiang and G. S. Sohi, "Evaluating design choices for shared bus multiprocessors in a throughput-oriented environment," IEEE trms. Comput., vol. 14, no. 3, pp. 297-317, Mar. 1992.
A. L. Decegama, "The Technology of parallel processing
- parallel processing architectures and VLSI hardware, volume I," Prentice-Hull In.ternation.ul Editions, 1989.
P. J. Denning and J. P. Buzen, "The Operational analysis of queueing network model," ACM Comput. Surveys, S . J. Eggers and R. H. Katz, "A Characterization of shar- ing in parallel programs and its applicability to coheren- cy protocol evaluation," Proc. of the 15th Annu. Symp.
Comput. Architecture, pp. 373-382, 1988.
[8] J. L. Hennessy and D. A. Patterson, "Computer architec- ture a qualitative approach," Morgan Kuufmann., 1990. [9] Intel XA-MP Architccture Specification ver 3.0, July
1991.
[lo] R. Jain, "The Art of computer systems performance analysis," John Wiley ,& Sons, 1991.
[ l l ] C. S. Lee and T. M. Parng, "A Subsystem-oriented per- formance analysis methodology for shared-bus multipro- cessors," NTUEE Tech. Report, Sep. 1993.
[12] S . Leutenegger and M. K. Vernon, "A mean-value per- formance analysis of ar new multiprocessor architecture,"
in Proc. ACM SIGMETRICS Col$ Measurement and Modelling of Comput. Syst., May 1988.
[13] S. A. Przybylski, "Cache and memory hierarchy design: a performance-directed approach," Morgan Kuuj?", 1990.
[ 141 SES/workbench User's manual and Reference's Manual, Jan. 1991.
[15] R. T. Short and H. M. Levy, "A Simulation of two-level caches," Proc. of the 15th Annu. Syrnp. Comput. Archi-
tecture, pp. 81-88, 1988.
[16] J. P. Singh, H. S . Stone, and D. F. Thiebaut, "A Model of worMoads and its use in miss-rate prediction for fully as- sociative caches," IEEE Trans. Comput., pp. 81 1-825, July 1992.
[17] T. F. Tsuei and M. K. Vernon, "A Multiprocessor bus design model validated by system measurement," IEEE
Truns. Parallel und Lk~tributed Systems, vol. 3, no. 6,
pp. 712-727, Nov. 1992.
[18] M. K. Vernon, E. D. Lazowska, and J. Zahorjan, "An Accurate and efficient performance analysis technique for multiprocessor snooping cache-consistency proto- cols," Proc. of the 1Sih Annu. Symp. Cotnput. Arclzitec- ture, pp. 308-315, June 1988. [3] pp 390-399, 1991. [4] [5] [6] vol. 10, pp. 25-261, St:p. 1978. [7]