An exploratory study of female directors’ constraint on
real earnings management
女性董事抑制實質盈餘管理之探討
Ling-Ling Chang1
Department of Accounting, Ming Chuan University Yue-Duan Guan
Department of Accounting, Ming Chuan University Daniel F. Hsiao
Department of Accounting, Labovitz School of Business and Economics, University of Minnesota Duluth
Abstract: This paper aims to examine whether female directors affect firms’
earnings management activities. In recent years, gender diversity has emerged as a prominent topic of discussion in corporate governance. Most prior research into female directors’ relationships with regard to earnings management has primarily focused on accrual-based earnings management (AEM). It has been reported that post-SOX firms switched from accruals-based to real earnings management (REM) methods. Our study uses both earnings management proxies: the absolute value of discretionary accruals in AEM, and various proxies of REM. Empirical results from our Taiwanese sample indicate that firms with female directors have significantly less real earnings management, and the association is particularly driven by lower levels of reduction in discretionary expenditure, which remained unchanged even during the financial crisis of 2008-2010. However, we find a marginal mitigating effect on AEM only when the firm has a greater proportion of female directors. This study not only expands the literature on earnings management practice in emerging markets, but also provides policy implications for board gender diversity.
Keywords: Board gender diversity, accrual-based earnings management, real
earnings management.
1
Corresponding author: Ling-Ling Chang, Department of Accounting, Ming Chuan University, 250 Zhong Shan N. Rd., Sec. 5, Taipei 111, Taiwan, E-mail: [email protected].
1. Introduction
Since the global financial crisis of 2008, the inclusion of female directors in the boardroom has received great public attention. Previous studies show men generally have higher risk tolerance than women (Halko, Kaustia, and Alanko, 2012); however, female directors, owing to their more conservative and prudent nature, often benefit companies by attaching greater emphasis to risk management and control. Behavioral literature shows women are less likely to be overconfident, and are therefore more thorough when seeking and questioning information during the decision-making process (Graham et al., 2002).
Due to the recognized need for more women in the boardroom, several European Union (EU) countries have mandated that European firms increase their numbers of female directors (Brennan, 2006; Brennan and Solomon, 2008; Collier, 2008; Farrell and Hersch, 2005; Huse, Nielsen, and Hagen, 2009; Terjesen and Singh, 2008). For example, as early as 2003, Norway stipulated that the proportion of female directors in a firm should increase to at least 40 percent, and maintained that its government authority had the right to dissolve a company
that failed to meet this requirement for two consecutive years.2 Based on these
facts, there appears to be a strong consensus that women should be well represented and included as directors. However, scholars are also critical that firms choosing female directors often have to find independent directors, and therefore mandatory gender quotas may result in “excessive board independence” for some countries, like in Norway. This situation indicates that firm value decreases when incoming female directors don’t have relevant director skills (Bøhren and Staubo, 2014, 2016). In addition, Low, Roberts, and Whiting (2015) find more gender diversity in the boardroom has a positive effect on firm performance, but the effect tends to be diminished in countries with higher female economic participation and empowerment. The study then attributes the diminishing effect to mandatory gender quota, which reduces firm performance in countries with strong cultural resistance. Finally, Post and Byron (2015) 2
In another example, the U.K. required Financial Times Stock Exchange 100 (FTSE 100) listed companies to attain a female director proportion of 25 percent by 2015. Moreover, Germany demands that forward from the year 2016, all publicly listed companies must dedicate at least 30 percent of board seats to female directors.
suggest board gender diversity is not a simple “numbers game”, but firms should develop a board culture in which dissenting voices are heard and considered. As an index of corporate performance, earnings are an important consideration for investors, customers, and stakeholders, and thus give rise to differences in earnings management behaviors among managers. Seminal work from Schipper (1989) proposes firms’ earnings management activities are categorized into accrual-based earnings management (AEM) and real earnings management (REM). AEM depicts choices managers make to attain earnings objectives through the selection of generally accepted accounting methods and discretionary estimates of accruals, or unpaid expenses and revenues. Considering that accounting accruals may be reversed during continuous operations in the following year, however, scholars argue that earnings management is constrained by accumulated accruals (Fan et al., 2010; Hunt, Moyer, and Shevlin, 1996). Moreover, while AEM is a common accounting practice, auditors have become less tolerant of AEM behaviors. Some studies find that AEM has become more easily detected (Graham, Harvey, and Rajgopal, 2005; Roychowdhury, 2006). In fact, a major consequence of accounting scandals in the post Sarbanes-Oxley Act (SOX) era is that external auditors now put greater focus on earnings manipulation activities, which has caused firms’ financial reporting to become more conservative. Within this context, recent literature finds there is a tendency for firms’ earnings management to gradually shift from AEM to REM (Cohen and Zarowin, 2010; Cohen, Dey, and Lys, 2008).
In contrast to AEM, REM describes activities wherein firms try to meet earnings objectives by deviating from normal operating modes and engaging in strategic real transactions that increase current earnings. Some examples include (1) offering price discounts, extending a credit period to accelerate sales revenues, or (2) increasing mass production to reduce sales costs, or (3) reducing discretionary research and development (R&D) expenses or advertising expenses. Although these activities may contribute to increased earnings immediately, they reduce marginal profits of future operating revenues, cause overproduction and consequently overstock and often times interrupt valuable long-run R&D activities. Therefore, REM harms future cash flows, increases operating costs, and damages the long-term firm value (Cohen, Dey, and Lys, 2008;
Roychowdhury, 2006). Nonetheless, the reason managers prefer REM to AEM might be that the arrangements of real transactions are not directly associated with accounting selection or estimates, and are less likely to be detected or challenged by auditors (Cohen and Zarowin, 2010; Gupta, Pevzner, and Seethamraju, 2010).
As stated earlier, European countries have legislated that firms ensure a specified proportion of female directors on their boards of directors, and so research on female directors is increasing. However, most studies focus on female directors’ relationships to firm performance and some specifically address earnings management behavior, using discretionary accruals as the measure. Considering that after SOX, managers prefer to manage earnings via real transaction arrangements, our study adds to the extant literature by also exploring the supervisory and advisory effect of female directors on AEM and REM in Taiwan. In general, Western countries lead the way for enhancement in corporate governance issues. A recent study from Huang et al. (2014) reports that the implementation of corporate governance regulations plays a crucial role in reducing earnings manipulation behavior. Huang, Shiue, and Chang (2010) add that the composition of the board of directors plays an important role in the quality of corporate governance. Taiwan is among several countries whose government strongly advocates for female directorship to enhance diversity, which represents a trending in corporate governance development in both emerging markets and the Western world. Taiwan also takes pride that its female-to-male gender wage gap is among the smallest in emerging markets and that the talents of women are more appreciated in the workforce. Recently in Taiwan, the purpose of passing “Corporate Governance Best Practice Principles for TWSE/GTSE Companies” of 2014 is to implement a better balance of board gender equality for all public firms. That comprises of a policy goal for firms to “appoint at least one female director” for 2015, and maintain “a board composition that consists of a gender ratio of at least 2:1” for 2016, all of which aim to achieve board diversity.
Considering this early evidence in Taiwan, we argue that global leaders should advocate board diversity when considering future development in relatively smaller economies, and recognize that Taiwan’s development has greatly influenced the Asian region for decades.
Based on a sample of 3,102 firm-year observations in Taiwanese firms during the period of 2006 to 2010, our study explores the relationship between female directors and earnings management activities. Our study uses discretionary accruals proxies: the absolute value of discretionary accruals in AEM, and various proxies of REM. Those proxies include abnormal cash flows, abnormal inventory over-production, abnormal discretionary expenditures, and
the aggregate REM index3 in REM, as measures of earnings management
activities, respectively. Overall, these results demonstrate that female directors play an active role in the oversight of real transaction arrangements, i.e. they constrain managers’ reduction of discretionary spending to meet earnings targets. That resonates with the notion that REM has negative consequences for future cash flows and is detrimental to a firm’s value in the long term (Chi, Lisic, and Pevzner, 2011; Cohen, Dey, and Lys, 2008; Roychowdhury, 2006).
We further analyze the relationship of female directors, suspect firms, and REM behaviors. Prior studies (Roychowdhury, 2006; Zang, 2012) indicate that suspect firms are those that report profits just at or above zero to meet their earnings threshold. We examine whether the presence of female directors might affect managerial intention in suspect firms toward manipulation to avoid losses or report small profits. However, our study does not find evidence to support that female directors alone constrain REM activities with respect to suspect firms. In addition, our results remain similar to those of suspect firms with greater REM incentives during the financial crisis of 2008-2010.
To the best of our knowledge, this research is among the first empirical studies to explore the relationship between female directors and REM, and our results support the conjecture that female directors may constrain a firm’s REM. Specifically, the contributions of this research are threefold. First, our research fills a gap in existing research on female directors and earnings management, which until now has mostly focused on AEM but rarely investigated REM. The research thus provides another alert for auditors and regulators of firms’ earnings reporting. Second, our research expands the extant literature on gender diversity in the boardroom, corporate governance, and earnings management, in particular 3
We follow Cohen, Dey, and Lys (2008) to create the proxies of AEM and REM. All variables are explained in details in 3.2 research method section. Exhibit 1 presents a summary for variable descriptions.
to contribute to such topics in emerging markets. Third, as there are currently no specific guidelines or regulations to promote gender diversity on corporate boards either in Taiwan or China, we expect that this study may serve as a reference for the advocacy and promotion of female representation on boards in the Greater China region.
The remainder of the paper is organized as follows: Section 2 reviews the literature and theories that we used to develop our research hypotheses. Section 3 describes the study’s research design, methods, and models. It is followed by data, and the sample of study in Section 4 where empirical results are reported. Finally, Section 5 provides our discussion and concluding remarks.
2. Hypotheses and related theories
2.1 Gender diversity in the boardroom
The value-in-diversity hypothesis (Cox, Lobel, and Mcleod, 1991) defines diversity as interaction and meeting of multiple viewpoints within a team, which thereby facilitates the exercise of advantages inherent in the team and organization. Thus, when there is diversity on a team, members are inspired by the variety of viewpoints, experiences, and knowledge each team member brings to a team. In particular, the views and voices unique to female directors in the boardroom may greatly contribute to group thinking, and thus provide value in decision-making (Zelechowski and Bilimoria, 2004). In addition, the suggested hypothesis furthers this idea. The appointment of female directors is an indicative of valuing women employees in the company. This provides a signal to current and prospective employees that the organization offers professional growth and career development opportunities for women (Milliken and Martins, 1996). Since society tends to judge organizational diversity, Elgart (1983) finds the decision to admit women into the boardroom to meet a social expectation may be a key source of pressure during company formation. Management studies find that firms that experience such a need tend to appoint female directors do so more frequently, and larger companies especially, due to the heightened public attention they draw, are also more likely to appoint female directors in response to social pressure for gender diversity (Hillman, Shropshire, and Cannella, 2007).
In fact, early evidence shows that several institutional investors have established
the policy of investing only in companies committed to gender diversityin recent
years (Browder, 1995). Therefore, firms have potentially greater incentives to appoint female directors to meet societal expectations. However, a recent empirical study in Sila, Gonzalez, and Hagendorff (2016) indicates that appointing female directors and firm’s risk presents no relationship.
2.2 Female directors and earnings management
Prior research regarding female directors finds that the relationship between female directors and firm performance remains undetermined; most results are mixed. On one hand, for example, Kanter (1977) and Zelechowski and Bilimoria (2004) argue that female board members do not directly contribute to firm performance due to the fact that in some firms, female directors are simply appointed as “tokens” to satisfy boardroom gender diversity goals. Additional studies concur. Analyzing board gender diversity of Danish public firms between 1998 and 2001, Rose (2007) finds that the representation of female directors is not correlated with firm value. Bøhren and Staubo (2014, 2016) also find that forcing radical gender balance on corporate boards increased board independence and reduced firm value, when incoming females have limited experience with the firm. By using samples in four Asian emerging markets, Low, Roberts, and Whiting (2015) report that board gender diversity has a positive effect on firm performance, but the effect appear to be diminished in countries with higher female participation due to tokenism, suggesting that mandating gender quota can reduce firm performance in countries with strong cultural resistance. Another study from Ahern and Dittmar (2012) documents that female directors are either not or negatively associated with firm value, and that women, by nature of their gender, do not exert personal influence. Furthermore, Lee and James (2007) find that capital markets react negatively to the external appointment of female CEOs, but react positively to internally promoted female CEOs. Distinguished by CEO gender, a recent study shows that firms with female CEOs tend to make financing and investment choices that are less risky than those of otherwise similar firms run by male CEOs (Faccio, Marchica, and Mura, 2016). Finally, to the disbelief of some, Haslam et al. (2010) deem that female senior managers are regarded as a signal of company decline.
Other literature, on the other hand, suggests that female directors may contribute to company value. Both studies from Carter, Simkins, and Simpson (2003) and Campbell and Mínguez-Vera (2008) report that female directors could indeed enhance firm value. Furthermore, Erhardt, Werbel, and Shrader (2003) find that the proportion of female directors within a firm is positively correlated with its return on asset (ROA) and return on equity (ROE). In the similar vein, Amore, Garofalo, and Minichilli (2014) find that increasing fraction of female directors improves firm profitability in female-led sample in Italian family-controlled firms. Liu, Wei, and Xie (2014) demonstrate board gender diversity and firm performance have a positive and significant relationship in Chinese firms, and female executive directors have a stronger positive effect on firm performance than female independent directors.
It is generally accepted that women are more likely to abide by professional ethics (Bernardi and Arnold, 1997; Franke, Crown, and Spake, 1997; Valentine and Rittenburg, 2007), and are less likely to participate in unethical behaviors for financial gain (Betz, O’Connell, and Shepard, 1989; Khazachi, 1995). Cumming, Leung, and Rui (2015) indicate that women are more effective, in male-dominated industries, to reduce both the frequency and severity of frauds in Chinese firms. Moreover, female managers tend to be more conservative and prudent than their male counterparts, and thus are less likely to implement high-risk strategies (Powell and Ansic, 1997). A study finds firms with female directors are less likely to make acquisitions, and if they do, they pay lower acquisition premiums (Levi, Li, and Zhang, 2014). Adams and Ferreira (2009) show that female directors have better attendance records than male directors, which suggests female directors are also better at monitoring. It is important to note, however, that excessive monitoring could be detrimental to the improvement of firm value (i.e., Tobin’s Q), whereas proxies for firm performance are mostly associated with earnings numbers; hence, to ensure the quality of earnings is of utmost importance.
Regarding recent literature on earnings quality, Krishnan and Parsons (2008) find that firms with a higher proportion of female senior managers exhibit better quality of earnings. In a similar vein, Xiong (2016) documents that Chinese firms with chairmen on the board who are female, long-tenured, older, and more educated will present lower absolute discretionary accruals and lower real
earnings management. Na and Hong (2017) use separate groups with CEOs by gender and report that male CEO firms have tendency to use aggressive discretionary accruals and real activities operations to achieve earnings goals (i.e., small positive earnings or small earnings increases) compared to the female counterparts do not. In addition, female CFOs are more inclined to exercise highly conservative accounting strategies (Peni and Vähämaa, 2010; Liu, Wei, and Xie, 2016). The aforementioned studies demonstrate the firms with female
CEOs, CFOs, and Chairmen may have lower accruals earnings management4
and real earnings management. In addition, previous research also find female directors are more likely to constrain earnings management activities, resulting in higher quality of earnings for their firms (Gavious, Segev, and Yosef, 2012; Liu, Wei, and Xie, 2016; Luo, Xiang, and Huang, 2017; Srinidhi, Gul and Tsui, 2011). Both research of Srinidhi, Gul, and Tsui (2011) and Gavious, Segev, and Yosef (2012) are based on discretionary accruals or non-operating accrual quality. Moreover, a recent study in Luo, Xiang, and Huang (2017) reports that a firm, with at least three women directors or a high female director ratio, is more likely to be associated with lower levels of real activities manipulation in Chinese listed companies. The negative relation is even stronger when female directors have higher equity ownership.
Our research differs from the above studies in several ways. We focus on relation of AEM and REM with female directors in Taiwanese firms, rather than with CEOs and CFOs. High-level management has the information advantages directly engaging in earnings management activities than those of board of directors, whom typically exercise advisory function on the proposals and agenda in the board meetings. We also posit that corporate governance environment is very different between China and Taiwan as our study contributes unique perspective of boardroom dynamics. Most listed firms in China are originated from state-owned enterprises (SOEs): the accounting 4
Compared to earnings management methodology, the above studies employ different models to estimate discretionary accruals. Xiong (2016) uses McNichols model (2002) with a modification of Dechow and Dichev’s (2002) to examine the effect of female chairmen on the board. Na and Hong (2017) examine CEO groups of gender using performance matched accruals model by Kothari, Leone, and Wasley (2005), in which a firm’s ROA is incorporated in the model. Modified Jones Model (Dechow, Sloan, and Sweeney, 1995) is applied to Chinese female (male) CFOs sample in Liu, Wei, and Xie (2016). Xie (2016).
information is essential for regulatory controls and investor protection is relatively weak, whereas the political intervention is documented as one of the
major corporate governance concerns in Chinese listed firms (Fan, Wong, and
Zhang, 2007; Wang, 2011). In addition, Chi, Liao, and Chen (2016) document that elements of resources and network with political connection provided by SOEs are crucial to the operations in Chinese firms. Therefore, due to many members of board and management level are designated by government and state-own agencies in Chinese firms, Chi et al. (2015) argue that majority shareholders may access information from respective companies easily (i.e., no need to count on firms’ public disclosures) and thus present little incentive to improve financial reporting quality and care less about the best interests of the company, provided that designated majority shareholders are not well represented of real interests of typical shareholders, (i.e., family shareholders from a family firm). We argue that Taiwanese firms, however, are dominated by family-controlled companies and are under a better established governance system. Chang et al. (2013) mentioned that if the family business does not have a sound monitoring system, hiring an overconfident CEO will increase risks. Fan and Wong (2002) find the highly concentrated ownership of Asian family firms have both ability and incentive to effectively control the earnings reporting quality. Since the corporate dynamics and governance challenge of Taiwan present differently from those of Chinese capital markets, results from Chinese sample may not be good reference to be applied in Taiwan.
From the above evidence regarding the association between female directors and earnings quality, accrual-based discretionary accruals (DAs) are used as the proxy of the quality of earnings in many studies (i.e., Srinidhi, Gul, and Tsui, 2011), whereas REM is excluded in their respective methodologies. Recent literature demonstrates, however, that post SOX, management is more inclined to engage in REM instead of manipulation of DAs through AEM (Cohen and Zarowin, 2010; Cohen, Dey, and Lys, 2008). This suggests that firms are concerned about their AEM behaviors (which can be detected by external auditors), and in attempt to avoid the scrutiny of government agencies and regulators, result in a minimization of legal liabilities. AEM has both accumulative and reversal natures, which represent relatively short-term effects. However, a firm engages in REM to enhance the current period performance by
deviating from normal operating patterns. Consequently, REM adversely affects a firm’s future cash flows and firm value to a greater extent and more severely than that of AEM. Although numerous studies investigate the relationship between corporate governance and earnings management (Matsuura, 2008; Sari, Warsono, and Suryaningsum, 2010; Srinidhi, Gul, and Tsui, 2011), their contexts consistently focus either on female directors and AEM, or on other governance effects of REM (Kang and Kim, 2012; Visvanathan, 2008). In addition, firms manipulate earnings by both of AEM and REM, whereas accruals-based earnings management (AEM) and real earnings management (REM) activities are commonly presented as a substitution. Our research focuses on the relation between female directors and REM, due to the topic that female directorship effect on REM has thus far been disregarded.
Psychological and behavioral economics have previously compared the gender differences, and they pointed out that women are more diligent and dutiful, more likely to avoid risks, more law-abiding, and less overconfident than men (Dowling and Aribi, 2013). Recently, scholars have also cited such gender differences within organizational management while observing financial reporting and audit quality. This has been reported especially in the United States and some European countries, where women are found to outperform men when financial reports are prepared, supervised, and audited. Krishnan and Parsons (2008) and Srinidhi, Gul, and Tsui (2011) find that gender diversity in high-level management contributes to improved earnings quality. Barua et al. (2010) find that financial reports are relatively conservative, while performance-matched DAs and the accrual estimation errors are lower, in companies where the CFO is female or if the male CFO is replaced with a female CFO. Finally, Ittonen and Vähämaa (2013) find that clients audited by female auditors usually report low absolute values of DAs and accrual estimation errors, which indicate a significant constraining effect on earnings management behaviors for clients audited by female auditors.
Along a similar vein, we argue that female directors usually require firms to establish a tighter internal control system, overcome deficiencies in internal control, strengthen communication with internal auditors or external auditors, and doubt radical accounting treatments conducted by senior management, which thus decrease errors or omissions in financial reports. Likewise, major
transactions that deviate from normal operations (i.e., share buy-back programs, debt/equity swaps, and long-term investments), are resolved by boards of directors. Female participation on boards facilitates a more thorough and prudent decision-making process and inhibits earnings management behaviors that may improve short-term performance, but compromise the long-term value of the firm. Therefore, we argue that the presence of female directors is negatively related to earnings management behaviors. Furthermore, when it comes to the effect of greater female representation on the board, owing to the argument of an earlier study that coins female appointment as “merely token” (i.e., Kanter, 1977; Zelechowski and Bilimoria, 2004), we conjecture that a greater representation of female board members (based on number and ratio) should distinguish the symbolic token effect from its potential influential power on the board. Erhardt, Werbel, and Shrader (2003), all support that the proportion of female directors is positively associated with the firm’s returns and firm performance.
Accordingly, the above research discussion helps develop the following hypotheses:
H1: Ceteris paribus, compared to firms without female directors, firms
with females serving on the board of directors have lower level of accrual-based earnings management.
As stated above, prior studies find that firms engaged with earnings management have shifted their behavior from AEM to REM over time in recent years (Cohen, Dey, and Lys, 2008; Graham, Havery, and Rajgopal, 2005). The increasing trend that firms involved with real operational transaction activities for real earnings management contributes towards developing a similar hypothesis as follows.
H2a: Ceteris paribus, compared to firms without female directors, firms
with females serving on the board of directors have lower level of overall real earnings management.
Several studies on REM (including Cohen and Zarowin, 2010; Cohen, Dey, and Lys, 2008; Roychowdhury, 2006) have constructed common measures for REM metrics. These recognized measures contain activities that a firm engages in (1) lower of cash flow from operations, (2) reduction of the cost of goods sold by over-producing inventory, (3) cutting the discretionary expenditures that involving advertising, research and development projects (R&D), and selling,
general, and administrative expenses (SG&A). Empirical evidence from above literature all supports that these measures and REM metrics have successfully captured real activities manipulation among firms.
We concur with the argument when firms manages reported earnings upward, in a given sales level, may engage activities on price discounts, channel stuffing, overproduction, and (or) reduction of discretionary expenditures. That leads to firms have lower cash flow from operations, and/or unusually lower discretionary expenses, and/or higher production costs (Cohen and Zarowin, 2010). Along with the discussion above, we continue to argue that firms with female directors may constrain of real earnings management activities, a similar effect that constrains of REM metrics may occur with respect to various proxies of REM. In other words, the presence of female directors also constrains on transaction arrangements of REM firms from lowering cash flow from operation , lowering production costs, and (or) cutting excessively discretionary expenses. Prior literature points out that the price discounts, channel stuffing, and overproduction have a negative effect on contemporaneous abnormal CFO (Abn_CFO), whereas reduction of discretionary expenditures has a positive effect. Thus the net effect on Abn_CFO is ambiguous (Roychowdhury, 2006). Based on the discussion, we thus propose the following hypotheses.
H2b: Ceteris paribus, compared to firms without female directors, firms
with females serving on the board of directors exhibit at least one of the following: unusually high cash flow from operations (Abn_CFO), or unusually high discretionary expenditures (Abn_DISX).
H2c: Ceteris paribus, compared to firms without female directors, firms
with females serving on the board of directors exhibit unusually low production costs (Abn_PROD).
3. Research method and models
In this section, we discuss earnings management measures most commonly used in prior literature.
3.1 Discretionary accruals (DAs) in accrual-based earnings management (AEM)
Both studies in Warfield, Wild and Wild (1995) and Francis, Maydew, and Sparks (1999) point out that DAs are the preferred measures employed in traditional earnings manipulation. Prior accounting literature routinely uses the Jones Model (1991) and the Modified Jones Model (MJM) to estimate DAs (Dechow, Sloan, and Sweeney, 1995) to reflect managerial discretion in the firm’s earnings reporting. However, the estimation of DAs contains errors when corporate performance is abnormal (Dechow, Sloan, and Sweeney, 1995; Guay, Kothari, and Watts, 1996). Therefore, Kothari, Leone, and Wasley (2005) propose that a firm’s return on assets (ROA) should be used as a control to correct errors arising from abnormal performance. Accordingly, our research incorporates the ROA into the Modified Jones Model for each industry and year to estimate DAs in model (1):
TAijt /Aijt-1 = ajt + φ1jt (1/Aijt-1)+ φ2jt [(△ REVijt - △RECijt )/Aijt-1]
+ φ3jt (PPEijt/Aijt-1)+ φ4jt ROAijt + εijt (1)
where
TAijt: Total accruals of the firm I of the industry j in period t is equal to the
recurring earnings minus operating cash flows;
Aijt-1: Total assets of the firm i of the industry j in period t-1;
△REVijt: Change in net sales revenues of the firm i of the industry j from period
t-1 to period t;
△RECijt: Change in accounts receivable of the firm i of the industry j from period
t-1 to period t;
PPEijt: Gross property, plant, and equipment of the firm i of the industry j in
period t;
ROAijt: Return on assets of the firm i of the industry j in period t;
εijt: Residual term of the firm i of the industry j in period t;
Aligning with prior literature (i.e., Dechow, Sloan, and Sweeney, 1995), this study uses Ordinary Least Square regression (OLS) model (1) for accrual estimates on a year-by-year and industry-by-industry basis. In addition, the residual term ε in model (1) is the discretionary accrual, labeled as DA in this study. To remain the consistency with prior literature (i.e., Cohen, Dye, and Lys,
2008), we compute the absolute value of discretionary accruals to proxy for
earnings management, and refer to it as ABS_DA5.
Following the same vein as Cohen, Dye, and Lys (2008), we also consider that managers have income-increasing (income-decreasing) incentives of earnings management in response to a particular event. Firms with positive values (negative values) of discretionary accruals imply that the managerial tendency to manage earnings upward (downward). Thus, we further divide DA into two groups: firms with income–increasing discretionary accruals by DA with the value greater or equal to zero (DA_POS), and firms with income-decreasing discretionary accruals by DA smaller to zero (DA_NEG). A firm with the positive DA (negative DA) is the indicator of managerial incentive to engage in upward (downward) accrual-based earnings management. We then repeat the model (1) and further examine the relationship between female directors and upward (downward) AEM.
3.2 REM index in real earnings management (REM)
Following Roychowdhury (2006), this study uses the aggregate measurement index of three variables, including abnormal cash flows, abnormal inventory production, and abnormal discretionary expenditures as the proxy to measure the degree of REM activities in which a firm may engage. Models (2),
(3), and (4) below are specified to obtain residuals (εit, ωit, and νit, respectively)
as the estimates of abnormal cash flows (Abn_CFO), abnormal inventory production (Abn_PROD), and abnormal discretionary expenditures (Abn_DISX). As Roychowdhury (2006) mentions, in a given sales level, firms that manage earnings upward are likely to exhibit usually low cash flow from operations (Abn_CFO) and/or low discretionary expenditures (Abn_DISX), and/or high producing cost (Abn_PROD). We then follow the methods developed in Cohen, Dey, and Lys (2008) and Chi, Lisic, and Pevzner (2011), which have standardized the estimates of three real earnings management proxies to capture the overall net effect of real earnings management by one aggregate variable. Following Chi, Lisic, and Pevzner (2011), we define REM Index as 5
We also perform our analysis using AEM proxy of discretionary accruals without taking absolute values, and the results remain unchanged with that of discretionary accruals with absolute values.
follows: REMI = − Std_CFO + Std_PROD − Std_DISX, where a high value of
REMI represents a high level of overall REM, and vice versa. In other words, REMI = [- standardized cash flows (Std_CFO) + standardized inventory
production (Std_PROD) − standardized discretionary expenditures (Std_DISX)]. Because the real earnings management activities directly affect cash flows, it is more difficult to detect. However, these three individual variables have different implications for earnings which may dilute the results using an aggregated measure (REMI). To accurately capture the effect without possible deviation, our study performs the following estimation models (2)~(6) to regress for each industry and year, and report our results corresponding to the above four REM proxies (Abn_CFO, Abn_PROD, Abn_DISX, and REMI).
We first use the model developed by Dechow, Kothari, and Watts (1998) and incorporate in Roychowdhury (2006) to generate the normal levels of cash flow from operations, production cost, and discretionary expenditures. The normal CFO is expressed as a linear function of sale revenues and change in sale revenues. To estimate the model, we run the following cross-sectional regression by year and industry identified by two-digit SIC code.
The residual of model (2) is used to estimate abnormal cash flows (Abn_CFO):
CFOit /Ai,t-1 = φ1t (1/Ai,t-1)+ φ2t (Salesi,t /Ai,t-1 )+ φ3t (△Salesi,t /Ai,t-1 ) + εit (2)
where CFO represents cash flows from operating activities in period t, and Sales
(△Sales) represents net sales revenues (change of sales revenues). We have all
variables deflated by the beginning of total assets as prior research suggested. Our abnormal CFO is depicted by that actual CFO minus the normal level of CFO calculated using the estimated coefficient from model (2).
Similarly, production costs are defined as the sum of cost of goods sold (COGS) and change in inventory during the year. Following Cohen, Dey and Lys (2008), the model for normal COSG is estimated as
COGSit /Ai,t-1 = φ1t (1/Ai,t-1)+ φ2t (Salesi,t /Ai,t-1 ) + ωit (3)
△INVit /Ai,t-1 = φ1t (1/Ai,t-1)+ φ2t (△Salesi,t /Ai,t-1 ) + φ3t
(△Salesi,t-1 /Ai,t-1 )+ ωit
(4)
Using models (3) and (4), we estimate the residual of model (5) to estimate abnormal inventory production (Abn_PROD):
PRODit /Ai,t-1 = φ1t (1/Ai,t-1)+ φ2t (Salesi,t /Ai,t-1 )+ φ3t (△Salesi,t
/Ai,t-1 )+ φ4t ( △Salesi,t-1 /Ai,t-1 )+ ωit (5)
where PROD represents the total sum of cost of sales and inventory changes in period t. As mentioned earlier, overproduction has a negative effect on COGS relative to sales, but price discounts have a positive effect, which may result in an unclear and ambiguous net effect.
Finally, abnormal discretionary expenditure (Abn_DISX) is estimated using the residual of model (6):
DISXit /Ai,t-1 = φ1t (1/Ai,t-1) + φ2t ( Salesi,t-1 /Ai,t-1 ) + νit (6)
where DISX represents the total sum of advertising costs, R&D expenses, and operating expenditures. If firms manage sales upward to reported earnings by reduction of discretionary expenditures in a year, it leads to abnormally low discretionary expense relative to sales and low residual from model (6) (Roychowdhury, 2006).
Based on the above discussion, our study employs discretionary accruals (includes ABS_DA, DA_POS, and DA_NEG) in AEM and a REM metrics (includes REMI, Abn_CFO, Abn_PROD, and Abn_DISX) in REM as proxies to measure the firm’s earnings management activities.
3.3 Variables of interest
This study examines the effects of whether female directors constrain firms’ earnings management behaviors in related settings: (1) whether the firm’s board of directors contains female directors (FEMnod); we set an indicator variable that takes 1 if the firm consists of one or more female directors and 0 otherwise. (2) the number of female directors (FEMno); we use the number of female directors on the firm’s board. (3) the proportion of female directors (FEMnor);
we use the ratio of female directors to the total number of directors in the firm. The variable of interest is the directors’ gender, which is obtained by first retrieving the names of the directors from the Board of Directors Section of the
Taiwan Economic Journal database. As the Directors Section does not contain
gender identification, directors’ gender is evaluated according to their documented first names. If it was difficult to judge director’ gender by their first names, we sought further determination via an online database search or by phone, inquiring with the respective company.
3.4 Control variables
In addition to female directors as our key variable of interest, we also consider three sets of control variables in the research model as prior literature suggests.
First, our research model controls: (1) firm common characteristics, including firm size (Size), firm performance (ROA), and leverage ratio (Lev). We also include Market- to-Book ratio (MTB) and sales growth (Sgrow) to control for the firm’s growth opportunity, which are expected to reversely affect the earnings management incentive. In addition, a firm’s incentive for earnings management is positively related to a firm with negative earnings in a previous
period (Loss) and with larger earnings fluctuations over the year (△E), which are
also controlled for. Moreover, high audit quality is more likely to affect the selection of earnings management (Reichelt and Wang, 2010), thus (2) the firm’s auditors and their related characteristics are included. We consider that Big Four auditors (BigN) and auditors with industry expertise (Spec) provide better audit
quality (Becke et al., 1998; Balsam, Krishnan, and Yang, 2003), whereas the
tenure of an audit firm with the company (Tenure) and the company with a “going concern opinion” (GC) may offer greater incentives for earnings
management (Myers, Myers, and Omer, 2003; Chen, Lin, and Lin, 2008).
Additionally, (3) we recognize corporate governance characteristics specified in prior study in Southeast Asian samples. These control variables include whether the sample is a family-owned business (Family), the board chairman holds a dual role as the CEO (Duality), the degree of transparency in corporate information disclosure (TRAN), the independent directors ratio (Indsr), and the ratio of the directors in the firm’s managerial positions to total directors (Mgstr).
It is expected that the higher the board independence (Indsr) (Klein, 2002; Peasnell, Pope, and Young, 2005; Xie, Davidson, and DaDalt, 2003) and disclosure (TRAN) (Hunton, Libby, and Mazza, 2006), the lower the abnormal accruals will be. However, we note that it is inconclusive as far as the direction between family-owned businesses and earnings management. Being a family-owned business may have a negative entrenchment effect on earnings quality (Shleifer and Vishny, 1997; Fan and Wong, 2002) and a positive alignment effect on earnings quality (Ali, Chen, and Radhakrishnan, 2007).
To summarize the above discussion, the research model to examine the relationships described above is as follows:
REMj,t (DAj,t) = φ0+ φ1 FEMi,t+ φ2Indsri,t + φ3Mgtsri,t + φ4Familyi,t +
φ5Sizei,t + φ6Levi,t-1 + φ7Sgrowi,t-1 + φ8ROAi,t-1 +
φ9GCi,t + φ10Lossi,t + φ11△Ei,t-1+ φ12MTBi,t-1 +
φ13Dualityi,t + φ14TRANi,t + φ15BigNi,t-1 + φ16Tenurei,t
+ φ17Speci,t + 𝑌𝑌𝑌𝑌𝑌𝑌𝑌𝑌𝑌𝑌𝑌𝑌𝑌𝑌𝑌𝑌𝑌𝑌+𝐼𝐼𝐼𝐼𝐼𝐼𝑌𝑌𝐼𝐼𝐼𝐼𝑌𝑌𝑌𝑌𝑌𝑌𝑌𝑌𝑌𝑌𝑌𝑌𝑌𝑌+ ψit (7)
The definitions of the above variables are described in detail in Exhibit 1.
Exhibit 1 Variable description
Variables of interest
FEMnod An indicator variable set as 1 if there is at least one female director on the board; zero otherwise.
FEMno Number of female directors appointed to the firm’s board.
FEMnor Ratio of the firm’s female directors to total directors.
ABS_DA The absolute value of discretionary accrual, proxy for the firm’s accrual-based earnings management (AEM) based on Modified Jones model (1990).
DA_POS The value of positive discretionary accruals computed using the Modified
Jones Model.
DA_NEG The value of negative discretionary accruals computed using the Modified
Jones Model.
Abn_CFO Abnormal cashflow from operations, Abnormal CFO is actual CFO minus the normal level of CFO, measured as deviations from the predicted values from the corresponding industry-year regression
CFOit/Ai,t-1 = φ1t (1/Ai,t-1)+ φ2t (Salesi,t /Ai,t-1 )+ φ3jt (△Salesi,t /Ai,t-1) + εit
Abn_PROD Abnormal production costs (Production costs are defined as the sum of
COGS and change in inventory during the year), measured as deviations from the predicted values from the corresponding industry-year regression
Prodit /Ai,t-1 = φ1t (1/Ai,t-1)+ φ2t (Salesi,t/Ai,t-1)+ φ3t (△ Salesi,t /Ai,t-1)+ φ4t
(△ Salesi,t-1 /Ai,t-1)+ ωit
Abn_DISX Abnormal discretionary expenses, Disx represents the discretionary expenditures in period t, defined as the sum of advertising expenses, R&D expenses and SG&A. Abnormal discretionary expenses measured as deviation from the predicted values from the corresponding industry-year regression
DiscExpit /Ai,t-1 = φ1t (1/Ai,t-1) + φ2t (Salesi,t/Ai,t-1) + νit
REMI We compute a single variable by combining the three individual real earnings management variables. Specifically, we compute REMI as the sum of the standardized variables, Abn_CFO, Abn_PROD, and Abn_DISX. Real earnings management presents the degree of a firm’s real earnings management activities and proxy by the aggregate index. REM Index = − Std_CFO + Std_PROD − Std_DISX, following Cohen, Dye, and Lys (2008) and Chi, Lisic, and Pevzner (2011).
Suspect An indicator variable that is set equal to one if return on assets in current yearis between 0 and 1%, and is set equal to zero otherwise.
Suspect× FEMnod
An indicator variable that is set equal to one if the suspect firms with female directors, and is set equal to zero otherwise.
Control Variables
Indsr Ratio of the firm’s number of independent directors to total directors.
Family An indicator variable set as 1 if the firm is a family-owned business; zero otherwise.
Mgtsr Ratio of the directors in firm’s managerial positions to total directors.
Lev The leverage ratio in previous year.
Size Natural logarithm of total assets at the beginning of the year.
Sgrow Sales growth ratio in previous year, defined as (Salest-1 - Salest-2)/Salest-2 ROA Return on assets in previous year, defined as net income before
extraordinary items divided by the average total assets
GC An indicator variable set as 1 if the firm’s auditors issue a going concern opinion; zero otherwise.
Loss An indicator variable set as 1 if the firm reports a net loss for the year; zero otherwise.
△E Change in earnings from previous year, deflated by total assets in previous year.
MTB Market-to-book ratio in previous year.
Duality An indicator variable set as 1 if CEO holds dual positions as the board chairman; zero otherwise.
BigN An indicator variable set as 1 if the firm is audited by one of the Big Four auditing firms; zero otherwise.
Tenure Number of years the auditor has audited the firm's financial statements.
Spec An indicator variable set as 1 if the auditor of the firm has been classified as an industry expert; zero otherwise.
TRAN The firm’s information transparency ranking. The Stock Exchange Commissions of the Taiwan Securities and Futures Bureau evaluates all listed companies on their information disclosure. Firms are scored from 1 to 5, with 5 being the greatest transparency. Chi, Tang, and Chen (2012) use the same proxy for the evaluation of corporate transparency in Taiwanese listed companies.
FEMind Female directors who also serve as independent directors.
Age The number of years that firms have reported in TEJ.
Diversity Total diversification modified in Palepu (1985).
Risk Standard deviation in daily returns over a firm’s fiscal year (standardized to a mean of 0 and a standard deviation of 1)
Vwret The value-weighted market returns measured over the fiscal year
Insti Institutional holding ratio.
Bseat Number of directors appointed to the firm’s board.
Tobinq Tobin’s Q, the book value of assets minus the book value of equity, plus the market value of equity, scaled by the book value of assets
IMR Inverse Mills ratio. It is the ratio of probability density function to the cumulative distribution function, and is commonly estimated from the first- stage of Heckman procedure (1979) to control for selection bias. See
details in Heckman (1979).
4. Sample and empirical results
4.1 Data and sample
The sample selection for this research is retrieved from the Board of Directors Section of the Taiwan Economics Journal database referencing years 2006 and 2010, which contains all public companies listed in the Taiwan Stock Exchange. All other corresponding financial and accounting data are retrieved from the Taiwan Economics Journal. After we exclude firms in the financial and insurance industry, and eliminate firms with missing data, 3,102 firm-year observations remain for our sample. Table 1 describes the distribution of sample among the test period. As shown in Table 1, the companies that appointed at least one female director account for about 48 percent; only 117 firm-year
Table 1
Sample distribution of firms with female directors by year
2006 2007 2008 2009 2010 Total % FEMnod 0 305 314 326 337 337 1619 52% 1 288 294 294 295 312 1483 48% Total 593 608 620 632 649 3102 100% FEMno 0 305 314 326 337 337 1619 52.2% 1 196 184 184 186 199 949 30.6% 2 75 93 87 82 80 417 13.4% 3 14 14 18 22 28 96 3.1% 4 1 2 4 3 4 14 0.5% 5 1 0 1 2 1 5 0.2% 6 1 1 0 0 0 2 0.1% Total 593 608 620 632 649 3102 100% FEMnor Total 9.6% 10.0% 9.9% 10.0% 10.1% 10.0%
Note: FEMnod: the presence of female directors and an indicator variable, sets as 1 if there is at least one
female director on board in the company; zero otherwise. FEMno: the number of female directors appointed in the company. FEMnor: the ratio of female directors to total directors in the company.
observations appointed at least three female directors, accounting for 3.8 percent. The companies having designated only one female director seat account for the largest proportion.
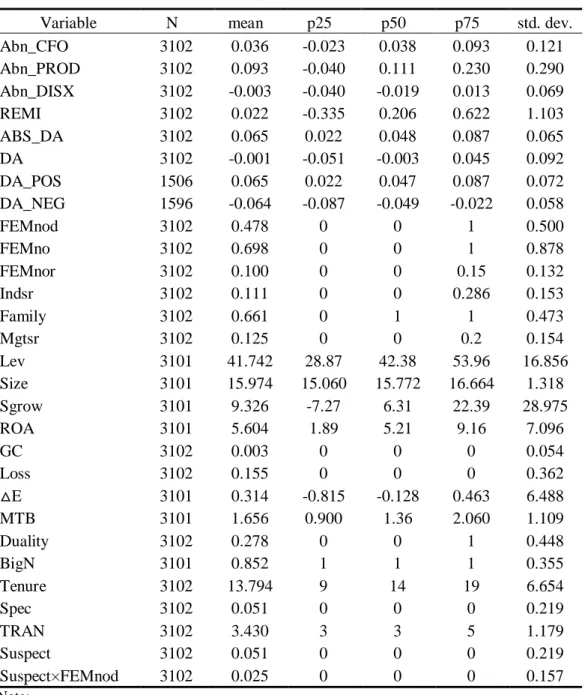
4.2 Descriptive statistics analysis
As shown in Table 2, we find the average number of female directors across all sample firms is 0.698 per firm with a high standard deviation of 0.878, and the average ratio of female directors to total director seats is about 10 percent. This suggests that females still make up a small proportion of board of directors seats among Taiwanese companies. The average leverage ratio of our sample is 42 percent, and the average ROA is 5.6 percent. We also note that family-owned companies account for 66 percent and firms audited by Big Four auditors account for 85 percent, of which the average tenure per auditing firm relationship is 14 years. Lastly, there are approximately 5 percent of sample firms audited by auditors possessing industry expertise. We also winsorize related variables in the sample at the 1% and 99% levels for each year to eliminate the possible outlier effect.
4.3 Correlation analysis
Table 3 reports the Pearson correlation coefficients among variables for the entire sample. We learn, by construct, that Abn_CFO, Abn_PROD, and
Abn_DISX are negatively, positively, and negatively correlated with REMI. In
addition, ROA is negatively correlated with REMI and Abn_PROD, but positively correlated with Abn_CFO and Abn_DISX. Suspect firms (Suspect) also exhibit a positive correlation with REMI. These correlation coefficients are relatively low and statistically significant. Our analysis indicates that Variance Inflation Factor (VIF) values of all independent variables are less than 2, suggesting the collinearity issue may not be a concern.
4.4 Main regression analysis
This research investigates the relationship between female directors and earnings management behavior. The main variables of interest include FEMnod,
FEMno, and FEMnor; the dependent variable is various measures of earnings
Table 2 Descriptive statistics
Variable N mean p25 p50 p75 std. dev.
Abn_CFO 3102 0.036 -0.023 0.038 0.093 0.121 Abn_PROD 3102 0.093 -0.040 0.111 0.230 0.290 Abn_DISX 3102 -0.003 -0.040 -0.019 0.013 0.069 REMI 3102 0.022 -0.335 0.206 0.622 1.103 ABS_DA 3102 0.065 0.022 0.048 0.087 0.065 DA 3102 -0.001 -0.051 -0.003 0.045 0.092 DA_POS 1506 0.065 0.022 0.047 0.087 0.072 DA_NEG 1596 -0.064 -0.087 -0.049 -0.022 0.058 FEMnod 3102 0.478 0 0 1 0.500 FEMno 3102 0.698 0 0 1 0.878 FEMnor 3102 0.100 0 0 0.15 0.132 Indsr 3102 0.111 0 0 0.286 0.153 Family 3102 0.661 0 1 1 0.473 Mgtsr 3102 0.125 0 0 0.2 0.154 Lev 3101 41.742 28.87 42.38 53.96 16.856 Size 3101 15.974 15.060 15.772 16.664 1.318 Sgrow 3101 9.326 -7.27 6.31 22.39 28.975 ROA 3101 5.604 1.89 5.21 9.16 7.096 GC 3102 0.003 0 0 0 0.054 Loss 3102 0.155 0 0 0 0.362 △E 3101 0.314 -0.815 -0.128 0.463 6.488 MTB 3101 1.656 0.900 1.36 2.060 1.109 Duality 3102 0.278 0 0 1 0.448 BigN 3101 0.852 1 1 1 0.355 Tenure 3102 13.794 9 14 19 6.654 Spec 3102 0.051 0 0 0 0.219 TRAN 3102 3.430 3 3 5 1.179 Suspect 3102 0.051 0 0 0 0.219 Suspect×FEMnod 3102 0.025 0 0 0 0.157 Note:
(1) Please see exhibit 1 for variable descriptions.
(2) Please see exhibit 2 for t-test of dependent variables.
Table 3
Pearson correlation matrix
1 2 3 4 5 6 7 8 9 10 11 12 13 14 15 16 17 18 19 20 21 22 23 24 25 26 1 REMI 1 2 Abn_CFO -.391** 1 3 Abn_PROD .515** .018 1 4 Abn_DISX -.900** .052** -.301** 1 5 ABS_DA .018 -.044* .005 -.001 1 6 DA -.095** .181** -.081** .010 .144** 1 7 FEMnod .035* -.030 .041* -.017 -.013 .023 1 8 FEMno .033 -.049** .016 -.014 -.022 .018 .830** 1 9 FEMnor .030 -.080** -.001 -.003 -.019 .009 .793** .935** 1 10 Indsr -.144** .098** -.194** .068** .048** -.011 -.052** -.058** -.051** 1 11 Family .109** -.113** .064** -.064** -.010 .049** .080** .057** .087** -.191** 1 12 Mgtsr -.078** .087** -.033 .048** .018 -.024 -.095** -.086** -.088** .023 -.114** 1 13 Lev .158** -.048** .303** -.070** .004 .056** -.001 -.009 -.004 -.089** .062** -.037* 1 14 Size .088** .291** .406** -.096** -.057** .005 .016 -.001 -.063** -.074** -.005 .029 .343** 1 15 Sgrow .016 .080** .120** -.013 .048** .017 -.005 -.024 -.019 .057** -.017 .020 .096** .084** 1 16 ROA -.181** .316** -.046** .071** -.020 -.037* -.047** -.065** -.066** .203** -.095** .090** -.256** .069** .327** 1 17 GC .045* -.023 .040* -.032 -.003 -.017 .020 .039* .030 .008 -.012 .019 -.019 -.003 .031 -.041* 1 18 Loss .137** -.219** .032 -.063** .002 -.117** .053** .035 .036* -.077** .094** -.067** .066** -.057** -.061** -.304** .110** 1 19 △E -.038* .085** -.015 .005 .035* .065** -.019 -.012 -.026 -.002 -.029 .029 -.027 -.046* .010 .011 -.027 -.192** 1 20 MTB -.201** .211** -.136** .110** .055** .008 -.005 -.024 -.027 .239** -.082** .055** -.105** .045* .242** .575** -.011 -.165** .003 1 21 Duality .028 -.078** -.026 -.009 .012 -.027 .100** .094** .135** -.020 -.005 -.025 -.039* -.076** -.026 -.041* -.020 .015 .006 -.038* 1 22 BigN -.084** .101** -.103** .024 -.045* -.029 -.038* -.053** -.045* .162** -.084** .086** -.038* .098** -.007 .133** -.045* -.048** .002 .126** -.018 1 23 Spec .005 .075** .033 -.028 .007 .038* -.030 -.019 -.055** -.010 -.068** -.002 .063** .235** .012 .016 -.012 -.046* .062** .059** .011 .071** 1 24 TRAN -.090** .168** .003 .038* -.053** -.024 -.078** -.074** -.124** .065** -.084** .050** -.035 .213** -.018 .114** -.035 -.095** .029 .045* -.049** .128** .130** 1 25 Suspect .041* -.024 .017 -.035 -.027 .002 .009 .009 .014 -.051** -.013 -.023 .040* .008 -.045* -.115** -.008 .078** .100** -.094** .025 -.058** -.016 -.047** 1 26 Suspect× FEMnod .034 -.027 .012 -.027 -.016 .017 .113** .096** .099** -.053** .001 -.035 .045* .000 -.045* -.082** -.006 .054** .026 -.061** .047** -.082** .002 -.055** .708** 1 N o te : P lea s e s e e ex h ib it 1 fo r v a r iab le d e s c r ip t io n s . *S ign if ic an t a t th e 1 0 % le v e l. * * S ign if ic a n t at th e 5% le v e l. * * *S ig n if ic an t at th e 1% le v e l. po ra te Ma nage m e n t R e v ie w V ol . 3 7 N o. 2, 20 17 55
management (AEM) and Abn_CFO, Abn_PROD, Abn_DISX, and REMI are proxies to measure real earnings management (REM), respectively. If the key variables of interest have a significantly negative correlation with REMI, or
ABS_DA suggests that female directors could constrain earnings management
behaviors. In order to avoid loss of many sample observations, we conduct a pooled cross section data, and perform OLS regression tests by controlling both year and industry fixed effects and by cluster firm to control within-firm serial correlation. We then report the heteroskedasticity-robust standard errors in cross-sectional applications to resolve concerns of cross-sectional heteroskedasticity, as this practice is being applied more in recent research work (Wooldridge, 2009).
Table 4 presents the regression results of ABS_DA earnings management. It shows that although FEMnod and FEMno are negatively related to DAs, the negative associations are not statistically significant. This indicates that a firm’s DA earnings management behaviors may not be directly affected specifically by
the appointment of female directors to the board. We find, however, FEMnor is
weakly but negatively associated with ABS_DA (p < 0.10).
We also find that ABS_DA in earnings management are negatively related to firm size (Size) and return on assets in previous year (ROA) (p < 0.01), as well as restrained by Big Four auditors (BigN) and more extensive information transparency (TRAN) (p < 0.05), which indicate larger firm, greater performance, and firms audited by big Four are less likely to engage in AEM. However,
ABS_DA are positively related to the increase of earnings changes (△E), MTB
ratio (p < 0.01), and auditor’s tenure (Tenure) (p < 0.1), which indicate firms with greater earnings change, higher growth opportunity, and longer auditors’ tenure present higher likelihood to AEM.
Our untabulated analysis also learns the results of upward (downward) earnings management—with respect to DA_POS (DA_NEG). It finds that three measures of female directors, FEMnod, FEMno and FEMnor, are negatively (positively) related to DA_POS (DA_NEG), but are not statistically significant. The only exceptional result is that FEMnor is positively associated with
DA_NEG in a marginal significant level (p < 0.10). This suggests that a firm’s upward earnings management behavior may not be directly affected by the
Table 4
Relationship between female directors (with respect to the presence, the number, and the proportion) and ABS_DA
in accrual-based earnings management (AEM)
DV=ABS_DA Coef. t Coef. t Coef. t
Intercept 0.091 *** 5.84 0.091 *** 5.85 0.093 *** 5.94 FEMnod -0.003 -1.09 FEMno -0.002 -1.65 FEMnor -0.018 * -1.94 Indsr 0.018 * 1.93 0.018 * 1.94 0.018 * 1.94 Family 0.000 -0.04 0.000 -0.05 0.000 0.03 Mgtsr 0.009 1.16 0.009 1.17 0.009 1.15 Lev 0.000 -0.59 0.000 -0.63 0.000 -0.6 Size -0.003 *** -2.9 -0.003 *** -2.91 -0.003 *** -2.98 Sgrow 0.000 1.22 0.000 1.22 0.000 1.21 ROA -0.001 *** -3.34 -0.001 *** -3.37 -0.001 *** -3.36 GC -0.015 -0.95 -0.014 -0.89 -0.014 -0.91 Loss -0.002 -0.48 -0.002 -0.49 -0.002 -0.49 △E 0.000 1.48 0.000 1.48 0.000 1.46 MTB 0.006 *** 3.45 0.006 *** 3.43 0.006 *** 3.41 Duality 0.003 1.17 0.003 1.21 0.003 1.31 BigN -0.008 ** -2.17 -0.008 ** -2.18 -0.007 ** -2.15 Tenure 0.000 * -1.84 0.000 * -1.84 0.000 * -1.83 Spec 0.008 0.78 0.008 0.78 0.008 0.77 TRAN -0.003 ** -2.35 -0.003 ** -2.37 -0.003 ** -2.42
Year dummy yes yes yes
Industry dummy yes yes yes
Adj R2 0.061
0.061 0.061
N 3101 3101 3101
Note:
Please see exhibit 1 for variable descriptions.
*
management behavior may be mitigated by a higher ratio of female directors sitting on the board (FEMnor).
Tables 5, 6, 7 provide empirical evidence on hypotheses of H2a, H2b, and
H2c that examine REM. Table 5 reports the results of relationship between the
presence of female directors (FEMnod) and REM metrics. The fourth column of Table 5, where dependent variable is the aggregate index (REMI), shows that our variable of interest on female directors presents a significant and negative association with the REM (coef = -0.101, p < 0.05). However, the third column (DV = Abn_DISX) presents a positive coefficient of 0.007 on FEMnod with a significant level of 5%. This finding implies that firms with female directors exhibit higher level of discretionary expenditures spending above the normal level by 0.7% of total assets in comparison to that of firms without the presentation of female director. This difference is economically large, given that the median of Abn_DISX variable is -1.9% (Table 2), and suggests that most firms have a reduction of discretionary expenditures below the normal level by 1.9% while firms with female directors have not done so.
However, we do not find a significant relationship between FEMnod and other REM proxies of Abn_CFO, Abn_PROD in Table 5. We argue that
Abn_PROD is not statistically significant, which may be due to overproduction
as a REM strategy is mainly available for firms in manufacturing industries. Our results conclude that, on average, firms with the presence of female directors have less real earnings management activities, and also present less practice on excessive reduction of discretionary expenditures, which support our H2a and
H2b.
Table 6 reports the results of the relationship between the number of female directors appointed to the board (FEMno) and REM metrics. In the third column of Table 6 (dependent variable is Abn_DISX), we find the coefficient of
FEMno is positive, and significantly related to Abn_DISX (coef = 0.003, p <
0.05). This implies that firm with more female directors have higher level of discretionary expenditures above the normal level with respect to that of firms without female directors on the board. In the fourth column (REMI), we learn
Table 5
Relationship between the presence of female directors and proxies of real earnings management (REM): with respect to the abnormal cash
flow from operations, the abnormal production costs, the abnormal discretionary expenditures, and the aggregate REM Index
DV= Abn_CFO Abn_PROD Abn_DISX REMI
Coef. t Coef. t Coef. t Coef. t Intercept -0.426 *** -14.32 -1.189 *** -18.89 0.070 *** 3.7 -0.782 *** -2.78 FEMnod 0.000 0.1 -0.008 -0.99 0.007 ** 2.58 -0.101 ** -2.54 Indsr 0.015 1.01 -0.152 *** -4.78 0.017 ** 2.44 -0.428 *** -3.62 Family -0.011 ** -2.56 -0.020 ** -2.51 -0.005 -1.49 0.070 1.63 Mgtsr 0.011 0.94 0.014 0.59 0.011 * 1.66 -0.160 -1.56 Lev 0.000 -0.53 0.001 *** 2.68 0.000 1.54 0.000 -0.22 Size 0.024 *** 13.24 0.080 *** 20.53 -0.006 *** -6.24 0.088 *** 5.81 Sgrow 0.000 -0.68 0.000 ** 2.08 0.000 * -1.65 0.001 1.43 ROA 0.003 *** 4.66 0.001 1.02 0.000 -0.17 -0.009 *** -2.97 GC 0.006 0.19 0.168 ** 2.3 -0.036 *** -3.37 0.610 *** 2.73 Loss -0.047 *** -8.53 0.037 *** 3.47 -0.011 *** -3.24 0.329 *** 6.99 △E 0.000 *** 4.37 0.000 *** 7.9 0.000 *** -3.95 0.000 ** 2.5 MTB 0.003 0.84 -0.023 *** -3.72 0.004 *** 3.65 -0.087 *** -4.67 Duality -0.009 ** -2.03 0.003 0.33 0.004 1.51 -0.016 -0.44 BigN -0.002 -0.35 -0.044 *** -3.8 0.000 -0.1 -0.036 -0.79 Tenure 0.001 ** 2.01 0.002 *** 3.64 -0.001 *** -4.4 0.010 *** 3.88 Spec -0.006 -0.73 -0.053 *** -2.93 -0.006 -0.76 0.036 0.35 TRAN 0.006 *** 3.47 -0.008 ** -2.06 0.002 ** 2.04 -0.057 *** -3.34 Year dummy
yes yes yes yes
Industry dummy
yes yes yes yes
Adj R2 0.283 0.498 0.179 0.282
N 3101 3101 3101 3101
Note:
Please see exhibit 1 for variable descriptions.
*
Table 6
Relationship between the number of female directors and proxies of real earnings management (REM): with respect to the abnormal cash flow from
operations, the abnormal production costs, the abnormal discretionary expenditures, and the aggregate REM Index.
DV= Abn_CFO Abn_PROD Abn_DISX REMI
Coef. t Coef. t Coef. t Coef. t Intercept -0.426 *** -14.31 -1.188 *** -18.90 0.070 *** 3.72 -0.783 *** -2.79 FEMno -0.002 -0.84 -0.007 -1.31 0.003 ** 2.28 -0.045 ** -2.09 Indsr 0.015 0.99 -0.152 *** -4.77 0.017 ** 2.37 -0.421 *** -3.55 Family -0.011 ** -2.54 -0.020 ** -2.53 -0.004 -1.42 0.067 1.56 Mgtsr 0.011 0.92 0.014 0.59 0.010 1.59 -0.154 -1.5 Lev 0.000 -0.57 0.001 *** 2.64 0.000 1.56 0.000 -0.23 Size 0.024 *** 13.26 0.080 *** 20.53 -0.006 *** -6.14 0.087 *** 5.71 Sgrow 0.000 -0.69 0.000 ** 2.08 0.000 * -1.67 0.001 1.44 ROA 0.003 *** 4.64 0.001 1.01 0.000 -0.15 -0.009 *** -2.98 GC 0.008 0.23 0.170 ** 2.34 -0.037 *** -3.49 0.624 *** 2.84 Loss -0.046 *** -8.52 0.037 *** 3.48 -0.011 *** -3.19 0.325 *** 6.97 △E 0.000 *** 4.45 0.000 *** 7.97 0.000 *** -4.02 0.000 ** 2.57 MTB 0.003 0.83 -0.023 *** -3.73 0.004 *** 3.67 -0.087 *** -4.68 Duality -0.008 * -1.94 0.003 0.37 0.004 1.58 -0.019 -0.51 BigN -0.002 -0.35 -0.044 *** -3.81 0.000 -0.07 -0.038 -0.82 Tenure 0.001 ** 2 0.002 *** 3.67 -0.001 *** -4.43 0.010 *** 3.92 Spec -0.006 -0.75 -0.053 *** -2.93 -0.006 -0.79 0.039 0.38 TRAN 0.006 *** 3.4 -0.008 ** -2.07 0.002 ** 1.99 -0.057 *** -3.29
Year dummy yes yes yes yes
Industry dummy yes yes yes yes
Adj R2 0.283 0.498 0.178 0.281
N 3101 3101 3101 3101
Note:
Please see exhibit 1 for variable descriptions.
*