科技部補助專題研究計畫成果報告
期末報告
財務困境對台灣股市資產定價異常現象之影響
計 畫 類 別 : 個別型計畫 計 畫 編 號 : NSC 102-2410-H-004-032- 執 行 期 間 : 102 年 08 月 01 日至 103 年 07 月 31 日 執 行 單 位 : 國立政治大學國際經營與貿易學系 計 畫 主 持 人 : 林信助 計畫參與人員: 碩士班研究生-兼任助理人員:林育慈 碩士班研究生-兼任助理人員:陳筱婷 大專生-兼任助理人員:劉允文 報 告 附 件 : 出席國際會議研究心得報告及發表論文 處 理 方 式 : 1.公開資訊:本計畫可公開查詢 2.「本研究」是否已有嚴重損及公共利益之發現:否 3.「本報告」是否建議提供政府單位施政參考:否中 華 民 國 103 年 09 月 25 日
中 文 摘 要 : 本計畫案研究財務困境對台灣股市資產定價異常現象之影 響。我們利用投資組合分組以及橫斷面迴歸兩種方式來檢 驗:依據資產定價異常現象所制訂交易策略之獲利性如何受 到財務困境(以信用評等來衡量)之影響。另外,我們採用 台灣經濟新報所建立的企業信用風險指標 (Taiwan
Corporate Credit Risk Index, TCRI) 來衡量財務困境,以 便觀察到台灣企業信用風險狀況的全貌。實證結果發現,依 據盈餘動能、規模、流動性以及特徵風險等異常定價效果所 建構的投資策略的獲利性,主要是來自於信用評等最差的公 司股票;而據價格動能、益本比等異常定價效果所建構的投 資策略的獲利性,則主要是來自於信用評等最好的公司股 票。另外,信用評等調降影響所有的異常定價投資策略之獲 利性,但影響程度各異。總結本計畫案之研究結果顯示:信 用風險在解釋異常定價效果投資策略獲利性之來源的確扮演 一個種要的角色,但並非所有的台灣股市資產定價異常現象 都與財務困境有關。 中文關鍵詞: 財務困境、資產定價異常、信用評等
英 文 摘 要 : This project studies the implications of financial distress for asset pricing anomalies existing in Taiwan`s security market. Specifically, the relations between financial distress and
profitability of various asset pricing anomalies-based trading strategies are carefully scrutinized using both portfolio sorts and cross-sectional regressions. To measured financial distress, I use the Taiwan Corporate Credit Risk Index (TCRI) issued by the Taiwan Economic Journal (TEJ), which offers a much better overview of corporate credit risks in Taiwan. My empirical investigation shows that profits of anomaly-based trading strategies, such as earning momentum, size, turnover, and idiosyncratic
volatility are mostly driven by firms with the worst credit rating. In contrast, profits of anomaly-based trading strategies, such as price momentum, and earnings-price ratio are mostly driven by firms with the best credit rating. In addition, credit rating downgrade affects all anomalies, but with different degrees. Overall, results of this research show that credit risk plays an important role in explaining the source of anomaly profits, yet not all asset pricing
anomalies are related to financial distress in Taiwan`s security market.
英文關鍵詞: Financial Distress; Asset Pricing Anomaly; Credit Rating
Implications of Financial Distress on Asset Pricing
Anomalies in Taiwan’s Security Market
Shinn-Juh Lin
Department of International Business
National Chengchi University
September 24, 2014
Abstract
This project studies the implications of financial distress for asset pricing anomalies existing in Taiwan’s security market. Specifically, the relations between financial dis-tress and profitability of various asset pricing anomalies-based trading strategies are carefully scrutinized using both portfolio sorts and cross-sectional regressions. To measured financial distress, I use the Taiwan Corporate Credit Risk Index (TCRI) issued by the Taiwan Economic Journal (TEJ), which offers a much better overview of corporate credit risks in Taiwan. My empirical investigation shows that prof-its of anomaly-based trading strategies, such as earning momentum, size, turnover, and idiosyncratic volatility are mostly driven by firms with the worst credit rating. In contrast, profits of anomaly-based trading strategies, such as price momentum, and earnings-price ratio are mostly driven by firms with the best credit rating. In addition, credit rating downgrade affects all anomalies but with different degrees. Overall, results of this research show that credit risk plays an important role in explaining the source of anomaly profits, yet not all asset pricing anomalies are related to financial distress in Taiwan’s security market.
JEL Classification: G11; G12; G14.
1
Introduction
According to rational asset-pricing theory, higher risk should be accompanied by higher expected return. However, there exist many asset pricing anomalies in the empirical stud-ies of cross-sectional stock returns. In addition to systematic risk factors, cross-sectional stock returns are reported to be positively related to past returns (price momentum effect, Jegadeesh and Titman, 1993), past earning (earnings momentum effect, Ball and Brown, 1968), book-to-market ratio (value effect, Fama and French, 1992); and negatively re-lated to firm size (Fama and French, 1992), accruals (Sloan, 1996), credit risk (Dichev, 1998; Campbell, Hilscher, and Szilagyi, 2008; Avramov, Chordia, Jostova, and Philipov, 2009), analysts’ earning forecast (Diether, Malloy, and Scherbina, 2002), capital invest-ment (Titman, Wei, and Xie, 2004), asset growth (Cooper, Gulen, and Schill, 2008), and idiosyncratic volatility (Ang, Hodrick, Xing, and Zhang, 2006).
Fama and French (1993) argue that the size factor (small-minus-big, SMB) and the value factor (high-minus-low, HML) are proxies for priced distress factor. On the other hand, Daniel and Titman (1997) suggest that it is the size and value characteristics, instead of factor loadings on the SMB and the HML factors, that affect stock returns, which echoes the existence of asset pricing anomalies. According to these two articles, there seems to exist some connection between financial distress and asset pricing anoma-lies. Following the same line of reasoning, Avramov et al. (2013) examine all US firms listed on NYSE, Amex, and Nasdaq, and find that strategies based on price momentum, earnings momentum, credit risk, dispersion, idiosyncratic volatility, and capital invest-ment derive their profitability from taking short positions in high credit risk firms that experience deteriorating credit conditions. In contrast, the value-based strategy derives most of its profit from taking long positions in high credit risk firms that survive financial distress and subsequently realize high returns.
This project proposes to study the implications of financial distress for asset pricing anomalies existing in Taiwan’s security market. Specifically, I would like to examine how the profitability of anomaly-based trading strategies are affected by financial distress (measured by corresponding credit ratings). Not only because this topic has not yet been comprehensively studied (other than Avramov et al., 2013), but also because there exist different kinds of significant asset pricing anomalies, and different credit risk rating system in Taiwan’s security market.
In Taiwan’s security market, future stock returns are positively related to price mo-mentum (Li, Luo and Su, 2006; Hung, Lin and Liu, 2007; Wang, Zu and Wang , 2010), earnings momentum (Ku, 2011; Ko, Lin, Peng and Chang, 2012), and earnings-price ra-tio (Hung and Lei, 2002). Further, stock returns are negatively related to firm size(Lu and Lee, 2008), turnover (Chou, Chang and Lin, 2007; Chang and Wang, 2013), and idiosyncratic volatility (Huang, Lu, Huang and Chang, 2010). In contrast, asset growth (Ko, Jiang, Lin, and Chang,2012), and value (Mukherji, Dhatt, and Kim, 1997; Chen and Zhang,1998; Chui and Wei, 1998; Ding, Chua, and Fetherston,2005) are insignificantly in Taiwan security market. This project focuses only on examining those significant asset pricing anomalies.
Unlike Avramov et al. (2013), who adopt the long-term issuer credit ratings issued by the Standard and Poor’s (S&P) to measure financial distress and credit risk faced by firms, this project proposes to use the Taiwan Corporate Credit Risk Index (TCRI) issued by the Taiwan Economic Journal (TEJ), instead. The main reason for doing so is because rating services offered by the three internationally renowned credit rating agencies, S&P, Moody’s and Fitch are solicited from participating members only. As a consequence, not all listed/public Taiwanese firms are rated by these credit rating agencies. In contrast, the TCRI issued by the TEJ offers unsolicited rating services, which implies that all Taiwanese listed/public firms are ranked by this credit rating agency. Therefore, ratings based on the TCRI offer a much better overview of corporate credit risks in Taiwan. With this rating data, Chu et al. (2012) document a significantly positive premium between best-and worst-rated stocks in both portfolios best-and individual stocks, best-and demonstrate that such premium cannot be explained by well-known asset-pricing models, which include the CAPM, Fama and French’s (1993) three-factor model, and Liu’s (2006) liquidity-augmented CAPM. This project further examines how credit ratings and the associated rating downgrades affect profits of anomaly-based trading strategies in Taiwan’s security market.
Another feature that differentiates this project from Avramov et al. (2013) is the adoption of the errors-in-variables (EIV)-free approach proposed by Brennan, Chordia and Subrahmanyam (1998) to adjust individual stock returns for systematic risk. Avramov et al. (2013), as in Fama and French(2008), subtract the monthly return of the matching size and BM portfolio from each individual monthly stock return to obtain the stock’s size- and BM-adjusted return. Instead, the EIV approach avoids relying on the portfolio grouping procedure, retains information embedded in individual securities, and hence more accurately describes profits of corresponding anomaly-based trading strategies. In
addition, we consider both Fama and French (1993) three factors model, and Carhart (1997) four factors model in adjusting for systematic risk.
My empirical investigation, based on both portfolio sorts and cross-sectional regres-sions, shows that the profitability of strategies based on earnings momentum, size, turnover, and idiosyncratic volatility is concentrated in the worst-rated stocks. Their profitability disappears when firms rated 4 or above (5-10) are excluded from the investment universe. In contrast, profitability of strategies based on price momentum, and earnings-price ratio is concentrated in stocks with better credit ratings. After excluding observations from six months before to six months after a downgrade, profitability of strategies based on price momentum, earnings momentum, earnings-price ratio, turnover, idiosyncratic volatility are all affected, but with different degrees. Overall, results of this research show that credit risk plays an important role in explaining the source of anomaly profits, yet not all asset pricing anomalies are related to financial distress in Taiwan’s security market.
This report proceeds as follows. The next section discusses the methodology and the data. Section 3 presents the empirical results, and Section 4 concludes.
2
Methodology
2.1
Analysis with Portfolio Sorts
The TCRI assigns to each individual stock an integer rank between 1 and 10, with 1 representing the best-rated stocks, and 10 representing worst-rated stocks. Furthermore, each season, all stocks rated by the TCRI issued by the TEJ are divided into terciles based on their credit ratings. The best-rated group, C1, includes stocks with ratings from 1 to
3; the medium-rated group, C2, includes stocks with ratings from 4 to 7; and the
worst-rated group, C3, includes stocks with ratings from 8 to 10. Within each tercile and in
each month t, stocks are sorted into quintile portfolios according to the anomaly-specific conditioning variable (for example, firm size). P1 (P5) denotes the portfolio containing
stocks with the lowest (highest) value of the conditioning variable.
Each anomaly-based trading strategy involves buying one of the extreme portfolios (P1 or P5), selling the opposite extreme portfolio (P5 or P1), and holding both portfolios
tiny (microcap) stocks that account for a very low fraction of the market capitalization but a vast majority of the stocks in the extreme anomaly-sorted portfolios. In contrast, value-weighted returns can be dominated by a few big stocks. Separately, either case could result in an unrepresentative picture of the importance of an anomaly. Thus, equally-and value-weighted average portfolio returns will both be calculated equally-and studied in this project. While this methodology applies to all strategies, strategies differ with respect to their conditioning variables and their holding periods that are consistent with the literature for each anomaly. For example, the price momentum strategy is constructed as in Jegadeesh and Titman (1993). Stocks are sorted on their cumulative return over the formation period (months t− 6 to t − 1). The momentum strategy involves buying the winner portfolio (P5), selling the loser portfolio (P1), and holding both positions for six
months (t + 1 to t + 6). We skip a month between the formation and holding periods to avoid the potential impact of short-run reversal.
Once individual stocks are sorted according to the corresponding risk group and anomaly-specific conditioning variable, the profitability of each anomaly-based trading strategy can be computed as the return differentials, P5 − P1 or P1 − P5 for each risk
group. Several interesting issues can then be examined. First of all, we can examine whether the profitability of each anomaly-based trading strategy are significantly differ-ent among differdiffer-ent risk groups (C1, C2, and C3.) Second, to further ascertain whether
the worst-rated stocks are driving anomalies profits (Avramov et al., 2013), we will re-peat the above portfolio sorts analysis by sequentially excluding the worst-rated stocks from our investment universe. Furthermore, we can examine whether credit rating down-grades have any impact on the profitability of each anomaly-based trading strategy by excluding returns around rating downgrades (six months before and after a downgrade was recorded).
2.2
Regression Analysis
Next, we examine how the profitability of each anomaly-based trading strategy are affected by financial distress (measured by credit risk group to which each stock belongs) using individual stocks rather than portfolios. By examining individual stocks, we can avoid data-snooping biases that are usually inherent in portfolio-based approaches, as noted by Lo and MacKinlay (1990). Furthermore, without relying on the portfolio grouping procedure, statistical tests retain information embedded in individual securities.
To do this, we apply an errors-in-variables (EIV)-free approach proposed by Brennan, Chordia and Subrahmanyam (hereafter BCS, 1998). The methodology is briefly described as follows. First, for each year, the factor loadings, βj,k, of some asset pricing model (for example, Fama and French’s, 1993, three factor model) are estimated for all securities that have at least 24 return observations over the previous 60 months. The estimated risk-adjusted return of each security, ˜R∗jt, for each month of the following year is then calculated as: ˜ R∗jt ≡ ˜Rjt− Rf t− L ∑ k=1 ˆ βjkF˜kt, (1)
for all j. The risk-adjusted returns from Equation (1) are then used to test whether different credit risk groups and anomaly-specific conditioning variables can describe the cross-sectional variation in expected returns. As in Avramov et al. (2013), we first run the Fama-MacBeth cross-sectional regressions for the entire sample (all rated) and the three tercile sub-samples as follows:
˜ R∗jt = c0t+ M ∑ m=1 cmtZmjt−lag+ ˜ejt, (2)
where Zmjt−lag (m = 1, . . . , M ) is the value of anomaly-specific conditioning variable for stock j in month t-lag, and cmt is the premium per unit of anomaly-specific conditioning variable m in month t.1
To access how rating downgrade and credit risk group, Ci, affect the profitability of the pricing anomalies, we extend the estimation model as follow:
˜ R∗jt = c0t+ dtDG + M ∑ m=1 cmtZmjt−lag+ 3 ∑ i=2 ( M ∑ m=1
δimtCijq−1Zmjt−lag) + ˜ejt, (3) where DG is a dummy variable which equals to 1 over a period that extends from six months prior to six months after a rating downgrade; Cijq−1 is a dummy variable which equals to 1, if, at the end of previous quarter (q-1), stock j is categorized into credit risk group Ci; δimt measures extra credit-risk premiums in month t for stocks which have anomaly-specific conditioning variable equals to Zmjt−lag and are categorized into credit risk group Ci. After running those models in Equation (2) and (3) for all t, we can com-pute the time-series average of cross-sectional regression coefficients with their associated
1The choice of Z
mjt−lag is anomaly-specific. For example, for the price momentum effect, the
accu-mulative return of the previous six month (month t-6 to t-1) is used as one of the explanatory variable on the right hand side of Equation (2).
sample t-statistics. Consequently, a significant average dt and δimt would indicate that rating downgrade and credit rating have significant impact on the profitability of pricing anomalies.
2.3
Data
Our sample consists of credit ratings, monthly returns and firm characteristics of common stocks listed on the Taiwan Stock Exchange for the period from January 1996 to December 2012. All required data can be retrieved from the TEJ.
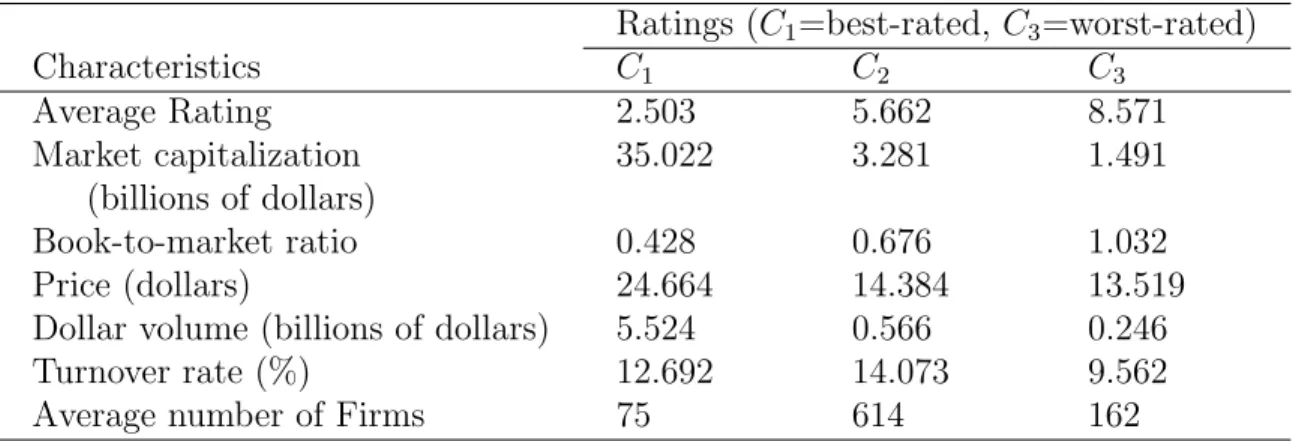
Table 1: Stock characteristics by credit rating tercile
Each season, all stocks rated by the TCRI issued by the TEJ are divided into terciles based on their credit rating. The best-rated group, C1, includes stocks with ratings
from 1 to 3; the medium-rated group, C2, includes stocks with ratings from 4 to 7;
and the worst-rated group, C3, includes stocks with ratings from 8 to 10. For each
tercile, we compute the cross-sectional median characteristic for each month. The sample period is January 1996 to December 2012. This table reports the time series average of these monthly medians.
Ratings (C1=best-rated, C3=worst-rated)
Characteristics C1 C2 C3 Average Rating 2.503 5.662 8.571 Market capitalization 35.022 3.281 1.491 (billions of dollars) Book-to-market ratio 0.428 0.676 1.032 Price (dollars) 24.664 14.384 13.519
Dollar volume (billions of dollars) 5.524 0.566 0.246
Turnover rate (%) 12.692 14.073 9.562
Average number of Firms 75 614 162
Summary statistics are reported in Table 1. Worse-rated firms tend to be smaller. The average market capitalization of the best-rated (C1) stocks is $35 billion, and that of
the worst-rated (C3) is $1.49 billion. The book-to-market ratio increases monotonically
from 0.428 in C1 to 1.032 in C3. The average stock price decreases monotonically from
$24.7 in C1 to $13.5 in C3. The worst-rated firms are considerably less liquid than the
best-rated firms. The average monthly dollar trading volume decreases from $5524 million for the best-rated (C1) to $246 million for the worst-rated (C3) stocks. These statistics
are consistent with those in Avramov et al. (2013). In other words, firms with better credit ratings tend to be bigger in market capitalizations, higher price, and more liquid.
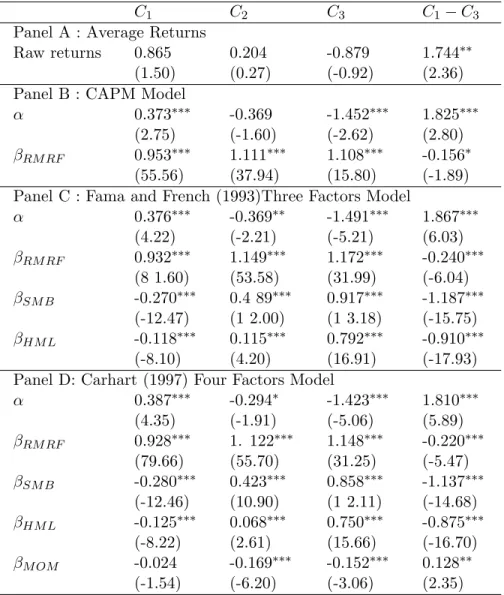
And, as reported in Table 2, worse-rated stocks have more systematic risk and earn lower risk-adjusted returns than better-rated stocks. More specifically, market betas (βRM RF) increase monotonically from the best-rated (C1) to the worst-rated (C3) stocks,
in all three asset pricing models. βSM B and βHM L in both the Fama and French (1993) three-factor model, and the Carhart (1997) four-factor model also increase monotonically from C1 stocks to C3 stocks. However, αs in all three asset pricing models decrease
mono-tonically from C1 stocks to C3 stocks. This can also be seen from the significant αs of
the arbitrage portfolios (C1− C3) for all three asset pricing models. Such evidence is
con-sistent with Chu et al. (2012), who document a significantly positive premium between best- and worst-rated stocks, and demonstrate that such premium cannot be explained by well-known asset-pricing models.
3
Empirical Results
3.1
Portfolio Sorts
Table 3 presents for each anomaly monthly returns for the extreme portfolios, P1 and
P5, as well as return differentials, P5 − P1 or P1− P5. We first examine anomaly-based
profitability for all rated firms based on equally-weighted returns in Panel A. For all-rated portfolios, profitability of strategies based on earning momentum, turnover, and idiosyncratic volatility are significant. We next partition the sample into best-rated (C1),
medium-rated (C2), and worst-rated (C3) stocks. For the C1 tercile, profitability of
strate-gies based on price momentum, and earning-price ratio are significant; for the C2 tercile,
profitability of strategies based on earning momentum, size, and turnover are significant; For the C3 tercile, profitability of strategies based on earning momentum, size, turnover,
and idiosyncratic volatility are significant; Results based on value-weighted returns (as reported in Panel B) are largely similar to those based on equally-weighted returns. In short, based on these results, strategies based on price momentum, and earning-price ratio seem to derive their profitability from the best-rated stocks; while strategies based on earning momentum, size, turnover, and idiosyncratic volatility seem to derive their profitability from the worst-rated stocks. The evidence suggests that credit risk plays an important role in explaining the source of anomaly profits.
Table 2: Stock alphas and betas by credit rating tercile.
Each season, all stocks rated by the TCRI issued by the TEJ are divided into terciles based on their credit rating. The best-rated group, C1, includes stocks with ratings from 1 to 3; the medium-rated group, C2, includes stocks
with ratings from 4 to 7; and the worst-rated group, C3, includes stocks with ratings from 8 to 10. For each
tercile, we compute the cross-sectional median characteristic for each month. The sample period is January 1996 to December 2012. This table reports capital asset pricing model(CAPM), Fama and French (1993), and Carhart (1997) alphas and betas from time series regressions of the credit risk tercile portfolio excess returns on the factor returns. t-statistics are in parentheses. * denotes significance at the 10% level, ** denotes significance at the 5% level, and *** denotes significance at the 1% level.
C1 C2 C3 C1− C3
Panel A : Average Returns
Raw returns 0.865 0.204 -0.879 1.744∗∗
(1.50) (0.27) (-0.92) (2.36)
Panel B : CAPM Model
α 0.373∗∗∗ -0.369 -1.452∗∗∗ 1.825∗∗∗
(2.75) (-1.60) (-2.62) (2.80)
βRM RF 0.953∗∗∗ 1.111∗∗∗ 1.108∗∗∗ -0.156∗
(55.56) (37.94) (15.80) (-1.89)
Panel C : Fama and French (1993)Three Factors Model
α 0.376∗∗∗ -0.369∗∗ -1.491∗∗∗ 1.867∗∗∗ (4.22) (-2.21) (-5.21) (6.03) βRM RF 0.932∗∗∗ 1.149∗∗∗ 1.172∗∗∗ -0.240∗∗∗ (8 1.60) (53.58) (31.99) (-6.04) βSM B -0.270∗∗∗ 0.4 89∗∗∗ 0.917∗∗∗ -1.187∗∗∗ (-12.47) (1 2.00) (1 3.18) (-15.75) βHM L -0.118∗∗∗ 0.115∗∗∗ 0.792∗∗∗ -0.910∗∗∗ (-8.10) (4.20) (16.91) (-17.93)
Panel D: Carhart (1997) Four Factors Model
α 0.387∗∗∗ -0.294∗ -1.423∗∗∗ 1.810∗∗∗ (4.35) (-1.91) (-5.06) (5.89) βRM RF 0.928∗∗∗ 1. 122∗∗∗ 1.148∗∗∗ -0.220∗∗∗ (79.66) (55.70) (31.25) (-5.47) βSM B -0.280∗∗∗ 0.423∗∗∗ 0.858∗∗∗ -1.137∗∗∗ (-12.46) (10.90) (1 2.11) (-14.68) βHM L -0.125∗∗∗ 0.068∗∗∗ 0.750∗∗∗ -0.875∗∗∗ (-8.22) (2.61) (15.66) (-16.70) βM OM -0.024 -0.169∗∗∗ -0.152∗∗∗ 0.128∗∗ (-1.54) (-6.20) (-3.06) (2.35)
Table 3: Profits from asset pricing anomalies in rated firms.
Stocks are sorted into best- (C1), medium- (C2), and worst-rated (C3) terciles, based on their TCRI credit rating.
Within each subsample, stocks aresorted into quintile portfolios based on the conditioning variable of each specific anomaly, as noted in the column heading.“PMOM” refers to price mementum; “EMOM” to earnings momen-tum“EP” to earnings-price ratio; “Size” to market capitalization; “TO” to turnover; and “IV” to the idiosyncratic volatility. The line“Strategy” presents the net profit from the long and short positions, i.e. P5− P1 or P1− P5,
depending on the anomaly. Panel A (B) provides the average monthly equally- (value-) weighted anomaly returns. The sample period is January 1996 to December 2012. Numbers in the parentheses are the t-statistics calculated using the Newey-West (1987) robust standard errors. ∗denotes significance at the 10% level,∗∗denotes significance at the 5% level, and∗∗∗denotes significance at the 1% level.
Panel A: Equally weighted returns
Subsample Portfo1io PMOM EMOM EP Size TO IV All Rated P1 0.457 -0.043 0.694 1.141 0.903 0.579 P5 0.604 1.066 1.345 0.416 -0.209 -0.150 Strategy 0.147 1.109∗∗∗ 0.651 0.725 1.111∗∗ 0.729∗ (0.32) (5.12) (1.27) (1.46) (2.27) (1.74) C1 P1 0.506 0.743 0.161 1.114 0.794 0.518 P5 1.289 1.339 1.811 0.980 0.986 1.022 Strategy 0.783∗ 0.597 1.649∗∗∗ 0.133 -0.192 -0.505 (1.72) (1.49) (4.18) (0.32) (-0.34) (-1.15) C2 P1 0.484 0.147 0.765 1.294 0.906 0.628 P5 0.621 1.273 1.041 0.223 -0.218 -0.040 Strategy 0.138 1.125∗∗∗ 0.277 1.071∗∗∗ 1.124∗∗ 0.668 (0.39) (4.97) (0.88) (2.69) (2.49) (1.62) C3 P1 0.175 -1.195 1.173 1.667 0.445 0.262 P5 -0.106 0.604 0.238 -0.786 -1.302 -0.735 Strategy -0.281 1.799∗∗∗ -0.935 2.453∗∗∗ 1.748∗∗ 0.996∗ (-0.46) (3.58) (-1.63) (4.14) (2.58) (1.71)
Panel B: Value-weighted returns
Subsample Portfo1io PMOM EMOM EP Size TO IV All Rated P1 0.222 0.180 -0.042 0.990 0.294 0.186 P5 0.489 0.672 1.301 0.571 0.114 -0.143 Strategy 0.266 0.492 1.343∗∗ 0.419 0.180 0.329 (0.48) (1.36) (2.44) (0.78) (0.29) (0.52) C1 P1 0.646 0.847 0.110 1.047 0.565 -0.059 P5 0.918 0.847 1.904 0.971 0.943 0.849 Strategy 0.272 0.000 1.794∗∗∗ 0.075 -0.379 -0.908∗ (0.57) (-0.00) (3.28) (0.17) (-0.57) (-1.66) C2 P1 0.004 -0.164 0.139 1.240 0.337 0.062 P5 0.329 1.066 0.784 0.046 -0.224 0.057 Strategy 0.325 1.231∗∗∗ 0.646∗ 1.194∗∗∗ 0.560 0.005 (0.72) (3.59) (1.69) (2.69) (1.08) (0.01) C3 P1 -1.401 -1.58 -0.213 1.374 -0.288 -0.162 P5 -0.649 -0.177 -0.510 -1.268 -1.619 -3.148 Strategy 0.752 1.404∗∗∗ -0.297 2.642∗∗∗ 1.331 2.986∗∗∗ (0.92) (2.01) (-0.39) (4.33) (1.44) (4.04)
To further pinpoint the segment of firms driving the anomalies’ profits, we show in Table 4 various credit rating sub-samples as we sequentially exclude the worst-rated stocks from our investment universe. It can be seen that positive profits of turnover- and idiosyncratic-based strategies turn negative as worse-rated stocks are excluded from the sub-samples. Strategy based on price momentum does not seem to yield significant posi-tive profit in all sub-sample. In contrast, strategy based on earning-price ratio still gen-erate significant positive profit as worse-rated stocks are excluded from the sub-samples. For strategies based on other anomalies (earning momentum and size), profitability grad-ually disappear as worse-rated stocks are excluded from the sub-samples. These patterns are quite similar for equally-weighted (Panel A) and value-weighted (Panel B) returns. Therefore, unlike Avramov et al. (2013), sequentially excluding the worst-rated stocks does not seem to explain the profitability of anomaly-based strategies in a systematic way. However, the profitability of strategies based on earnings momentum, size, turnover, and idiosyncratic volatility is concentrated in the worst-rated stocks, and their profitability disappears when firms rated 4 or above (5-10) are excluded from the investment universe.
3.2
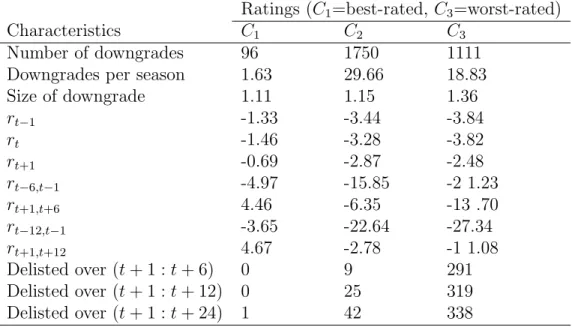
Credit rating downgrades
Table 5 presents the number and size of rating downgrades, as well as returns around downgrades, for the credit risk-sorted terciles. Downgrades are more frequent and larger in magnitude among lower-rated stocks. The price impact around downgrades is con-siderably larger for worst- versus best-rated stocks. Table 5 also shows that, following downgrades, de-listings are much more likely among lower-rated stocks.
Table 4: Profits from asset pricing anomalies in decreasing subsamples of rated firms.
This table reports profits from anomaly-based trading strategies as in Table 3, as we sequentially eliminate the worst-rated stocks. Stocks are eliminated before anomaly-based portfolios are formed each month. Once included in a portfolio, a stock stays in that portfolio throughout the holding period even if it is subsequently downgraded. The first column specifies the range of ratings included in the corresponding subsample. The last two columns report the percentage of rated firms, Firm(%), and of ratio market capitalization to the entire market, Cap(%), represented by each subsample. The column headings identifying each anomaly are defined in Table 3. The reported anomaly profits are based on equally- (Panel A) and value-weighted (Panel B) returns. The sample period is January 1996 to December 2012. Numbers in the parentheses are the t-statistics calculated using the Newey-West (1987) robust standard errors. ∗denotes significance at the 10% level,∗∗ denotes significance at the 5% level, and∗∗∗ denotes significance at the 1% level.
Panel A: Equally-weighted returns
Rating PMOM EMOM EP Size TO IV Firm(%) Cap(%) 1-10 0.147 1.109∗∗∗ 0.651 0.725 1.111∗∗ 0.729∗ 100.00 100.00 (0.32) (5.12) (1.27) (1.46) (2.27) (1.74) 1-9 0.127 0.946∗∗∗ 0.559 0.796∗ 1.042∗∗ 0.563 94.92 99.75 (0.32) (4.65) (1.38) (1.81) (2.23) (1.38) 1-8 0.197 0.999∗∗∗ 0.593 0.791∗ 1.102∗∗ 0.592 89.64 99.25 (0.50) (4.70) (1.50) (1.89) (2.14) (1.47) 1-7 0.239 1.034∗∗∗ 0.730∗ 0.702∗ 0.971∗∗ 0.540 80.98 98.65 (0.62) (4.71) (1.92) (1.69) (2.01) (1.31) 1-6 0.324 0.923∗∗∗ 0.845∗∗ 0.530 0.822∗ 0.544 66.67 97.88 (0.86) (4.00) (2.41) (1.37) (1.70) (1.30) 1-5 0.521 1.039∗∗∗ 1.004∗∗∗ 0.358 0.691 0.357 42.94 97.11 (1.37) (4.38) (3.07) (0.97) (1.45) (0.86) 1-4 0.781∗ 0.898∗∗∗ 1.340∗∗∗ 0.421 0.162 0.012 21.83 95.82 (1.96) (3.55) (3.95) (1.15) (0.34) (0.03) 1-3 0.783∗ 0.597 1.649∗∗∗ 0.133 -0.192 -0.505 8.80 93.11 (1.72) (1.49) (4.18) (0.32) (-0.34) (-1.15) 1-2 0.903∗ 0.469 1.807∗∗∗ 0.407 -0.539 -0.788 4.25 85.03 (1.75) (1.00) (4.44) (0.96) (-0.76) (-1.53) 1 0.052 0.122 1.336∗ 0.094 -0.439 -0.269 1.55 61.67 (0.10) (0.19) (1.67) (0.16) (-0.62) (-0.47)
Panel B: Value-weighted returns
Rating PMOM EMOM EP Size TO IV Firm(%) Cap(%) 1-10 0.266 0.492 1.343∗∗ 0.419 0.180 0.329 100.00 100.00 (0.48) (1.36) (2.44) (0.78) (0.29) (0.52) 1-9 0.169 0.443 1.245∗∗∗ 0.564 0.191 0.100 94.92 99.75 (0.33) (1.22) (2.48) (1.13) (0.31) (0 .17) 1-8 0.228 0.462 1.390∗∗∗ 0.588 0.260 0.043 89.64 99.25 (0.45) (1.26) (2.76) (1.22) (0.42) (0.07) 1-7 0.240 0.425 1.557∗∗∗ 0.490 0.267 -0.060 80.98 98.65 (0.49) (1.12) (3.39) (1.04) (0.43) (-0.10) 1-6 0.281 0.379 1.702∗∗∗ 0.357 0.138 -0.120 66.67 97.88 (0.60) (0.98) (4.06) (0.82) (0.22) (-0.20) 1-5 0.363 0.358 1.617∗∗∗ 0.216 0.086 -0.308 42.94 97.11 (0.78) (0.89) (3.54) (0.52) (0.14) (-0.57) 1-4 0.424 0.300 1.685∗∗∗ 0.223 -0.127 -0.478 21.83 95.82 (0.91) (0.65) (3.49) (0.58) (-0.20) (-0.85) 1-3 0.272 0.000 1.794∗∗∗ 0.075 -0.379 -0.908∗ 8.80 93.11 (0.57) (-0.00) (3.28) (0.17) (-0.57) (-1.66) 1-2 0.721 0.176 1.770∗∗∗ 0.425 -0.362 -1.395∗∗ 4.25 85.03 (1.36) (0.28) (3.12) (0.99) (-0.48) (-2.18) 1 0.064 -0.103 1.533∗∗ 0.057 -0.507 -0.519 1.55 61.67 (0.13) (-0.15) (2.02) (0.09) (-0.61) (-0.85)
Table 5: Downgrades, returns, and delistings by credit rating groups.
The table focuses on stocks with at least one downgrade at the beginning of the month. We analyze downgrades by credit rating tercile, sorted on firm rating. We report number of firms dowgraded per season, average scale of downgrades, aver-age returns, and number of firms delisted. The sample period is January 1996 to December 2012.
Ratings (C1=best-rated, C3=worst-rated)
Characteristics C1 C2 C3
Number of downgrades 96 1750 1111
Downgrades per season 1.63 29.66 18.83
Size of downgrade 1.11 1.15 1.36 rt−1 -1.33 -3.44 -3.84 rt -1.46 -3.28 -3.82 rt+1 -0.69 -2.87 -2.48 rt−6,t−1 -4.97 -15.85 -2 1.23 rt+1,t+6 4.46 -6.35 -13 .70 rt−12,t−1 -3.65 -22.64 -27.34 rt+1,t+12 4.67 -2.78 -1 1.08 Delisted over (t + 1 : t + 6) 0 9 291 Delisted over (t + 1 : t + 12) 0 25 319 Delisted over (t + 1 : t + 24) 1 42 338
Table 6 repeats the analysis from Table 3, but focuses on periods of stable or improving credit conditions. Specifically, for each downgraded stock, we exclude observations from six months before to six months after a downgrade. By comparing results presented in those two tables, we find that profitability of strategies based on price momentum, earnings momentum, earnings-price ratio, turnover, idiosyncratic volatility are all affected, but with different degrees. Again, such results are different from those presented in Avramov et al. (2013), but is consistent with Chu et al. (2013), which reports that credit rating downgrade only have limited impact on stock returns.
3.3
Cross-sectional Regression analysis
In this subsection, we scrutinize the asset pricing anomalies using cross-sectional regres-sion analysis. First, for each month, we estimate the cross-sectional regresregres-sion model in
Table 6: Impact of Downgrades on Profits from Asset-Pricing Anomalies.
We repeat the analysis in Table 3 after removing return observations from six months prior to six months after a downgrade. The column headings are defined in Table 3. The reported anomaly profits are based on equally-(Panel A) and value-weighted equally-(Panel B) returns. The sample period is January 1996 to December 2012. Numbers in the parentheses are the t-statistics calculated using the Newey-West (1987) robust standard errors. ∗denotes significance at the 10% level,∗∗denotes significance at the 5% level, and∗∗∗denotes significance at the 1% level.
Panel A: Equally-weighted returns
Subsample Portfo1io PMOM EMOM EP Size TO IV All Rated P1 1.016 0.332 0.985 1.430 1.184 0.879 P5 0.913 1.296 1.668 0.855 0.431 0.392 Strategy -0.103 0.964∗∗∗ 0.684 0.575 0.754 0.488 (-0.23) (4.11) (l.l7) (1.10) (1.48) (1.12) C1 P1 0.806 0.964 0.422 1.516 0.972 0.720 P5 1.461 1.391 2.040 1.077 1.442 1.357 Strategy 0.655 0.428 1.619∗∗∗ 0.439 -0.469 -0.636 (1.35) (1.00) (3.89) (l.l2) (-0.79) (-1.39) C2 P1 1.003 0.637 1.207 1.682 1.322 0.923 P5 0.843 1.448 1.272 0.560 0.164 0.488 Strategy -0.160 0.811∗∗∗ 0.065 1.123∗∗∗ l.l58∗∗ 0.435 (-0.48) (3.47) (0.20) (2.75) (2.56) (1.04) C3 P1 0.936 -0.192 1.430 1.899 0.612 0.930 P5 0.437 1.005 1.055 0.187 -0.184 0.056 Strategy -0.498 l.l97∗∗ -0.375 1.713∗∗∗ 0.796 0.874 (-0.85) (2.18) (-0.59) (2.71) (1.16) (1.33)
Panel B: Value-weighted returns
Subsample Portfo1io PMOM EMOM EP Size TO IV All Rated P1 0.734 0.589 0.647 1.318 0.563 0.464 P5 0.727 0.820 1.555 0.870 0.701 0.380 Strategy -0.006 0.231 0.908 0.448 -0.138 0.084 (-0.01) (0.56) (1.58) (0.83) (-0.22) (0.13) C1 P1 0.836 1.081 0.187 1.413 0.788 0.084 P5 1.083 0.971 1.986 1.074 1.228 1.138 Strategy 0.247 -0.109 1.799∗∗∗ 0.340 -0.440 -1.054∗ (0.51) (-0.19) (3.10) (0.81) (-0.64) (-1.85) C2 P1 0.515 0.328 0.668 1.637 0.965 0.467 P5 0.521 1.220 1.103 0.463 0.214 0.523 Strategy 0.006 0.992∗∗∗ 0.435 1.174∗∗∗ 0.751 -0.056 (0.01) (2.70) (1.16) (2.62) (1.44) (-0.09) C3 P1 -0.230 -0.243 0.686 1.588 0.012 0.724 P5 -0.104 0.269 0.438 -0.075 0.108 -1.817 Strategy 0.126 0.512 -0.249 1.662∗∗ -0.096 2.541∗∗∗ (0.16) (0.68) (-0.32) (2.50) (-0.09) (3.20)
Equation 2, and report the regression results in Table 7. In addition to raw returns, we also apply Fama and French (1993), and Carhart (1997) to adjusted for systematic risk. Consistent with portfolio sorts results (Table 3), we find from cross-sectional regressions that strategies based on size, turnover and idiosyncratic volatility derive their profitabil-ity mostly from stocks with the worst credit rating, while strategy based on earning-price ratio derives its profitability mostly from stocks with the best credit rating. In contrast, earning-momentum based strategy shows significant profitability in all three terciles of credit rating.
We further consider the credit rating downgrade dummy and credit rating dummies in the cross-sectional regression analysis, as specified in Equation 3, and report the results in Table 8. First of all, we find that the rating downgrade dummy variables (cross-sectional regression analysis) are all significantly negative, which indicate that the rating downgrade does decrease stock returns. Second, consistent with the literature, price momentum, earnings momentum and earnings-price ratio have positive impact on stock returns, while firm size, turnover and idiosyncratic volatility have negative impact on stock returns. Third, the C2 tercile dummy has significantly negative impact on price
momentum and earning-price ratio anomalies, while the C3 tercile dummy only adversely
Table 7: Cross-sectional regressions of returns on anomaly variables.
We apply BCS (1998) EIV-free approach to examine how the profitability of each anomaly-based trading strategy are affected by credit ratings. Each month t, we run univariate Fama-MacBeth cross-sectional regressions of monthly stock returns on a lagged firm characteristic based on each of the anomalies:
˜ R∗jt= c0t+ M ∑ m=1 cmtZmjt−lag+ ˜ejt,
where ˜R∗jt is raw return, the Fama and French (1993), or Carhart (1997), risk-adjusted return estimated with data of the previous 60 months; Zmjt−lag (m = 1, . . . , M ) is the value of anomaly-specific conditioning variable for stock j in month t-lag, and cmt is the premium per unit of anomaly-specific conditioning variable m in month
t. Each row reports the results from a separate univariate regression and shows the time-series average of these
cross-sectional regression coefficients with their associated sample t-statistics in parentheses calculated using the Newey-West (1987) robust standard errors. ∗denotes significance at the 10% level,∗∗ denotes significance at the 5% level, and∗∗∗ denotes significance at the 1% level.
Panel A: Raw average monthly returns
Subsample Intercept PMOM EMOM EP Size TO IV All Rated 3.184∗∗∗ 0.089 0.222∗∗∗ 0.896∗ -0.190∗ -0.309∗∗∗ -0.108∗∗∗ (2.64) (0.17) (6.l0) (1.92) (-1.71) (-2.96) (-4.47) C1 0.515 0.997 0.238∗∗∗ 5.193∗∗∗ 0.047 -0.113 0.004 (0.33) (1.32) (2.88) (3.56) (-0.34) (-0.64) (0.08) C2 3.524∗∗∗ -0.012 0.214∗∗∗ 1.836∗∗ -0.266∗∗∗ -0.249∗∗∗ -0.101∗∗∗ (3.19) (-0.02) (5.18) (2.48) (-2.36) (-2.51) (-3.88) C3 10.401∗∗∗ -0.216 0.387∗∗∗ -0.210 -1.105∗∗∗ -0.507∗∗∗ -0.171∗∗∗ (4.78) (-0.34) (4.09) (-0.28) (-4.66) (-3.69) (-3.82)
Panel B: Fama-French three-factor risk-adjusted monthly returns
Subsample Intercept PMOM EMOM EP Size TO IV All Rated 4.075∗∗∗ -0.096 0.253∗∗∗ 0.681∗ -0.261∗∗∗ -0.357∗∗∗ -0.134∗∗∗ (5.57) (-0.21) (6.10) (1.88) (-3.51) (-3.92) (-5.68) C1 2.174 0.865 0.332∗∗∗ 5.209∗∗∗ -0.151 -0.157 -0.069 (1.63) (1.25) (3.53) (3.11) (-1.41) (-0.96) (-1.18) C2 4.378∗∗∗ -0.375 0.233∗∗∗ 1.809∗∗ -0.343∗∗∗ -0.260∗∗∗ -0.133∗∗∗ (5.06) (-0.73) (4.94) (2.35) (-3.51) (-3.22) (-5.00) C3 9.986∗∗∗ -0.141 0.431∗∗∗ -0.062 -1.040∗∗∗ -0.623∗∗∗ -0.141∗∗∗ (3.90) (-0.21) (3.38) (-0.08) (-3.37) (-3.28) (-2.66)
Panel C: Carhart four-factor risk-adjusted monthly returns
Subsample Intercept PMOM EMOM EP Size TO IV All Rated 4.162∗∗∗ 0.074 0.257∗∗∗ 0.915∗∗ -0.262∗∗∗ -0.371∗∗∗ -0.127∗∗∗ (5.92) (0.15) (5.95) (2.24) (-3.61) (-3.98) (-5.04) C1 2.476∗ 1.305 0.378∗∗∗ 4.807∗∗∗ -0.174 -0.065 -0.079 (1.86) (1.38) (3.30) (2.75) (-1.64) (-0.34) (-1.31) C2 4.283∗∗∗ -0.262 0.226∗∗∗ 1.271 -0.318∗∗∗ -0.266∗∗∗ -0.124∗∗∗ (4.81) (-0.48) (4.95) (1.54) (-3.15) (-2.97) (-4.42) C3 9.146∗∗∗ 0.055 0.403∗∗∗ 0.158 -0.925∗∗∗ -0.628∗∗∗ -0.141∗∗∗ (3.74) (0.08) (2.99) (0.23) (-3.16) (-3.24) (-2.70)
4
Conclusion
This project studies the implications of financial distress for asset pricing anomalies exist-ing in Taiwan’s security market for the period from January 1996 to December 2012. The main objective is to ascertain how the profitability of anomaly-based trading strategies in Taiwan’s security market is affected by credit ratings, and credit rating downgrade using both portfolio sorts and cross-sectional regressions.
My empirical investigation shows that profits of anomaly-based trading strategies, such as earning momentum, size, turnover, and idiosyncratic volatility are mostly driven by firms with the worst credit rating. In contrast, profits of strategies based price momentum, and earnings-price ratio are driven by firms with the best credit rating. I also find that credit rating downgrade affects all anomalies but with different degrees. This observation is different from that in Avramov et al. (2013), which find all anomalies disappear after downgraded data are excluded from the study samples.
Overall, results of this research show that credit risk does play an important role in explaining the source of anomaly profits. However, not all asset pricing anomalies are related to financial distress in Taiwan’s security market.
Table 8: Cross-sectional regressions with rating downgrade and credit rating dummies
Each column reports the results from a separate univariate regression and shows the time-series average of these cross-sectional regression coefficients with their associated sample t-statistics in parentheses calculated using the Newey-West (1987) robust standard errors. D RDG refers to a dummy variable for stocks during the period which is 6 months before or 6 months after a rating downgrade; D C2 refers to a dummy variable for stocks in the C2
tercile; D C3 refers to a dummy variable for stocks in the C3 tercile; ∗ denotes significance at the 10% level,∗∗
denotes significance at the 5% level, and∗∗∗denotes significance at the 1% level.
Average Fama-French Carhart
returns risk-adjusted returns risk-adjusted returns Intercept 4.359∗∗∗ 5.087∗∗∗ 5.106∗∗∗ (3.83) (6.35) (6.62) D RDG -2.259∗∗∗ -2.139∗∗∗ -2.066∗∗∗ (-14.47) (-13.33) (-12.54) PMOM 0.608 0.403 0.565 (0.20) (0.56) (0.75) EMOM 0.210∗∗∗ 0.317*** 0.317*** (2.62) (3.52) (3.38) EP 3.509∗∗∗ 4.452∗∗∗ 4.516∗∗∗ (2.69) (3.08) (2.87) Size -0.319∗∗∗ -0.389∗∗∗ -0.377∗∗∗ (-3.03) (-4.92) (-4.92) TO -0.193 -0.291∗∗ -0.235 (-1.20) (-1.92) (-1.48) IV -0.026 -0.062 -0.074 (-0.54) (-1.25) (-1.48) PMOM×D C2 -1.117∗∗ -1.134∗∗ -1.172∗∗ (-1.73) (-1.70) (-1.67) EMOM×D C2 -0.035 -0.116 -0.116 (-0.39) (-1.25) (-1.21) EP×D C2 -2.182 -3.348∗∗ -3.694∗∗ (-1.50) (-2.21) (-2.38) Size×D C2 -0.001 -0.016 -0.020 (-0.03) (-0.31) (-0.37) TO×D C2 -0.051 0.019 -0.039 (-0.42) (0.14) (-0.27) IV×D C2 -0.078 -0.072 -0.054 (-1.43) (-1.37) (-0.98) PMOM×D C3 -0.888 -0.961 -0.874 (-1.06) (-1.07) (-0.92) EMOM×D C3 0.150 0.077 0.085 (1.24) (0.61) (0.66) EP×D C3 -4.118∗∗∗ -5.207∗∗∗ -4.862∗∗∗ (-2.73) (-3.16) (-2.83) Size×D C3 -0.046 -0.094 -0.079 (-0.60) (-1.28) (-1.07) TO×D C3 -0.300∗∗ -0.243 -0.336 (-1.67) (-1.22) (-1.61) IV×D C3 -0.060 -0.036 -0.027 (-0.89) (-0.55) (-0.42)
References
Ang, A., Hodrick, R. J., Xing, Y., Zhang, X., February 2006. The cross-section of volatility and expected returns. Journal of Finance 61 (1), 259–299.
Avramov, D., Chordia, T., Jostova, G., Philipov, A., 2009. Credit ratings and the cross-section of stock returns. Journal of Financial Markets 12, 469–499.
Avramov, D., Chordia, T., Jostova, G., Philipov, A., 2013. Anomalies and financial distress, Journal of Financial Economics forthcoming.
Ball, R., Brown, P., 1968. An empirical evaluation of accounting income numbers.
Journal of Accounting Research 6 (2), 159–178.
Brennan, M.J., T. Chordia and A. Subrahmanyam, 1998, Alternative factor specifi-cations, security characteristics, and the cross-section of expected stock returns.
Journal of Financial Economics 49, 345-373.
Campbell, J. Y., Hilscher, J., Szilagyi, J., December 2008. In search of distress risk.
Journal of Finance, 63 (6), 2899–2939.
Chang, Chong-Chuo and C. Edward Wang, 2013, The time-series and cross-sectional stock returns in taiwan: a reexamination under different model specification, port-folio construction, and sample selection, Taipei Economic Inquiry, 49 (1), 31–88C Chou, Pin-Huang, Yu-Zhi Zhang, and Mei-Chen Lin, 2007, Interactions between investor
sentiment and stock returns, Review of Securities and Futures Markets, 19(2), 153– 190.
Chu, Hsiang-Hui, Kuan-Cheng Ko, Shinn-Juh Lin, Hsiao-Wei Ho, Credit Rating Anomaly in Taiwan security market. submitted to Asia-Pacific Journal of Financial Studies, under second review.
Chui, Andy C.W., Wei, K.C. John, 1998. Book-to-market, firm size, and the turn-of-the-year effect: Evidence from Pacific-Basin emerging markets. Pacific-Basin Finance
Journal 6, 275-293
Cooper, M. J., Gulen, H., Schill, M. J., August 2008. Asset growth and the cross-section of stock returns. Journal of Finance 63 (4), 1609 – 1651.
Daniel, K., Titman, S., March 1997. Evidence on the characteristics of cross sectional variation in stock returns. Journal of Finance 52 (1), 1–33.
Dichev, I. D., 1998. Is the risk of bankruptcy a systematic risk? Journal of Finance 53 (3), 1131–1147. 21
Diether, K. B., Malloy, C. J., Scherbina, A., 2002. Difference of opinion and the cross section of stock returns. Journal of Finance 57 (5), 2113–2141.
Ding, D.K., Chua, J.L., Fetherston, T.A., 2005. The performance of value and growth portfolios in East Asia before the Asian financial crisis. Pacific-Basin Finance
Fama, E. F., French, K. R., June 1992. The cross-section of expected stock returns.
Journal of Finance 47 (2), 427–465.
Fama, E. F., French, K. R., February 1993. Common risk factors in the returns on stocks and bonds. Journal of Financial Economics 33 (1), 3–56.
Fama, E. F., French, K. R., August 2008. Dissecting anomalies. Journal of Finance 63 (4), 1653–1678.
Huang, I-Hsiang, Ken-Kuang Lu, Hsu-Huei Huang, Chih-Hsiang Chang, 2010, Idiosyn-cratic Risk and the Cross-Section of Expected Stock Returns: Evidence from Tai-wan, Academia Economic Paper, 38(3), 503V-542.
Hung, Jung-Hua, and Angel Lei, 2002, An Empirical Study on the Relationship between Stock Return and Firm Size, Stock Price, Price-to-earnings, and Book-to-market,
Management Review, 21 (3), 25–48.
Hung, Mao-Wei, Yi-Mien Lin, Chih-Liang Liu, 2007, The Profitability anti the Deter-minants of Momentum Investment Strategy, Sun Yat-Sen Management Review, 15 (3), 515-546.
Jegadeesh, N., Titman, S., March 1993. Returns to buying winners and selling losers: implications for stock market efficiency. Journal of Finance 48 (1), 65–91.
Ku, Kuang-Ping, 2011, Earnings and Sales Momentum, Journal of Management, 28 (6), 19-42
Li, Chun-An, Jin-Shuei Luo, Yung-Yu Su, 2006, Momentum Returns, Investor Senti-ments and Business Cycle, Journal of Financial Studies, 14 (2), 73-109.
Liu, W., 2006, A liquidity-augmented capital asset pricing model, Journal of Financial
Economics 82(3), 631-671.
Lo, A. W., and A. C. MacKinlay, 1990a, Data-snooping biases in tests of financial asset pricing models, Review of Financial Studies 3 (3), pp. 431-468.
Lu, Ching-Chih, and Yi-Tsung Lee, 2008, Preliminary Studies of Risk Premiums in Tai-wan security market and Individual Industries, Research Report, GreTai Securities Market.
Mukherji, S., Dhatt, M.S., Kim, Y.H., 1997. A fundamental analysis of Korean stock returns. Financial Analysts Journal 54, 75-80.
Schwert, G. W., 2002, Anomalies and market efficiency, in G. M. Constantinides, M. Harris, and R. Stulz, ed.: Handbook of the Economics of Finance, pp. 939-974 (North Holland, Amsterdam).
Titman, S., Wei, K. C. J., Xie, F., December 2004. Capital investments and stock returns. Journal of Financial and Quantitative Analysis 39 (4), 677-700.
Wang, Ming-Chang, Long-Ping Zu, Hung-Chih Wang, 2010, Do Middle-Term Price Mo-mentum not Exist in Taiwanese Stock Market? Soochow Journal of Economics and
國科會補助專題研究計畫項下出席國際學術會議心得報告
日期:2014 年 05 月 21 日
一、參加會議經過
本次研討會我被安排在4月15日的Accounting and Finance session,該場次
共有五位學者發表學術論文。本人發表的論文題目為“The Impact of Technical
Analysis on Volatility and Size Effects on Taiwan’s Stock Market”。會中評論人
計畫編
號
NSC 102-2410-H-004 -032 -
計畫名
稱
財務困境對台灣股市資產定價異常現象之影響
出國人
員姓名
林信助
服務機
構及職
稱
國立政治大學國際貿易學系副
教授
會議時
間
2014 年 04 月 13
日至 2014 年 04
月 19 日
會議地
點
法國巴黎
會議名
稱
(中文)全球商業暨社會科學研究研討會
(英文)
World Business and Social Science Research Conference發表論
文題目
(中文)
技術分析對於台灣股市波動度效果及規模效果之影響(英文)
The Impact of Technical Analysis on Volatility and Size
Effects on Taiwan’s Stock Market
對本篇文章提供了非常多寶貴的建議,讓本篇論文在將來投稿前,有一個良
好的修正依據。另外,本篇論文也獲得該研討會經濟及財務類最佳論文(如
附上之信件)。這兩者都算是參加本次研討會的珍貴收穫。
除了我自己的報告之外,我也參加了幾場其他學者的專題演講,對於瞭
解時下經濟財務主要研究問題的了解與釐清都有相當不錯的幫助。
二、與會心得
這次到法國巴黎參加金融學術研討會,除了從其他學者身上得到投稿前論文
修改的許多寶貴建議之外;另外,與其他與會學者之間的研究經驗交流,也
讓我獲益匪淺。
。三、考察參觀活動(無是項活動者略)
無。
四、建議
無。
五、攜回資料名稱及內容
無。
六、其他
無。
2014年9月25日 https://faculty.nccu.edu.tw/cgi-bin/msg_read?cmd=print_mail&m=9440145&mbox=@&msgid=WQ$_FQ26N9IU28
Nuha Jahan <[email protected]>
來源: Nuha Jahan <[email protected]> 收信: undisclosed-recipients:;
副本密送: [email protected]
日期: Wed, 14 May 2014 14:24:46
標題:
Thank you and Best Paper Awards Paris Apr 2014 Conference
Dear Author/Participant
On behalf of World Business Institute, Australia, I would like to take this opportunity
to thank you all for attending and participating at the World BSSRC held in Paris, France in
April 2014. We apologise for the delay in sending out this announcement.
Although, I could not attend in person to meet and greet you all, I hope that you all had a
fantastic conference and took away some valuable feedback for your research work and
made some great new contacts.
I will be your contact person for this conference from here on. So if you have any questions
about publication or other matters please email me via this email address. We
remind you that authors of all presented papers will receive a Paper Evaluation Report within
2 months. If you paid for the conference, but failed to present the paper, then a PER will not
be sent to you. For those who have paid for publication of the paper in a journal a Editorial
Review Report will be emailed to you within 5 months.
The best papers for this conference were awarded as follows:
Accounting
Paper 102:
Dr. Lijen HeAuditor Industry Specialization, Audit Experience, Tenure, and Audit Opinion
Banking
Paper 602:
Dr. Wael Hassan2014年9月25日 https://faculty.nccu.edu.tw/cgi-bin/msg_read?cmd=print_mail&m=9440145&mbox=@&msgid=WQ$_FQ26N9IU28
Economics & Finance
Paper 313:
Dr. Shinn-Juh LinThe Impact of Technical Analysis on Volatility and Size Effects on Taiwan’s Stock Market
Paper 309:
Prof. Haran SegramA Mixed Ordered Probit Analysis of Corporate Credit Ratings
Management
Paper 424:
Dr. Ragnar LundPrivate Banking and Art –Relationship Building and Cross Cultural Marketing: A Case
Study
Marketing
Paper 508:
Prof. Qi WangThe Impact of Strategic Alliance on the Innovator’s Financial Value in Markets with Network
Effects and Standard Competition
Further to the above, the following papers were awarded best prize for journal award:
Global Review of Accounting and Finance
Paper 108:
Dr. Walid Ben-Amar
The Effect of Board Composition and Structure on Voluntary Disclosure of Climate Change
Strategies: Evidence from France
Journal of Islamic Finance and Business Research
Paper 507: Prof. Suleiman Mohammad and Miss. Ayat Mohammad
Effect of Banking Service Quality on Customer Satisfaction of Islamic Banks in Jordan:
Structural Equation Modeling
2014年9月25日 https://faculty.nccu.edu.tw/cgi-bin/msg_read?cmd=print_mail&m=9440145&mbox=@&msgid=WQ$_FQ26N9IU28
Congratulations to all the winners on this outstanding achievement! Please email me your
full postal address so that I can post out the award certificate to you. You will also be
awarded fellowship into World Business Institute.
Thank you again and we hope to see you all again in our future conferences.
--
To keep up-to-date with our forthcoming conferences and journal
publications, follow us on Facebook by clicking
https://www.facebook.com/pages/World-Business-Institute/203169793036174
Kind Regards
Ms. Nuha Jahan
Events/ Publication Director
World Business Institute
P: + 61 3 9702 2734
F: + 61 3 9702 0122
E:
[email protected]
W:
www.wbiworld.org
31 Blake Street
Berwick VIC 3806
Melbourne, Australia
科技部補助計畫衍生研發成果推廣資料表
日期:2014/09/24科技部補助計畫
計畫名稱: 財務困境對台灣股市資產定價異常現象之影響 計畫主持人: 林信助 計畫編號: 102-2410-H-004-032- 學門領域: 財務無研發成果推廣資料
102 年度專題研究計畫研究成果彙整表
計畫主持人:林信助 計畫編號: 102-2410-H-004-032-計畫名稱:財務困境對台灣股市資產定價異常現象之影響 量化 成果項目 實際已達成 數(被接受 或已發表) 預期總達成 數(含實際已 達成數) 本計畫實 際貢獻百 分比 單位 備 註 ( 質 化 說 明:如 數 個 計 畫 共 同 成 果、成 果 列 為 該 期 刊 之 封 面 故 事 ... 等) 期刊論文 0 0 100% 研究報告/技術報告 1 1 100% 研討會論文 0 0 100% 篇 論文著作 專書 0 0 100% 申請中件數 0 0 100% 專利 已獲得件數 0 0 100% 件 件數 0 0 100% 件 技術移轉 權利金 0 0 100% 千元 碩士生 2 2 100% 博士生 0 0 100% 博士後研究員 0 0 100% 國內 參與計畫人力 (本國籍) 專任助理 0 0 100% 人次 期刊論文 0 1 100% 研究報告/技術報告 0 0 100% 研討會論文 0 1 100% 篇 論文著作 專書 0 0 100% 章/本 申請中件數 0 0 100% 專利 已獲得件數 0 0 100% 件 件數 0 0 100% 件 技術移轉 權利金 0 0 100% 千元 碩士生 0 0 100% 博士生 0 0 100% 博士後研究員 0 0 100% 國外 參與計畫人力 (外國籍) 專任助理 0 0 100% 人次其他成果