Cite this: RSC Advances, 2013, 3, 7884
Effect of geometry on the magnetic properties of
CoFe
2O
4–PbTiO
3multiferroic composites
Received 8th January 2013, Accepted 1st March 2013 DOI: 10.1039/c3ra00104k www.rsc.org/advances
B. Y. Wang,aH. T. Wang,abShashi B. Singh,aY. C. Shao,aY. F. Wang,aC. H. Chuang,aP. H. Yeh,aJ. W. Chiou,cC. W. Pao,dH. M. Tsai,dH. J. Lin,dJ. F. Lee,dC. Y. Tsai,eW. F. Hsieh,eM.-H. Tsaif and W. F. Pong*a
In this study, X-ray absorption near-edge structure (XANES), extended X-ray absorption fine structure (EXAFS), X-ray magnetic circular dichroism (XMCD) and element- and site-specific magnetic hysteresis (ESMH) are used to elucidate the effect of geometry (0-3- and 2-2-type) on the magnetic properties of CoFe2O4–PbTiO3(CFO–PTO) multiferroic composites by comparison with those of the reference CFO and
PTO powders. Magnetic Co ions in CFO have been confirmed to be located at both the tetrahedral (A)- and octahedral (B)-sites. CFO retains its mixed-spinel structure as verified by the EXAFS, XMCD and ESMH measurements. ESMH measurements further demonstrate that the magnetic moments of Co2+and Fe3+/ Fe2+cations at both the A- and B-sites in the composites are smaller than those of the CFO powder. The reduction of the magnetic moments in the 2-2-type composite was larger than that in the 0-3-type composite. The reduction of the magnetic moments in the composites was attributable to the formation of anti-phase boundaries owing to the compressive strain in CFO, which is the largest strain in the 2-2-type composite. Based on the Ti L3,2-edge XMCD measurements of the CFO–PTO composites, no induced
magnetic moment was observed at the Ti sites in the PTO matrix, excluding the possibility that the Ti ions in the PTO matrix affect the magnetic properties of these CFO–PTO composites.
1. Introduction
Multiferroics with co-existing magnetism and ferroelectricity have attracted intensive fundamental and technological research interest owing to the magnetoelectric (ME) coupling effect, which allows the magnetic and electric properties to be controlled by varying the applied electric and magnetic fields, respectively.1–5 Recent studies have divided multiferroic materials into two classes of single-phase and multi-phase systems, based on their material constituents.2 Many efforts have been made to develop single-phase multiferroic materials (perovskite oxides) whose magnetic ordering can be controlled by application of an electric field and vice versa.6,7However, the structural, chemical and coupling of ferroelectric and magnetic properties of single-phase multiferroics are still not fully understood.7 At room temperature (RT), multi-phase composites exhibit a larger ME response than single-phase
multiferroics.8 The ME coupling has been understood to originate from the bonding at the interface and is mediated by interfacial stress, which modifies the electric and magnetic properties of the multiferroics.9,10Accordingly, the strength of ME coupling is strongly related to the strain fields of various geometries of phase segregation in multi-phase systems, such as multiferroics with dispersed particles (0-3-type) and those with layered-structures (2-2-type).10–12The notation "0-3-type" refers to the fact that the magnetic nanoparticles (0) are embedded in the ferroelectric matrix (3), whereas ‘‘2-2-type’’ refers to a horizontal heterostructure with alternating ferro-electric (2) and magnetic (2) layers that are grown as a thin film on the substrate. Different geometries (like the 0-3-type particulate and 2-2-type laminate composites) and materials (ferroelectric and ferromagnetic) were used to produce multi-phase multiferroics with various ME properties.2,8
CoFe2O4(CFO)-PbTiO3(PTO) has recently been used widely in strain-driven ferrimagnetic-ferroelectric multiferroics, because it simultaneously exhibits strong magnetization and electric polarization and most importantly a ME coupling that is three to five orders larger than that of the single-phase multiferroics at RT.12–16 Levin et al.15 demonstrated that the morphologies of self-assembled CFO–PTO multiferroic nanos-tructures could be varied over a wide range by changing the orientation of the substrates and phase fraction to modify the epitaxial stress in the film/interface. Murakami et al.17
aDepartment of Physics, Tamkang University, Tamsui 251, Taiwan
E-mail: [email protected]
bDepartment of Physics, National Tsinghua University 300, Taiwan
cDepartment of Applied Physics, National University of Kaohsiung, Kaohsiung 811,
Taiwan
dNational Synchrotron Radiation Research Center, Hsinchu 300, Taiwan e
Department of Photonics and Institute of Electro-Optical Engineering, National Chiao Tung University, Hsinchu 300, Hsinchu 300Taiwan
f
Department of physics, National Sun Yat-Sen University, Kaohsiung 804, Taiwan
PAPER
Published on 04 March 2013. Downloaded by National Chiao Tung University on 28/04/2014 02:03:18.
View Article Online
examined the tunable ferroelectric and magnetic properties of the CFO–PTO multiferroics on a thin film and observed that various magnetic properties obtained were attributable to the substantial inter-diffusion of cations. Furthermore, Park et al.18 found a scenario of the cation-charge redistribution between Co2+and Fe3+ions in CFO under the condition of an electric-field-induced in-plane compressive strain. Theoretical and experimental investigations have also demonstrated that the properties of multiferroics are strongly correlated with heterointerface spin, charge, orbital and lattice modifica-tions.19–22 Interfacial strain has also been argued to be important in the occurrence of ferromagnetism.23 More recently, Garcia-Barriocanal et al.24 experimentally observed the induced magnetic moment at the Ti sites in the LaMnO3/ SrTiO3 (LMO-STO) epitaxial interface and argued that it was caused by the formation of the new valence state of Ti3+at the LMO-STO epitaxial interface resulting from charge transfer from the Mn d-band to the empty conduction band of the titanate. To elucidate the correlation between the magnetic properties and the geometry-dependent strain-mediated inter-action in the CFO–PTO composite multiferroics, the local atomic structures and magnetic properties of the 0-3- and 2-2-type CFO–PTO composites were investigated in detail using X-ray absorption near-edge structure (XANES), extended X-ray absorption fine structure (EXAFS), X-ray magnetic circular dichroism (XMCD) and element- and site-specific magnetic hysteresis (ESMH) methods. The saturation magnetization of the CFO–PTO composites was smaller than that of the bare CFO powder because of the formation of anti-phase bound-aries (APBs),25which depended strongly on the CFO strain in the 0-3- and 2-2-type composites.
2. Experimental details
2.1 Synthesis of CFO–PTO composites
The 0-3- and 2-2-type CFO–PTO composite multiferroics were fabricated by the sol–gel and spin-coating method. The PTO gel was formed by dissolving lead acetate trihydrate and titanium isopropoxide into 2-methoxyethanol, and the solu-tion was then simultaneously stirred and heated for 30 min. 0.3 M CFO gel was made from cobalt nitrate hexahydrate and iron nitrate nonahydrate using the same process. To produce the 0-3-type multiferroics, the CFO powders were mixed with PTO gel in a molar ratio of 0.8 : 1 and then the mixed gels were spin-coated on the Pt/Si substrate several times. The 2-2-type multiferroic was fabricated by spin-coating one layer of PTO on Pt/Si and then pre-baking at 500 uC for three minutes. The coating and baking of CFO and PTO gels were repeated to form (2p/2c)3/2p/Pt/Si, where "2p" and "2c" refer to the two layers of PTO and CFO, respectively, and the superscript ‘‘3’’ denotes the three multi-layers. Finally, the 0-3- and 2-2-type samples were annealed at 750 uC for 1.5 h. The bare CFO and PTO powders (as the reference samples) were made by similar procedures: the CFO and the PTO samples were dried and solidified and then illuminated with a 400 W infrared lamp for two days. The resulting solids were heated to 165uC for 1 h.
and then were ground into powders. Their structures, magnetic properties and interfacial phonons have been characterized in detail elsewhere.26
2.2 Characterization
The crystalline structures of the 0-3- and 2-2-type composites and the reference CFO and PTO powders were characterized by X-ray diffraction (XRD). The morphology of the composites was verified by transmission electron microscopy (TEM). The magnetic hysteresis loops were recorded using a supercon-ducting quantum interference device (SQUID). The atomic structures and magnetic properties of the 0-3- and 2-2-type composites and the reference CFO and PTO powders were studied by performing XANES, EXAFS, XMCD and ESMH measurements at RT. All of the synchrotron-based experiments were carried out at the National Synchrotron Radiation Research Center (NSRRC) in Hsinchu, Taiwan. The local atomic structures of the samples were measured by Fe and Co K-edge EXAFS at beamlines BL-07C and BL-17C at the NSRRC in fluorescence yield mode with an angle of 45u between the incident X-rays and the surface normal. Fe, Co and Ti L3,2-edge XANES and XMCD were conducted at beamline BL-11A at NSRRC. The incident angle of X-rays was fixed at 30u from the sample normal and a magnetic field of 1.2 Tesla was applied parallel and antiparallel to the sample normal. The XANES and XMCD spectra were obtained from the total electron yield. In conjunction with the ligand field model (LFM) and the CTM4XAS 5.2 program,27 the ESMH measurements yielded the magnetic moments of the Fe2+, Fe3+and Co2+cations at the tetrahedral (A)- and octahedral (B)-sites in the composites and the reference CFO powder. The ESMH measurements were made by recording the intensity as a function of the magnetic field at the element- and site-specific energy of the XMCD curves.28
3. Results and discussion
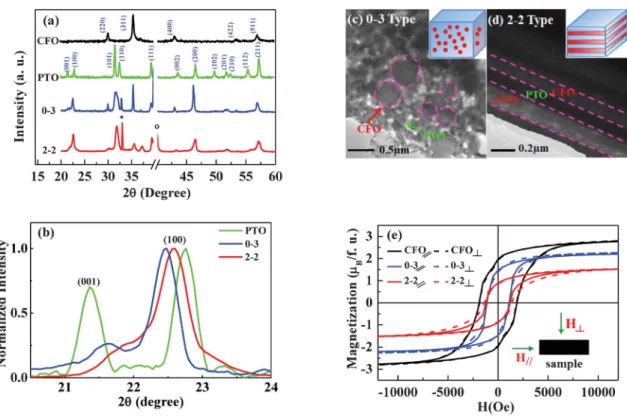
Fig. 1(a) presents the XRD patterns of the 0-3- and 2-2-type composites and the reference CFO and PTO powders. The XRD patterns of the CFO–PTO composites were observed to resemble closely those of the reference CFO and PTO powders. In Fig. 1(a), the layers of planes with various orientations in CFO and PTO are also labeled. The peaks that correspond to Si and Pt (in the substrates) are indicated by * and #, respectively. The PTO powders yielded two peaks at y21.4u and 22.7u that correspond to the (001) and (100) planes, respectively.29,30The CFO–PTO composites yield significantly different XRD intensities for the (001) and (100) planes, which are magnified in Fig. 1(b). Table 1 presents the I(100)/I(001)ratio, a, c, c/a and the strain (in %) of the samples. The crystal-lographic parameters were calculated using the standard Refined Rietveld technique. Clearly, the PTO lattice constant c (a) in the composites is smaller (larger) than that in the PTO powder in consistence with the larger I(100)/I(001) ratio in the composites than in bare PTO, which suggests that the c axis lies closer to the in-plane direction.31The c axis of the 2-2-type composite was observed to lie closer to the in-plane direction
than that of the 0-3-type composite, which also exhibits small macro tetragonality (c/a). As indicated in Table 1, the CFO lattice constant a in the composites is smaller than that in the CFO powder. The lattice constants of PTO are a = 3.862 Å and c = 4.019 Å, whereas those of CFO and Pt are 8.387 Å and 3.924 Å, respectively. The observed compressive strain in CFO in the composites is given in Table 1, which is probably given rise by the fact that the lattice mismatch at the interface between CFO and PTO is larger (almost double). The effect from Pt surface is expected to be minor in strain due to (111) orientation of Pt film surface. According to our XRD result, the peak present aty40u corresponds the (111) plane of Pt film.
The strain in the composites was calculated using the following formula.
Strain ~Da
a | 100%, (1)
, where Da is the difference between the lattice constants of
CFO in the composites and those in the CFO powder, and a is the lattice constant of the CFO powder. The larger compressive strain in the 2-2-type than in the 0-3-type, as shown in Table 1, was attributable to the difference between the geometries of CFO and PTO in the composites. Fig. 1(c) and 1(d) present TEM images of the 0-3- and 2-2-type composites, depicted schematically in the insets for clarity. The CFO nanoparticles were uniformly embedded in the PTO matrix in the 0-3-type composite [Fig. 1(c)], whereas distinct layers of PTO (with thicknessy120 nm) and CFO (with thickness y140 nm) were observed in the 2-2-type composite [Fig. 1(d)]. The range of the sizes of the CFO particles in the 0-3-type composite was 50–500 nm, according to the TEM analysis. Fig. 1(e) presents the magnetic hysteresis loop (in-plane and out-of-plane) of the 0-3-and 2-2-type composites 0-3-and the CFO powder. Clearly, the saturation magnetization and coercivity of the 0-3- and 2-2-type composites are smaller than those of the CFO powder. The latter yields an expected isotropic magnetic loop with a Fig. 1 (a) XRD patterns of the 0-3- and type composites and the reference CFO and PTO powders. (b) Magnified and normalized XRD patterns of the 0-3- and 2-2-type composites and the PTO powder. (c, d) TEM images of the 0-3- and 2-2-2-2-type composites, respectively, with schematic insets. (e) Magnetic hysteresis loops measured by SQUID for both in-plane (//) and out-of-plane ()) geometries for the 0-3- and 2-2-type composites and the CFO powder.
Table 1 Refined lattice parameters of the 0-3- and 2-2-type composites and the reference PTO and CFO powders
Samples PTO CFO
I(100)/I(001) a (Å) c (Å) c/a a (Å) Strain (%)
PTO powders 1.424 3.862 ¡ 0.005 4.019 ¡ 0.005 1.041 — —
CFO powders — — — — 8.387 ¡ 0.005 —
0-3 3.732 3.887 ¡ 0.005 3.947 ¡ 0.005 1.015 8.386 ¡ 0.005 20.012%
2-2 3.768 3.908 ¡ 0.005 3.942 ¡ 0.005 1.009 8.366 ¡ 0.005 20.250%
saturation magnetization ofy2.7 mB/f.u. and coercivity (Hc) of y1.87 kOe. The saturation magnetization and coercivity in out-of-plane hysteresis loops are slightly larger than those of the in-plane hysteresis loops in the composites. The tempera-ture dependent zero field cold curves and hysteresis loops of 0-3- and 2-2-type composites revealed both types of composites exhibit non-vanished magnetization as the temperature vary-ing from 2 K to 350 K (not shown here), indicatvary-ing that the Curie temperature of both systems must be higher than the room temperature. The higher magnetization was also observed at throughout temperature range (from 2 K to 350 K) of 0-3-type compared to 2-2-type sample.
Fig. 2(a) and 2(b) displays the Fourier transform (FT) spectra of Fe and Co K-edge of the 0-3- and 2-2-type composites and the CFO powder, respectively. The inset shows EXAFS k3x data. These figures elucidate the variations of the local atomic structures around the Co and Fe sites in CFO because of the strain that is induced by the geometrical effect in the CFO– PTO composites. The Fe/Co K-edge EXAFS spectra reveal main FT features aty1.9 Å, 2.9 Å and 3.3 Å, which correspond to the nearest-neighbor (NN) Fe–O/Co–O, next-neighbor-neighbor (NNN) Feoct–Moct/Cooct–Moct and Fetet–Moct/Cotet–Moct bond distances in the composites and the CFO powder. The symbol ‘M’ refers to the cations (either Fe or Co) and the subscripts ‘tet’ and ‘oct’ indicate the tetrahedral (A)- and octahedral (B)-sites, respectively.32The positions of the main features in the
FT spectra at the Co K-edge are similar to those at the Fe K-edge, indicating similarity between the local atomic envir-onments of Co and Fe cations at the A- and B-sites in the composites and the CFO powder. Fig. 2(a) shows that the PTO matrix or strain does not significantly alter the Fe–O and Fe–M bond distances in CFO in the composites. In contrast, Fig. 2(b) reveals that the Co–O and Co–M bond distances are increased slightly with respect to those in the CFO powder. The higher intensity of the FT spectra of the composites at both the Fe and Co K-edge than those of the CFO powder is attributable to the fact that the Fe and Co sites in the composites favor structural ordering, resulting in smaller Debye–Waller (DW) factors. Notably, when redistribution or migration of Fe and Co cations from one site to another occur in CFO in the composites, a change in the ratio of the intensities of the features at the A- and B-sites in the FT spectra is seen (the intensity of one feature is reduced and that of the other is increased), causing the DW factors of the composites to exceed those of the CFO power. As presented in Fig. 2(a) and 2(b), no clear evidence of redistribution of the Fe and Co cations or their migration from one site to another was observed in CFO following composite formation. Additionally, CFO, unlike Fe3O4, may not be a completely inverse spinel.33,34In Fe3O4, Fe3+is present at both A- and B-sites and Fe2+is present at the B-site only, whereas in CFO, Fe2+ is replaced by Co2+ at the B-site and some of the Co2+ions are also present at the A-site. Fig. 2 Fourier transform (FT) spectra of (a) Fe and (b) Co K-edge EXAFS of the 0-3- and 2-2-type composites and the CFO powder at RT. Inset shows EXAFS k3xdata,
where k is in the range 3 to 11 Å21and 2.5 to 12.5 Å21for Fe and Co K-edge, respectively, (c, d) extracted phase function, Y(k), and phase derivative function, dY(k)/
dk, and plots of the 0-3- and 2-2-type composites and the CFO powder for Fe and Co, respectively.
To determine whether the Co ions are located at both A- and B-sites as the Fe ions in CFO, Fig. 2(c) and 2(d) display the phase and phase derivative analysis35,36 for the Fe and Co cations in the composites, respectively. Principally, phase derivative analysis has been performed extensively on dis-torted perovskites, and it provides accurate information about atoms that are present at various sites with slightly different bond distances, yielding a beating point (kb) in the EXAFS oscillations. The wavenumber at which beating occurs (in phase derivative analysis) is given by
kb~
p
2DR, (2)
, where DR is the difference between the two bond distances at different sites. Accordingly, kbis extracted from the FT spectra of NN Fe–O in Fig. 2(a) and Co–O in Fig. 2(b), respectively. The obtained values of kb(DR) for the Fe ions in the 0-3- and 2-2-type composites and the CFO powder arey8.3 Å21 (0.19 Å) and 8.3 Å21(0.19) Å and 8.6 Å21(0.18 Å), respectively, whereas the corresponding values of kb (DR) for the Co ions are y8.3 Å21 (0.19 Å), 8.2 Å21 (0.19) Å and 8.7 Å21 (0.18 Å), respectively. The values of DR in the composites at both Fe and Co K-edge are slightly larger than those of the CFO powder because of the compressive strain in CFO, which changes the difference between the two NN Fe–O and Co–O bond distances at the A- and B-sites in the composites. The beating points in
the 0-3- and 2-2-type composites and the reference CFO powder provide further evidence of the presence of Fe and Co ions at both A- and B-sites, which conclusively proves that the CFO sample, unlike Fe3O4, has a mixed-spinel structure not a completely inverse spinel structure.
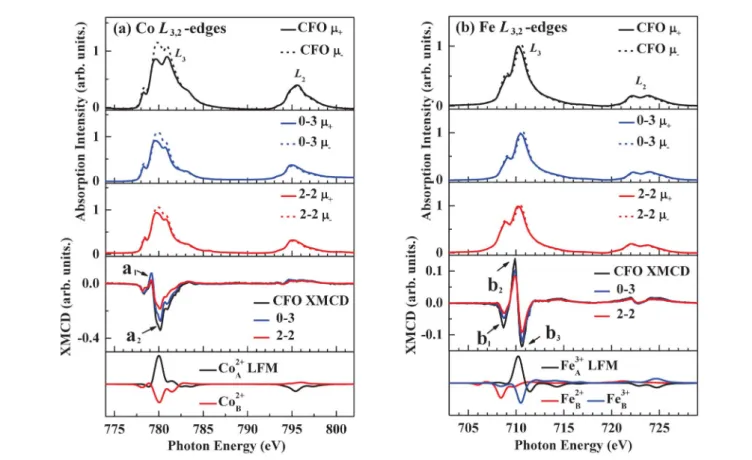
Fig. 3(a) and 3(b) (top three panels) display the Co and Fe L3,2-edge XANES spectra, respectively, with the photo-helicity of incident X-rays parallel (m+) and anti-parallel (m2) to the direction of magnetization of the 0-3- and 2-2-type composites and the CFO powder. The Co (Fe) L3,2-edge XANES (m+and m2) spectra of the 0-3- and 2-2-type composites and the CFO powder shown in Fig. 3(a) [Fig. 3(b)] exhibit two broad features in the ranges 777–785 eV (705–715 eV) and 792–799 eV (718– 727 eV), which are attributable to Co (Fe) 2p3/2A 3d and 2p1/2 A 3d dipole transitions, respectively. Fig. 3(a) and 3(b) also present Co and Fe L3,2-edge XMCD spectra (second panel from bottom), in which the general line shapes are consistent with those reported elsewhere.33,37,38 Further analysis was per-formed by applying the LFM model in the CTM4XAS 5.2 program27using similar parameters to those used in the work of Stavitski and de Groot27, as presented in Fig. 3(a) and 3(b) (bottom panel), to clarify further the site-specific contributions of the Co and Fe ions in CFO to the XMCD features. Calculations based on the LFM model indicate that feature a1in the Co L3,2-edge XMCD spectra [Fig. 3(a)] is associated with the Co2+ ions at the A-site (CoA2+) whereas feature a2 is
Fig. 3 Normalized (a) Co and (b) Fe L3,2-edge XANES spectra with photo-helicity of incident X-rays parallel (m+) and anti-parallel (m2) to the direction of magnetization
for the 0-3- and 2-2-type composites and the CFO powder. Middle panel presents (a) Co and (b) Fe L3,2-edge XMCD spectra of the 0-3- and 2-2-type composites and
the CFO powder. Bottom panel presents the theoretical XMCD spectra calculated using the LFM model for the (a) Co and (b) Fe cations in CFO.
associated with the Co2+ ions at the B-site (Co
B2+). The opposite directions of features a1 and a2represent antiferro-magnetic (AFM) interaction of the Co ions at the A- and B-sites in CFO. Based on the Fe L3,2-edge XMCD spectra [Fig. 3(b)], the LFM model suggests that the Fe3+ ions at the A- (Fe
A3+) and B-sites (FeB3+) contribute to features b2 and b3, respectively, whereas feature b1 is associated with Fe2+ ions at the B-site (FeB2+). The opposite directions of features b1/b3and b2arise from the AFM interaction of the Fe ions at the B- and A-sites whereas the directions of features b1 and b3 are the same, reflecting ferromagnetic (FM) interaction of the Fe2+and Fe3+ ions at the B-site. Apparently, the intensity of XMCD at both the Co and Fe L3-edge in the composites is considerably smaller than those in the CFO powder. The 2-2-type composite has an even lower XMCD intensity than the 0-3-type composite, as presented in Fig. 3(a) and 3(b) (second panel from bottom), indicating that the magnetic moments at both the Co and Fe cations in CFO are smaller in the composites in consistence with the measurements of the magnetization hysteresis loops shown in Fig. 1(e). As mentioned above, if the cations were redistributed or if they migrated from one site to another in the composites but not in the CFO powder, then the ratios of feature intensities at the A- and B-sites in the XMCD spectra would be observed to be very different (since the intensity of one feature would be lower and that of the other would be higher).39However, as displayed in Fig. 3(a) and 3(b), no evidence of redistribution of Co and Fe cations or their migration from one site to another was observed in CFO following the formation of the composites.
This result is also consistent with the EXAFS result stated above. Most magnetic moments in CFO have been suggested to be located at the Co2+ cations.33 The Fe3+ cations in a perfectly inverse spinal CFO structure do not contribute considerably to the total moment because of the AFM alignment between the A- and B-sites, so the net magnetic moment of the Fe assembly is determined only by the Fe+2ions present at the B-site. Nevertheless, the phase derivative analysis of the EXAFS spectra and the calculations using the LFM model clearly indicate that the Co2+ions can be located at both A- and B-sites in CFO, and is also involved in AFM interaction. Although quantitative information concerning the spin and orbital moments of the Co and Fe ions in the composites can ideally be obtained by analyzing the XMCD curves with spin and orbital sum-rules,40–42those of the Co2+ ions at both A- and B-sites, and the spin and orbital moments that are associated with the specific sites in CFO may not be determined directly and accurately from the XMCD curves using the sum-rules. A reasonable ratio between the orbital and spin moments in 3d-transitional metals is typically lower than 10%, according to the literature.42–44Applying the sum-rules to the XMCD spectra with Co2+ions at two sites may yield an unreasonably large value for the orbital moment of the Co ions in CFO33. Therefore, the results of the sum-rules calculation based on the XMCD spectra are not presented herein.
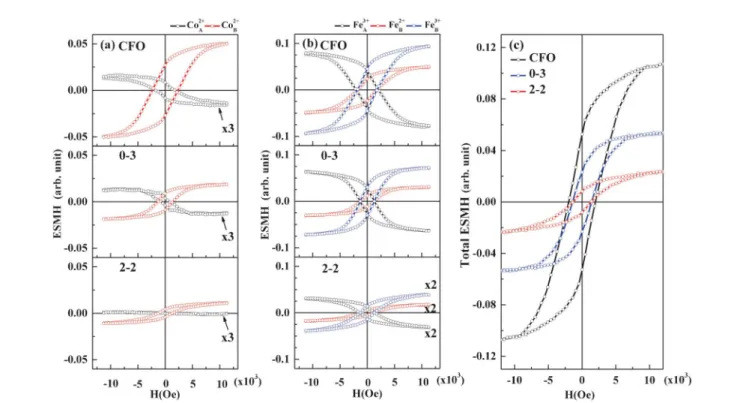
Fig. 4(a) and 4(b) present the ESMH loops that are associated with the Co2+, Fe3+and Fe2+cations at the A- and B-sites, respectively, to elucidate the element- and site-specific magnetic properties of the 0-3- and 2-2-type composites and
Fig. 4 ESMH of the 0-3- and 2-2-type composites and the CFO powder; the (a) Co2+and (b) Fe3+and Fe2+cations at the A- and B-sites; (c) the total-ESMH loop of the
0-3- and 2-2-type composites and the CFO powder.
the CFO powder. The measurements were made by recording the XMCD intensity as a function of the magnetic field at the characteristic energies of 779.1 eV and 780.1 eV for Co2+at the A- and B-sites, respectively, and 708.6 eV, 709.8 eV and 710.5 eV for Fe2+ at the B-site, and Fe3+ at the A- and B-sites, respectively. The characteristic energy selections for the specific sites are based on the results of the LFM model and the XMCD spectra that are presented in Fig. 3(a) and 3(b). The ESMH loop in Fig. 4(a) demonstrates that Co2+ is present at both A- and B-sites, with opposite directions of magnetization. The magnetization values at both sites in the composites are smaller than that of the CFO powder. Notably, the strength of the magnetic moment of the Co2+ ions at the B-site in the composites and the CFO powder is at least three times larger than that at the A-site. With respect to the ESMH loop of the Fe cations shown in Fig. 4(b), the Fe3+and Fe2+ions at the B-site have the same magnetization direction whereas the Fe3+ions at the A-site have the opposite magnetization direction. The composites exhibited smaller magnetization of the Fe cations at both A- and B-sites than did the CFO powder. Importantly, the strength of the magnetic moment of the Fe3+ions at both A- and B-sites in the composites and the CFO power was almost equal to each other, indicating no net contribution by the Fe3+ions owing to AFM interaction at both A- and B-sites, such that the net magnetic moment arises mostly from the Fe2+ions at the B-site and with a strength that is close to that of the Co+2ions. This result clearly supports the fact that the net magnetic moments in CFO result from both Co2+and Fe2+ cations at the B-site. Fig. 4(c) presents the total ESMH, which was contributed by all the Co2+, Fe3+and Fe2+cations at the A-and B-sites as shown in Fig. 4(a) A-and 4(b), respectively. The total magnetic moments of both Co and Fe cations at the A-and B-sites were observed to be lower in the composites than in the CFO powder, which is also consistent with the results concerning the magnetic hysteresis loop that are displayed in Fig. 1(e).
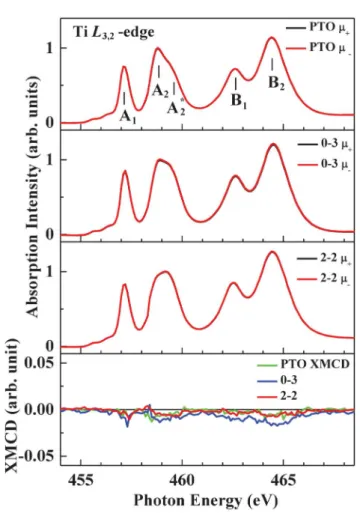
As stated above, Garcia-Barriocanal et al.24 observed direct evidence of the effect of the interface on the magnetic properties of the LMO-STO epitaxial system. The novel properties of the interface arise from a combination of titanate and manganite, in which the presence of a Ti–O–Mn bond provides an interaction path between the ‘magnetic’, e.g., electrons of Mn and the nominally ‘non-magnetic’ t2g electrons of Ti, causing an interesting magnetic response. To elucidate the possible effect of PTO or Ti ions on the magnetic properties of the 0-3- and 2-2-type composites, Fig. 5 shows the Ti L3,2-edge XANES spectra with the photo-helicity of incident X-rays parallel (m+) and anti-parallel (m2) to the magnetization direction for the composites and the reference PTO powder. The XANES line-shapes of the composites resemble those of the PTO powder, suggesting that the formal valence of Ti is close to 4+ in the composites, as it is in the PTO powder, providing no evidence of a new valence state of Ti3+ ferromagnetism in the CFO–PTO composites. Clearly, the XANES spectra exhibit four main features A1, A2 and B1, B2, which are associated with the Ti 2p3/2A 3d and 2p1/2A 3d
dipole transitions, respectively. Features A1(B1) and A2(B2) at the L3-edge (L2-edge) are associated with the splitting of the Ti 3d band into two subbands t2g and eg, respectively.24,45 Mesquita et al.46 suggested that the Ti 3d eg subband (A2) splits into the 3dx22y2orbital with four lobes that point to the four corners in the central plane and the 3dz2orbital with its two lobes point to the two apex O ions of the TiO6octahedron. The alteration of the Ti–O bond distances by the Ti off-center displacement is strongly related to the shoulder A2*. Interestingly, the intensity of feature A2* or the ratio between the intensities of features A2* and A2of the 0-3-type composite is closer to that of the PTO powder than that of the 2-2-type composite because the 0-3-type sample is incorporated with the CFO nanoparticles that were dispersed in the PTO matrix, and the strained PTO was under less stress from the boundary of the CFO nanoparticles. The fact that the 0-3-type composite had a smaller local structural distortion of the TiO6octahedra in the PTO matrix than did the 2-2-type composite reveals weak chemical bonding between the CFO nanoparticles and the PTO matrix at the interfaces. Accordingly, the Ti 3d eg subbands in the 0-3-type composite resemble those of the PTO powder more closely than the 2-2-type composite. The bottom
Fig. 5 Ti L3,2-edge XANES with m+and m2relative to the direction of
magnetization for the 0-3- and 2-2-type composites and the PTO powder. Bottom panel shows Ti L3,2-edge XMCD spectra of the 0-3- and 2-2- type
composites and the PTO powder.
panel in Fig. 5 displays the Ti L3,2-edge XMCD spectra of the 0-3- and 2-2-type composites and the PTO powder. Ti L3,2-edge XMCD reveals absence of the magnetic moment at the Ti sites in the 0-3- and 2-2- type composites, as in the bare PTO powder. In contrast, Garcia-Barriocanal et al.24 observed induced magnetic moment at the Ti sites in the interface region of the LMO-STO epitaxial system and argued that it was caused by the interaction between Ti and Mn bands at the interface. The discrepancy may be due to the different electronic structures between the CFO–PTO composites and the LMO-STO epitaxial system. Based on the above results, the lower magnetic moment in the composites is closely related to the compressive strain of CFO. The compressive strain of CFO in the composites was clearly observed in the XRD study.
Three main causes of the reduction of the magnetic moment in the CFO–PTO composites due to AFM interaction are possible. They are (i) the migration of cations between the A and B sites in CFO, (ii) charge transfer between Co/Fe and Ti cations at the interface and (iii) the formation of APBs.25Cause (i) can be excluded, because there is no signature of the migration of cations from A to B sites (or vice versa) obtained from EXAFS and XMCD studies for the composites. The Ti L3,2 -edge XMCD study also ruled out cause (ii), i.e., charge transfer between Co/Fe and Ti cations at the interface. On the other hand, Margulies et al.25found that APBs, or stacking defects,
are an intrinsic consequence of the nucleation and growth mechanism of spinel films (Fe3O4 on MgO); they can significantly affect the magnetic properties and depend strongly on the strain that is caused by the lattice mismatch in the spinel films. Fig. 6 schematically depicts the mechanism of magnetic orderings in the samples. Fig. 6(a) shows the magnetic structure of the CFO powder, in which the A-site cations (FeA3+and CoA2+) and B-site cations (FeB3+, FeB2+and CoB2+) have oppositely directed spins because of the AFM interaction between the A and B-sites. Fig. 6(a) also illustrates that the bare CFO powder favors the in-phase domain structure, in which cations in one domain are FM-coupled (parallel) to those in another domain. Fig. 6(b) and 6(c) present the magnetic structures of the 0-3- and 2-2-type composites, respectively. A- and B-site cations have oppositely directed spins whereas all cations at the A-site are FM-coupled, so are those at the B-site. Fig. 6(b) and 6(c) further indicate that due to compressive strain in the 0-3-type and 2-2-type composite, respectively, converts some of the in-phase domain structure that is found in the bare CFO powder to an anti-phase domain structure. In the anti-phase domain structure, the cations in one domain are AFM-coupled (antiparallel) with the cations in other domains.
Based on the above results, the strengthening of the AFM interaction by the formation of APBs may reasonably explain
Fig. 6 Possible mechanisms of magnetic orderings in (a) the CFO powder, (b) the 0-3-type composite and (c) the 2-2-type composite. Layers of films (Si substrate, Pt, PTO and CFO) are shown in different colors (black, gray, light orange and light green, respectively), whereas CFO particles are shown in light green (in the elliptical shape). The sets of two blue cubes and two orange cubes represent the in-phase and anti-phase domain structures of CFO, respectively. Arrows in different colors (red, black, yellow, blue and green) indicate the spin directions of cations (FeA3+, CoA2+, CoB2+, FeB3+and FeB2+, respectively) in the CFO domains. Isolated
(non-interacting) domains of CFO are represented by green cubes.
why the saturation magnetization in the 0-3- and 2-2-type composite are lower than that in the CFO powder. The APBs formation is more dominating in 2-2-type compared to 0-3-type due to larger compressive stain [see Fig. 6(b) and 6 (c)]. Therefore, the effect of the strain that was caused by the different geometries of the segregated phases is to form APBs in the 0-3- and 2-2-type composites, which further influences their magnetic properties.
4. Conclusion
In summary, the magnetic properties of the CFO–PTO composites were investigated using XANES, EXAFS, XMCD and ESMH. The EXAFS study confirms the mixed-spinel structure of CFO. The effect of redistribution of cations or Ti ions in the PTO matrix on the magnetic properties of the composites was ruled out by the Co and Fe K-edge EXAFS, Co, Fe and Ti L3,2-edge XMCD. The present results further support the finding that a significant reduction of the magnetic moments in the CFO–PTO composites is most likely caused by the formation of APBs, which could be generated by the compressive strain in CFO in the PTO matrix. A larger compressive strain and the formation of more APBs were observed in the 2-2-type than the 0-3-type composite.
Acknowledgements
The author (WFP) is grateful to the National Science Council of Taiwan for financial support of this research under Grant No. NSC 99-2119-M-032-004-MY3.
References
1 S.-W. Cheong and M. Mostovoy, Nat. Mater., 2007, 6, 13. 2 Y. Wang, J. Hu, Y. Lin and C.-W. Nan, NPG Asia Mater.,
2010, 2, 61.
3 J. Wang, J. B. Neaton, H. Zheng, V. Nagarajan, S. B. Ogale, B. Liu, D. Viehland, V. Vaithyanathan, D. G. Schlom, U. V. Waghmare, N. A. Spaldin, K. M. Rabe, M. Wuttig and R. Ramesh, Science, 2003, 299, 1719.
4 M. Fiebig, Th. Lottermoser, D. Fro¨hlich, A. V. Goltsev and R. V. Pisarev, Nature, 2002, 419, 818.
5 J. F. Scott, J. Mater. Chem., 2012, 22, 4567.
6 C. N. R. Rao and C. R. Serrao, J. Mater. Chem., 2007, 17, 4931.
7 W. Prellier, M. P. Singh and P. Murugavel, J. Phys.: Condens. Matter, 2005, 17, R803.
8 J. Ma, J. Hu, Z. Li and C.-W. Nan, Adv. Mater., 2011, 23, 1062.
9 M. Overby, A. Chernyshov, L. P. Rokhinson, X. Liu and J. K. Furdyna, Appl. Phys. Lett., 2008, 92, 192501.
10 G. Liu, C. W. Nan and J. Sun, Acta Mater., 2006, 54, 917. 11 C. W. Nan, M. I. Bichurin, S. Dong, D. Viehland and
G. Srinivasan, J. Appl. Phys., 2008, 103, 031101.
12 C. W. Nan, G. Liu, Y. Lin and H. Chen, Phys. Rev. Lett., 2005, 94, 197203.
13 K. Raidongia, A. Nag, A. Sundaresan and C. N. R. Rao, Appl. Phys. Lett., 2010, 97, 062904.
14 M. Pan, Y. Liu, G. Bai, S. Hong, V. P. Dravid and A. K. Petford-Long, J. Appl. Phys., 2011, 110, 034103.
15 I. Levin, J. Li, J. Slutsker and A. L. Roytburd, Adv. Mater., 2006, 18, 2044.
16 J. Zhai, Z. Xing, S. Dong, J. Li and D. Viehland, J. Am. Ceram. Soc., 2008, 91, 351.
17 M. Murakami, K.-S. Chang, M. A. Aronova, C.-L. Lin, M. H. Yu, J. H. Simpers, M. Wuttig, I. Takeuchi, C. Gao, B. Hu, S. E. Lofland, L. A. Knauss and L. A. Bendersky, Appl. Phys. Lett., 2005, 87, 112901.
18 J. H. Park, J.-H. Lee, M. G. Kim, Y. K. Jeong, M.-A. Oak, H. M. Jang, H. J. Choi and J. F. Scott, Phys. Rev. B, 2010, 81, 134401.
19 H. Takagi and H. Y. Hwang, Science, 2010, 327, 1601. 20 Y.-H. Hsieh, J.-M. Liou, B.-C. Huang, C.-W. Liang, Q. He,
Q. Zhan, Y.-P. Chiu, Y.-C. Chen and Y.-H. Chu, Adv. Mater., 2012, 24, 4564.
21 M. Feng, W. Wang, Y. Zhou, H. Li and D. Jia, J. Mater. Chem., 2011, 21, 10738.
22 H. Hwang, Y. Iwasa, M. Kawasaki, B. Keimer, N. Nagaosa and Y. Tokura, Nat. Mater., 2012, 11, 103.
23 C. Aruta, M. Angeloni, G. Balestrino, N. G. Boggio, P. G. Medaglia, A. Tebano, B. Davidson, M. Baldini, D. Di Castro, P. Postorino, P. Dore, A. Sidorenko, G. Allodi and R. De Renzi, J. Appl. Phys., 2006, 100, 023910.
24 J. Garcia-Barriocanal, J. C. Cezar, F. Y. Bruno, P. Thakur, N. B. Brookes, C. Utfeld, A. Rivera-Calzada, S. R. Giblin, J. W. Taylor, J. A. Duffy, S. B. Dugdale, T. Nakamura, K. Kodama, C. Leon, S. Okamoto and J. Santamaria, Nat. Commun., 2010, 1, 82.
25 D. T. Margulies, F. T. Parker, M. L. Rudee, F. E. Spada, J. N. Chapman, P. R. Aitchison and A. E. Berkowitz, Phys. Rev. Lett., 1997, 79, 5162.
26 C. Y. Tsai, H. R. Chen, F. C. Chang, W. C. Tsai, H. M. Cheng, Y. H. Chu, C. H. Lai and W. F. Hsieh, Appl. Phys. Lett., 2013, 102, 132905.
27 E. Stavitski and F. M. F. de Groot, Micron, 2010, 41, 687. 28 V. Chakarian, Y. U. Idzerda, H. J. Lin, C. Gutierrez, G.
A. Prinz, G. Meigs and C. T. Chen, Phys. Rev. B, 1996, 53, 11313.
29 J. Wang, X. Pang, M. Akinc and Z. Lin, J. Mater. Chem., 2010, 20, 5945.
30 Y.-F. Chen, T. Yu, J.-X. Chen, L. Shun, P. Li and N.-B. Ming, Appl. Phys. Lett., 1995, 66, 148.
31 S.-H. Lee, H. M. Jang, S. M. Cho and G.-C. Yi, Appl. Phys. Lett., 2002, 80, 3165.
32 W. F. Pong, M. H. Su, M.-H. Tsai, H. H. Hsieh, J. Y. Pieh, Y. K. Chang, K. C. Kuo, P. K. Tseng, J. F. Lee, S. C. Chung, C. I. Chen, K. L. Tsang and C. T. Chen, Phys. Rev. B, 1996, 54, 16641.
33 J. A. Moyer, C. A. F. Vaz, D. A. Arena, D. Kumah, E. Negusse and V. E. Henrich, Phys. Rev. B, 2011, 84, 054447.
34 M. V. Limaye, S. B. Singh, S. K. Date, D. Kothari, V. R. Reddy, A. Gupta, V. Sathe, R. J. Choudhary and S. K. Kulkarni, J. Phys. Chem. B, 2009, 113, 9070.
35 G. Martens, P. Rabe, N. Schwentner and A. Werner, Phys. Rev. Lett., 1977, 39, 1411.
36 C. Piamonteze, H. C. N. Tolentino, A. Y. Ramos, N. E. Massa, J. A. Alonso, M. J. Martinez-Lope and M. T. Casais, Phys. Rev. B, 2005, 71, 012104.
37 E. Arenholz, G. van der Laan, R. V. Chopdekar and Y. Suzuki, Phys. Rev. B, 2006, 74, 094407.
38 G. van der Laan, E. Arenholz, R. V. Chopdekar and Y. Suzuki, Phys. Rev. B, 2008, 77, 064407.
39 C. H. Kim, Y. Myung, Y. J. Cho, H. S. Kim, S.-H. Park, J. Park, J.-Y. Kim and B. Kim, J. Phys. Chem. C, 2009, 113, 7085.
40 B. T. Thole, P. Carra, F. Sette and G. van der Laan, Phys. Rev. Lett., 1992, 68, 1943.
41 P. Carra, B. T. Thole, M. Altarelli and X. D. Wang, Phys. Rev. Lett., 1993, 70, 694.
42 C. T. Chen, Y. U. Idzerda, H. J. Lin, N. V. Smith, G. Meigs, E. Chaban, G. H. Ho, E. Pellegrin and F. Sette, Phys. Rev. Lett., 1995, 75, 152.
43 O. Hjortstam, J. Trygg, J. M. Wills, B. Johansson and O. Eriksson, Phys. Rev. B, 1996, 53, 9204.
44 D. Weller, J. Sto¨hr, R. Nakajima, A. Carl, M. G. Samant, C. Chappert, R. Me´gy, P. Beauvillain, P. Veillet and G. A. Held, Phys. Rev. Lett., 1995, 75, 3752.
45 S. C. Ray, H. C. Hsueh, C. H. Wu, C. W. Pao, K. Asokan, M. T. Liu, H. M. Tsai, C. H. Chuang, W. F. Pong, J. W. Chiou, M.-H. Tsai, J. M. Lee, L. Y. Jang, J. M. Chen and J. F. Lee, Appl. Phys. Lett., 2011, 99, 042909.
46 A. Mesquita, A. Michalowicz and V. R. Mastelaro, J. Appl. Phys., 2012, 111, 104110.