1
行政院國家科學委員會補助專題研究計畫
行政院國家科學委員會補助專題研究計畫
行政院國家科學委員會補助專題研究計畫
行政院國家科學委員會補助專題研究計畫
□
□
□
□ 成 果 報 告
成 果 報 告
成 果 報 告
成 果 報 告
■
■
■
■期中進度報告
期中進度報告
期中進度報告
期中進度報告
(計畫名稱)
依序利用 Oximeter 診斷重度及 PSG 診斷輕、中度阻塞
性睡眠缺氧症以降低醫療成本
計畫類別:■ 個別型計畫 □ 整合型計畫
計畫編號:NSC98-2410-H-039-003-MY2
執行期間: 98 年 08 月 01 日至 100 年 07 月 31 日
計畫主持人:陳永福
共同主持人:杭良文、林妍如、林宣宏
計畫參與人員:廖怡岑、黃春森
成果報告類型(依經費核定清單規定繳交):■精簡報告 □完整報告
本成果報告包括以下應繳交之附件:
□赴國外出差或研習心得報告一份
□赴大陸地區出差或研習心得報告一份
■出席國際學術會議心得報告及發表之論文各一份
□國際合作研究計畫國外研究報告書一份
處理方式:除產學合作研究計畫、提升產業技術及人才培育研究計畫、
列管計畫及下列情形者外,得立即公開查詢
□涉及專利或其他智慧財產權,□一年■二年後可公開查詢
執行單位:中國醫藥大學醫務管理學系
中 華 民 國 99 年 05 月 31 日
2
中文摘要
中文摘要
中文摘要
中文摘要
阻塞性睡眠呼吸中止症(OSA)是導致慢性病的重要原因,包括代謝症候群、慢性過度 換氣症候群、上胸呼吸型疾病、氣管發炎、阻塞性肺部疾病、神經肌肉症、小兒麻痺、肥 胖症、心衰竭、顱顏異常、人格改變、智力異常、認知不足、體力改變、注意力衰弱或勃 起功能異常等。它也是造成車禍的重要原因,先前的研究顯示,罹患 OSA 之病人較正常人 之車禍發生率提高 2~7 倍。 睡眠多項生理檢查(PSG)是一項複雜的診斷檢查,它可以在受測者睡眠時測量及記載 多個生理變項,其中,第一型 PSG 被視為診斷阻塞性睡眠呼吸中止症(OSA)的黃金標準。 但是其缺點為檢查人力需求大、費時、價格昂貴。本研究之動機為:(1)根據先前的研究報 告顯示,即使在已開發國家(例如歐洲、澳洲、美國、加拿大),等候 PSG 檢查之時間很 長;(2)簡單便宜的家庭式診斷工具結合問卷可以有效預測嚴重的 OSA 患者;(3)利用支援 向量機等人工智慧技術來設計臨床診斷支援系統可以提昇診斷之正確率。本計畫之目的為 經由問卷及簡單儀器(血氧機診斷)獲得之參數,利用人工智慧技術設計臨床診斷支援(CDS) 系統來有效診斷嚴重之 OSA 病人,馬上進行治療。本計畫之目標為:(1)臨床檢驗家測式血 氧機(oximeter)診斷 OSA 病人之效率;(2)研究病患在睡眠實驗室之實際睡眠時間為多久時 才具有診斷價值;(3)利用支援向量機(support vector machine)來設計 CDS 系統診斷 OSA 病 人;(4)分析目前健保體制下,首先以血氧機診斷重症 OSA 病患,然後再以 PSA 診斷正常、 輕度、中度 OSA 病患過程中之成本效益。 本研究共收集 699 個疑似 OSA 病例,利用 PSG 進行睡眠檢查,去除 20 歲以下及 85 歲 以上之病例後剩下 651 個病例,另外如果移除睡眠不足 4 小時之病例後,只剩下 561 筆資 料供後續分析。經由統計分析及參數篩選之後利用 SVM 進行預測模型之建構,進行重度病 人(AHI>30)或中度以上病人(AHI>15)之偵測。初步研究結果顯示,以所設計之 CDS 系統雛 型,利用氧氣未飽和指數(Oxygen Desaturation Index, ODI)變數作為診斷參數時,診斷重症 病患 (準確率:89.04%、靈敏度:94.52%、專一度:82.36%)及中度以上病人(準確率:87.05%、 靈敏度:88.57%、專一度:86.25%)之診斷效率佳。此結果(靈敏度/專一度)比最近所發表 之結果(重症:87.8%/96.6%、中度以上:84.0%%/84.4%%)之效能更好。初步之成本效益 分析顯示,在目前台灣之健保付費制度下,利用本研究所提出的方法,平均每一病例成本 可以降低台幣 1577 元 (34.58%) 之成本。 關鍵詞 關鍵詞 關鍵詞 關鍵詞: 阻塞性睡眠呼吸中止症、血氧濃度計、支援向量機器、基因演算法、睡眠多項生理 檢查(PSG)、成本效益分析。3
Abstract
Obstructive sleep apnea (OSA) is a significant cause of motor vehicle crashes and chronic diseases. Polysomnography (PSG) has been widely applied in the diagnosis of OSA that a number of physiologic variables are measured and recorded during sleep. Although PSG is treated as the gold standard for diagnosing OSA, it is labor-intensive, time-consuming, and expensive. Therefore, clinical diagnosis of high-risk OSA patients using questionnaires and cheap home diagnostic devices has a great potential in reducing healthcare cost and in eliminating insomnia caused by environmental variation for some patients when tested in the sleeping center. A total of 699 patients with possible OSA had been recruited and tested using PSG for overnight attending at the Sleep Center of China Medical University Hospital from Jan. 2004 to Dec. 2005. Subjects with age less than 20 or more than 85 years old were excluded, only 651 patient data were used for analysis. Furthermore, by removing data collected from patients with sleeping time less than 4 hours, only the data of 561 patients were used for further analysis. After statistical analysis and feature selection, a model constructed based on support vector machine (SVM) was then used to discriminate severe (AHI>30) or severe and moderate (AHI>15) patients from other subjects. The results show that oxyhemoglobin desaturation index (ODI) alone provide satisfactory diagnostic performance in diagnosing severe OSA patients (accuracy: 89.04%, sensitivity: 94.52%, specificity: 82.36%) and combined severe and moderate OSA patients (accuracy: 87.05%, sensitivity: 88.57%, specificity: 86.25%). Based on the cost-benefit analysis, we suggest that home-styled oximeter can be used to sift severe patients from all suspected patients at the first stage, which is then followed by the PSG examination for discriminating normal subjects and mild and moderate patients. It was found that an average cost reduction of NT$1577 (34.58%) per case can be achieved under the current Taiwanese insurance setting.
Keywords: Obstructive sleep apnea (OSA), Oximetry, Support Vector Machine (SVM),
4
1.
Introduction
Sleep disorder is a spectrum of diseases which include snoring, upper airway resistance syndrome and obstructive sleep apnea (OSA) (Pang et al. 2006). It highly linked to hypertension due to sleep fragmentation, intermittent hypoxemia, and increased sympathetic tone. Snoring has strong relationship with daytime sleepiness (80%), obesity (73%), and chronic fatigue (78%) (Hunsaker et al. 2006). Obstructive sleep apnea (OSA) is a common sleep disorder and is commonly seen in 24% of men and 9% of women (Young et al. 1993). Among them, up to 93% of women and 82% of men have not been diagnosed (Young et al. 1997). Furthermore, OSA is a significant cause of motor vehicle crashes resulting in an increased risk of 2-7 folds (N. Hartenbaum et al. 2006) and causes of several chronic diseases. For example, OSA was found to closely relate to metabolic syndrome, an established cardiovascular risk factor, in middle-aged subjects (Lam et al. 2006); chronic hyperventilation syndrome and upper chest breathing pattern disorders (Coffee 2006); bronchial inflammation (Devouassoux et al. 2007); obstructive pulmonary disease, neuromuscular disease, poliomyelitis, obesity, cardiovascular disease, and cranio-facial anomalies (Coffee 2006, Taman and Gozal 2006); personality change and intellectual impairment (Montplaisir et al. 1992); cognitive deficits, vigilance alteration and attentional decline (Gosselin et al. 2006); and erectile dysfunction (Teloken et al. 2006).
Polysomnography (PSG) is treated as the gold standard for detecting Patients with OSA (Chesson et al. 2003, Flemons et al 2003). It is a diagnostic test during which a number of physiologic variables are measured and recorded during sleep. Currently, PSG monitors can be classified into four different types based on the number of channels used to record biological signals, in which Type 1 monitor is in-laboratory, overnight, and technician-attended polysomnograph that has been used as the reference standard to which other types of monitors are compared (Flemons et al. 2003). In contrast, Type 2 monitor is a comprehensive portable polysomonogram (PSG) that a minimum of 7 channels, such as electroencephalograph (EEG), elctrooculograph (EOG), chin electromyography (EMG), electrocardiograph (ECG) for measuring heart rate, airflow, inductance plethysmorgraphy for recording respiratory effort, and
5
oximetry for measuring arterial oxygen saturation, are used to record the bio-signals. On the other hand, Type 3 is a modified portable sleep apnea testing consists of a minimum of 4 channels including ventilation or airflow (2 channels), ECG or heart rate, and Oxyhemoglobin saturation. In contrast, Type 4 PSG is applied to continuously record only one or two biological parameters and has the potential to be used at home as a cheap diagnostic device for diagnosing OSA patients.
Prediction of OSA using questionnaires, demographics, clinical features, and physiological examination has been extensively studied in the last decade (Goncalves et al. 2004, Dixon et al. 2003, Pang et al. 2006). Goncalves et al. (2004) used Epworth sleeping scale (ESS), the sleeping disorders questionnaire, the Beck depression inventory (BDI), the medical outcome study 36-item short form health survey (SF-36), and a questionnaire on driving difficulties and accidents to evaluate subjects who were suspected to have sleep-disordered breathing (SDB) or obstructive sleep apnea. Among them, ESS was found to be correlated to arousal index and AHI (Goncalves et al. 2004), which contradicted to the investigations done by Pang et al. (2006) and Dixon et al. (2003). Khoo et al. (2004) used questionnaires, containing questions regarding snoring, choking, suffocating, and abrupt awaking during sleep, to study Asian populations including Chinese, Malaysian, and Indian. It was found that the risk factors are similar to white populations in strong association of snoring and sleep apnea with male gender, older age, obesity, family history, and smoking. In addition, demographic, clinical, and biochemical factors including age, sex, observed sleep apnea, fasting insulin, glycosylated hemoglobin AIC, and central (waist circumference, BMI) and upper body (neck circumference) obesity were found to significantly increase the risk of higher AHI for the severely obese patients (Dixon et al. 2003). Strong correlation between patient self-perception and clinical examination, including Friedman tongue position grade and Friedman clinical staging, of OSA severity and AHI was also found (Pang et al. 2006).
Although PSG is treated as the gold standard, it, however, is time-consuming, labor-intensive, and expensive (Pang et al. 2006). According to a recent report, waiting time for accessing to diagnosis and treatment of patients with suspected OSA is lengthy even in the developed counties
6
around Europe, Australia, the United States, and Canada. For example, it was estimated that the waiting time for non-urgent referrals for a sleep study ranges from 0 to 48 months in UK, 2 weeks to 2 months in Belgium, 4 to 68 weeks in Australia, a few weeks to more than a year in the US, and 8 to 30 months in Canada (Flemons et al. 2004). In Taiwan, the waiting time is between 1 to 7 months depending on which hospitals the patients have been referred. For example, the average waiting time of an academic hospital located in central Taiwan area is around 2 months based on the information provided by the co-advisor (Dr. Hang). Hence, other devices which are cheap, safe, and accurate; readily and easily accessed; and have no risk or side effect to the patients are valuable and needed for decreasing waiting time and cost for OSA diagnosis (Pang et al. 2006).
In addition to labor-intensive, time-consuming, and high examination cost, PSG also has other limitations, such as technical expertise required and timely access restricted (Flemons et al. 2003). Thus, several alternative and simpler diagnostic devices have been evaluated. Home pulse oximeter has been proposed as a valuable screening tool, although its effectiveness in screening patients with OSA has been debated for several years (Netzer et al. 2001). Several studies have assessed its usefulness, but sometimes with conflicting results (Choi et al 2000, Shinji et al. 2002, Juan-Carlos et al. 2000). For example, home overnight oximetry was found to be not very correlated with PSG for testing children (Kirk et al. 2003) and to be inconsistent with night-to-night variability for aged patients with chronic obstructive pulmonary disease (COPD) (Lewis et al. 2003). On the other hand, Brouillette et al. (2000) concluded that oximetry could be used to diagnose OSA for children with a positive predictive value of 97%, but a negative oximetry result cannot be use to rule out OSA.
In this study, we aimed to construct a predictive model for clinical prediction of high-risk OSA patients using fewer parameters (channels) by home-styled devices to diagnose some of severe patients followed by PSG examination to discriminate normal, mild, and moderate patients. Compared to the traditional setting that all suspected patients have to take PSG examination, the proposed scheme takes the advantage of simple and cheap home monitoring devices applied in
7
OSA diagnosis for reducing healthcare cost and increasing diagnostic efficiency. According to the cost-benefit and risk analyses, the proposed scheme has demonstrated to have a great potential in reducing healthcare cost, increasing efficiency, and eliminating insomnia effect caused by environmental change for some patients when tested in the sleeping center.
2. Materials and Methods
This study was designed to compare the benefits between the traditional PSG examination which only can be done in the sleeping center and a new proposed scheme that pulse oximetry is tested at home followed by the PSG examination. The logical thinking and study design process are shown in Figure 1. The study subjects, physiological signal measurements, and analytical techniques are described as follows.
Traditional OSA detection Newly proposed OSA detection
Subjects Subjects PSG Normal Mild OSA Moderate OSA Severe OSA Oximetry PSG SVM Severe OSA Non-severe OSA Normal Mild OSA Moderate OSA Mild OSA Moderate OSA
Figure 1. Proposed method for diagnosing patients with OSA.
Study Subjects
A total of 699 patients with possible OSA have been recruited and tested using PSG devises for overnight attending recording at the Sleep Center of one medical center in middle Taiwan from Jan. 2004 to Dec. 2005. Forty-eight subjects whose ages less than 20 or more than 85 years old were excluded from the study (Lam et al., 2006). Hence only data obtained from 651 patients
8
were used for further analysis. In order to compare the effect of not enough sleeping time, patients with sleeping time less than 4 hours were also excluded, resulting in a total of 561 patients for analysis. The study has been approved by Institute of Reviewing Board (IRB) of China Medical University.
Physiological Signal Measurements
Traditional measurements with PSG only: Alice 4 PSG recorder (Respironics Inc., USA)
was used to monitor and record patient PSG, during which a number of physiologic variables are measured and recorded during sleep. Physiologic sensors are used to record (1) EEG for detecting brain electrical activity and sleep staging on the basis of 30-sec epochs, (2) EOG and submental EMG for detecting eye and jaw muscle movement, (3) tibia EMG for monitoring leg muscle movement, (4) airflow for detecting breath interruption, (5) inductance plethysmorgraphy for estimating respiratory effort (chest and abdominal excursion), (6) ECG for measuring heart rate, and (7) arterial oxygen saturation by using oximeter.
Proposed measurements with home oximetry followed by PSG: Demographic (age,
gender, etc.), questionnaires of Epworth scaling score (ESS), and symptom questionnaires related to OSA diagnosis were filled by the patients before PSG recording. Anthropometric (weight, height, BMI, waist, neck and hip circumfences, etc.) were also measured and checked by the technicians. Here we aim to investigate the sensitivity of the proposed policy with an eximeter being brought home for over-night measurement to detect severe patients followed by PSG examination for diagnosing mild and moderate OSA patients. Since the cost of a PSG examination is much higher than oximetry test, it is expected to be cost-effective for the proposed policy.
Analytical techniques
Demographic and anthropometric data of patients were analyzed using descriptive statistical analysis for calculating means and standard deviations of individual variables. Inferential statistical analyses including t-test, univariate analysis, and multiple regression analysis were also
9
applied to detect significant variables for further discriminating among normal subjects and mild, moderate, and severe OSA patients and for diagnosing severe patients (AHI>=30) and combined moderate and severe patients (AHI>=15).. Finally, support vector machine was used to construct a predictive model based on the selected variables for developing a cheap computer-assisted diagnostic system.
Support vector machine
The Support vector machine (SVM) technique was first developed by Vapnik and his group in former AT&T Bell Laboratories. It is a useful technique for data classification and regression and has become an important tool for machine learning and data mining. In general, SVM has better performance when competed with existing methods, such as neural networks and decision trees (Brown et al., 2000; DeCoste & Schuolkopf, 2002; Lecun et al., 1995). Recently, application of SVM in medicine has grown rapidly. For examples, it has been applied in prediction of RNA-binding sites in proteins (Tong, Jiang, & Lu, 2008), discrimination of malignant and benign cervical lymph nodes (Zhang, Wang, Dong, & Wang, 2008), disease diagnosis using tongue images (Zhi, Zhang, Yan, Li, & Tang, 2007), and diagnoses of cardiovascular disease (Eom, Kim, & Zhang, 2008) and breast cancer (Polat & Gunes, 2007). The support vector machine (SVM) is a supervised learning method widely used for classification (Vapnik, 1995; Chang and Lin, 2001). A special property of SVM is that it can simultaneously minimize the empirical classification error and maximize the geometric margin. Its goal is to separate multiple clusters with a set of unique hyperplanes with greatest margin to the edge of each cluster, where each hyperplane separating two cluster is not unique for ordinary linear classifiers.
10
Support vector machine (SVM) was first developed by Vapnik and his group in former AT&T Bell Laboratories. It is a useful technique for data classification and has become an important tool for machine learning and data mining. In general, SVM has better performance when competed with existing methods, such as neural networks and decision trees (Brown et al., 2000; DeCoste & Schuolkopf, 2002; Lecun et al., 1995).
Given a two-class linearly separable problem, the hyperplane separating two classes leaving the maximum margins from both classes is represented as (Theodoridis and Koutroumbas, 2003; Cristianini and Shawe-Taylor, 2000)
:
0 )
( = +w0 = g x wTx
(1)
The training data of two classes can be represented as (xi, yi) with xi∈Rn, yi∈{+1,-1}, and
i=1,2,…N, in which sample xi is an N-dimensional input vector and yi is its corresponding label
indicating the class of xi. By scaling the orthogonal vector w and bias w0 in Eq. (1) to make the
values of g(x) at the nearest points in class 1 and class 2 equal to 1 and -1, respectively, the problem of obtaining the optimal hyperplane becomes a nonlinear quadratic optimization problem, which can be formulated as:
N i w yi T i w 2 , Subject to ( ) 1, 1,2,..., Min 0 2 , 0 w x + ≥ = w w (2)
The problem can be solved by considering Lagrangian duality and be stated equivalently by its Wolfe dual representation form with the constraints satisfying the Karush-Kuhn-Tucker (KKT) conditions, i.e. ∂L(w w, 0,λ)/∂w=0 , ∂L(w,w0,λ)/∂w0=0 , [y( i+ w0)−1]=0 T i i w x λ , and N i i≥0for =1,... λ :
∑
= + − = N i i T i i y w w L 1 0 2 0 [ ( )-1] 2 ) , , ( Max w λ w λ w x (3a) N i λ y y N i i i i N i i i i , 0 ,and 0for 1,... Subject to 1 1 = ≥ = =∑
= λ x∑
= λ w (3b)where L(w,w0,λ) is a Lagrangian function and λ is the vector of Lagrangian multipliers
corresponding to the constraint in Eq.(2). In contrast to Eq. (2), the first two constraints in Eq. (3) become equality constraints and make the problem easier to handle. Finally, by substituting the first two constraints in (3b) into (3a), the problem is formulated below:
11 N i y y y N i i i i N j i j T i j i j i N i i ,... 1 , 0 with 0 Subject to ), 2 1 ( Max 1 1 , 1 = ≥ = −
∑
∑
∑
= = = λ λ λ λ λ x x λ (4)As soon as the Lagrangian multipliers have been obtained by maximizing the above equation, the optimal hyperplane can be obtained from w=
∑
Ni=1λiyixiin Eq. (3). Once the optimal hyperplanehas been obtained, classification of a sample is performed based on the sign of the following equation: ) sgn( ) sgn( ) ( 0 1 0 y w w f Ns i i T i i i T + = + =
∑
= x x x w xλ
(5)where Ns is the number of support vectors.
For a nonlinear classification problem, the optimization problem shown in Eq. (2) is changed to: N i w y C i i i T i N i i w ,..., 2 , 1 0, and , -1 ) ) ( ( Subject to , ) 2 ( Min 0 1 2 , 0 = ≥ ≥ + +
∑
= ξ ξ φ ξ x w w w (6)where C is a positive penalty parameter, variables ξi with i= 1,…,N are used to weight the cost of
misclassified samples, and φ(xi) is a function applied to map the training sample xi to a higher
dimensional space. For a vector x∈Rn in the original feature space, it is assumed that there exists a function φfor mapping x∈Rn to y=φ(x)∈Rk with k > n. Then, the following formula is true
) , ( ) ( ) (x r z K x z r r =
∑
φ φ (7)where φr(x) is the rth component of the mapping and K(x,z) is a symmetric function satisfying the
following condition:
∞ ≤
≥
∫
∫
K(x,z)g(z)dxdz 0, and g(x)2dx (8) Finally, the optimization problem in Eq. (4) is reformulated as:∑
∑
∑
= = = ≤ ≤ = − N i i i i N j i j T i j i j i N i i C λ y K y y 1 1 , 1 0 with 0 Subject to ), ) ( 2 1 ( Max λ λ λ λ x x λ (9)12
For a nonlinear classifier, various kernels including polynomial, radial basis function, and hyperbolic tangent can be used for mapping the original sample space into a new Euclidian space with Mercer’s conditions are satisfied. The linear classifier can then be designed for classification. Among them, radial basis function, as shown in the following equation, is the most widely used function and is applied in this study for feature mapping.
) exp( ) , (x z = −γ x−z2 K (10)
Cross validation of the SVM model is achieved by dividing the data into n folds (clusters), in which n-1 folds are used for training the model while 1 fold for testing. For example, consider a data set which contains 600 samples and 6 folds are used for constructing and validating the model, in which each fold consists of 100 samples that 500 will be used for training and 100 for testing the prediction rate of the model.
3. Experimental Results
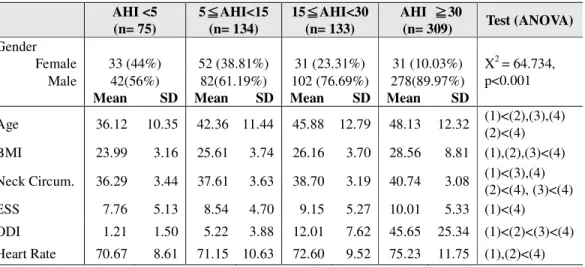
In the first experiment, the tested subjects were divided into 4 groups based on AHI values. Table 1 shows 6 variables, including age, body mass index (BMI), neck circumference, ESS, Oxyhemoglobin desaturation index (ODI), and heart rate, which reach significant level (p<0.05) after ANOVA test. The variables were then used as independent variables for SVM classification and for the prediction of normal (AHI<5) and different degrees of OSA severity including mild (5 ≦AHI<15), moderate (15≦AHI<30), and severe (30≦AHI).
Table 1. ANOVA tests of demographic, questionnaire, and PSG data obtained from patients across four stages of severity based on AHI value
AHI <5 (n= 75) 5≦≦≦AHI<15 ≦ (n= 134) 15≦≦≦≦AHI<30 (n= 133) AHI ≧≧≧30 ≧ (n= 309) Test (ANOVA) Gender Female 33 (44%) 52 (38.81%) 31 (23.31%) 31 (10.03%) X2 = 64.734, p<0.001 Male 42(56%) 82(61.19%) 102 (76.69%) 278(89.97%)
Mean SD Mean SD Mean SD Mean SD
Age 36.12 10.35 42.36 11.44 45.88 12.79 48.13 12.32 (1)<(2),(3),(4) (2)<(4) BMI 23.99 3.16 25.61 3.74 26.16 3.70 28.56 8.81 (1),(2),(3)<(4) Neck Circum. 36.29 3.44 37.61 3.63 38.70 3.19 40.74 3.08 (1)<(3),(4) (2)<(4), (3)<(4) ESS 7.76 5.13 8.54 4.70 9.15 5.27 10.01 5.33 (1)<(4) ODI 1.21 1.50 5.22 3.88 12.01 7.62 45.65 25.34 (1)<(2)<(3)<(4) Heart Rate 70.67 8.61 71.15 10.63 72.60 9.52 75.23 11.75 (1),(2)<(4)
Regarding the influence of gender in severity of OSA, as depicted in Table 1, the number of male is more than the female for the abnormal compared to the normal, especially for more severe stages. In addition, variables including age, BMI, neck circumference, ESS, heart rate, and
13
ODI reach levels of significant differences (p<0.05) among two or three stages. However, only ODI can be used to differentiate all of the 4 stages.
3-1 Discrimination of normal subjects and mild, moderate, and severe patients
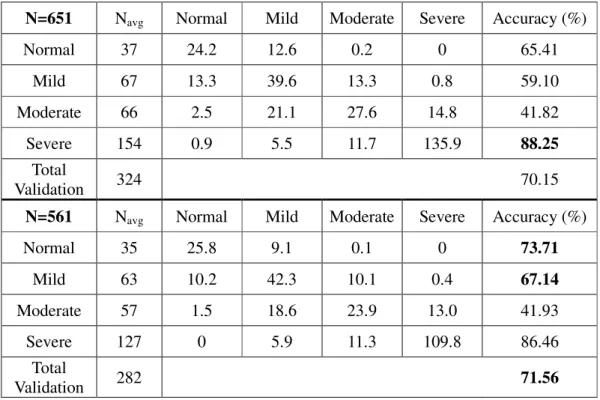
The confusion matrices of 4 OSA stages using ODI are shown in Table 2 for two datasets with 651 and 561 samples, respectively. It was observed that although various combinations of neck circumference, BMI, ESS, and ODI have been used for constructing predictive models, applying ODI alone as the predictor achieves similar prediction rate. This indicates that demographic information and questionnaires are not very useful in elevating the predicting efficiency. It was found that the predictive rate of diagnosing severe patients is high for both datasets consisting of 651 (accuracy: 88.25%) and 561 (accuracy: 86.46%) samples, respectively. The cross validation procedure was repeated for 10 times.
Table 2. Confusion matrices for classification of 4 groups with ODI used as predictor for two datasets with 651 and 561 samples, respectively. The matrix was obtained with 2-fold cross validation and repeated for 10 times. The predictive rates for normal and mild are better for the dataset with 561 samples, while the prediction rate of severe patients is better for the dataset with 651 samples.
Table 2. Confusion matrices for classification of 4 groups with ODI used as predictor for two datasets with 651 and 561 samples, respectively
N=651 Navg Normal Mild Moderate Severe Accuracy (%)
Normal 37 24.2 12.6 0.2 0 65.41 Mild 67 13.3 39.6 13.3 0.8 59.10 Moderate 66 2.5 21.1 27.6 14.8 41.82 Severe 154 0.9 5.5 11.7 135.9 88.25 Total Validation 324 70.15
N=561 Navg Normal Mild Moderate Severe Accuracy (%)
Normal 35 25.8 9.1 0.1 0 73.71 Mild 63 10.2 42.3 10.1 0.4 67.14 Moderate 57 1.5 18.6 23.9 13.0 41.93 Severe 127 0 5.9 11.3 109.8 86.46 Total Validation 282 71.56
14
3-2 Diagnosis of severe patients
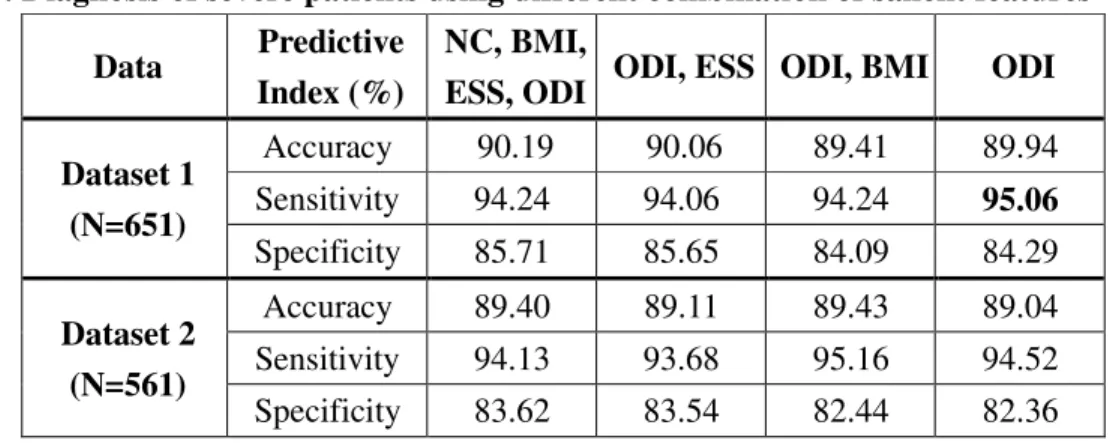
The subjects were divided into two groups using AHI=30 as the threshold to discriminate severity of OSA that the subjects were classified into non-severe (AHI<30) and severe (AHI>=30) groups. As shown in Tables 3, the successful prediction rates achieve 89-90% for different combination of independent variables. Again, it was found that ODI alone provides similar predictive accuracy (89-90% ) and sensitivity (94-95%) for the diagnosis of severe OSA patients.
Table 3. Diagnosis of severe patients using different combination of salient features
Data Predictive
Index (%)
NC, BMI,
ESS, ODI ODI, ESS ODI, BMI ODI
Dataset 1 (N=651) Accuracy 90.19 90.06 89.41 89.94 Sensitivity 94.24 94.06 94.24 95.06 Specificity 85.71 85.65 84.09 84.29 Dataset 2 (N=561) Accuracy 89.40 89.11 89.43 89.04 Sensitivity 94.13 93.68 95.16 94.52 Specificity 83.62 83.54 82.44 82.36
3-3 Diagnosis of severe and moderate patients
In this experiment, the subjects were divided into two groups with AHI=15 used as the threshold to discriminate severity of OSA by classifying the subjects into normal and mild (AHI<15) and moderate and severe (AHI>=15) groups. As shown in Tables 4, the successful prediction rates achieve about 86-87% for different combination of independent variables. Again, ODI alone provides similar predictive performance to other combinations of variables.
Table 4. Diagnosis of severe and moderate patients using different combination of salient features
Data Predictive
Index (%)
NC, BMI,
ESS, ODI ODI, ESS, ODI, BMI ODI
Dataset 1 (N=651) Accuracy 86.45 86.51 86.60 86.64 Sensitivity 85.96 85.38 87.02 87.12 Specificity 86.68 87.05 86.41 86.41 Dataset 2 (N=561) Accuracy 86.17 86.70 87.27 87.05 Sensitivity 85.61 87.45 88.27 88.57 Specificity 86.46 86.30 86.74 86.25
15
4. Discussions
As shown in the previous section, ODI alone provides good prediction in the diagnosis of OSA, while demographic and questionnaire variables are not very helpful to elevate the prediction rate, as reported by Lin et al. (2009). In addition, prediction accuracy using SVM is much higher than traditional linear discriminant.
4.1 Cost Benefit Analysis
As shown in Table 2, with regard to detection of normal, mild, moderate, and severe patients, the mean prediction rate achieves more than 86% in the detection of severe OSA patients, while there are only 40%-74% accuracy in detecting other three groups of subjects. Furthermore, as indicated in Table 3, for a two-class SVM classifier, the sensitivity in diagnosing severe OSA patients achieves as high as 94-95%. It is promising for oximetry to be used as a predictor for the diagnosis of severe patients, but not sensitive enough to detect normal patients. Taking the dataset containing 651 samples as an example, as shown in Table 3, among them, 95.06% (293) of the severe patients (309) who need to be treated immediately are expected to be diagnosed based on the oximetry. Regarding the whole population of this investigation, the percentage of severe patients is 309/651=47.47%, among them 95.06% can be detected; that is 47.47% x 95.06% = 45.12% of the total population who are suspected to have OSA can be accurately diagnosed as severe patients.
The sensitivity in detecting severe patients is 95.06%, which indicates that 4.96% of the subject will be treated as normal, mild, or moderate even they are severe. Further PSG test will be expected to diagnose these patients. On the other hand, the percentage of normal, mild and moderate patients who are diagnosed as severe is 15.71% (1–specificity) which accounts to 342/651 x 15.71%= 8.25% of the total population. According to Table 2, none of the normal subjects were diagnosed as severe patients, which indicated that the subjects being diagnosed as severe were mild or moderate OSA patients. Therefore, it is acceptable for this miss diagnosis since some investigations suggest that mild and moderate patients also need treatment using CPAP. We suggest that oximeter is efficient to be used for diagnosing severe OSA patients.
In conclusion, the predictive model is suitable for predicting severe patients using cheaper oximetry while the non-severe patients including normal, mild, and moderate patients are needed to be confirmed using more expensive PSG. Based on the current health insurance payments in Taiwan, the expense for taking a PSG examination is NT$4560 while it takes only NT$480 for oximeter. Hence the average cost per case for OSA detection is 480 x (45.12%) + (480 + 4560) x (1 -45.12%) = NT$2983. The cost is lower than the situation that all the subjects are examined using PSG with a saving of NT$1577 (34.58%) for each case.
16
4.2 Consideration of Sleeping Time
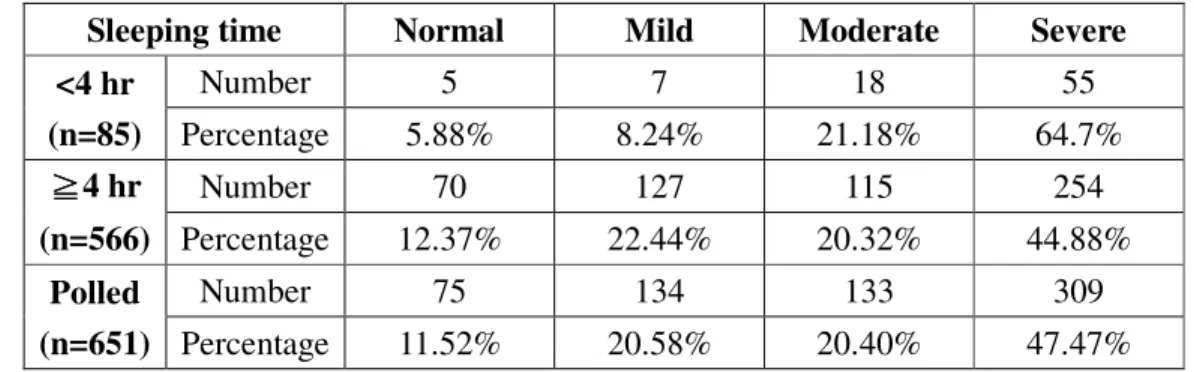
Subjects who do not have enough sleep time during the experiment might have influence on accurate prediction of OSA severity. In this experiment, among the 651 subjects, 85 who have sleeping time less than 4 hours may be excluded (Lam et al. 2006). Table 5 compares the number and percentage of subjects with sleeping time less than and more than 4 hours threshold.
Table 5. A comparison of distribution of subjects based on length of sleeping time
Sleeping time Normal Mild Moderate Severe
<4 hr (n=85) Number 5 7 18 55 Percentage 5.88% 8.24% 21.18% 64.7% ≧ ≧ ≧ ≧4 hr (n=566) Number 70 127 115 254 Percentage 12.37% 22.44% 20.32% 44.88% Polled (n=651) Number 75 134 133 309 Percentage 11.52% 20.58% 20.40% 47.47%
Although Lam et al. (2006) excluded subjects with sleeping time less than 4 hours, the reason why these data were removed is not reported. Here, we compare two groups, one is consisted of the subjects who slept less than 4 hours (SL) and the other contains subjects who have slept more than 4 hours (SM). By analyzing the data shown in Table 8 using contingency table X2 statistical test, the result shows that significant difference (p<0.001) exists between two groups (chi-square = 16.1 and degrees of freedom = 3). As indicated in the table, the percentage of severe patients in the SL group (64.70%) is higher than the SM group (44.88%), while it has opposite effect by considering the cumulated normal and mild subjects (14.12% for SL v.s. 34.81% for SM). On the other hand, the percentages of moderate patients are very close between two groups (21.18% v.s. 20.32%).
As depicted in Table 6, unpaired t-test was used to further compare salient variables of two groups. Among them, no significant difference (p>0.05) was found for anthropometric data, i.e. BMI and NC, ESS, and HR, while significant difference was found for age, ODI, and AHI. It indicates that aged subjects are liable to have insomnia and have more severe OSA with higher ODI and AHI.
Table 6. Statistic analysis using unpaired t-test to test salient variables
Sleeping Time Age BMI NC ESS HR ODI AHI
<4 hr (n=90) Mean 52.02 27.19 39.72 9.55 33.00 74.23 44.95 STD 14.45 4.26 3.82 5.45 26.09 12.31 27.55 ≧ ≧ ≧ ≧4 hr (n=561) Mean 44.06 26.90 39.07 9.23 24.19 73.23 33.13 STD 12.00 7.11 3.62 5.19 26.40 10.69 28.19 p value .0001 .7144 .1269 .5987 .4311 .0042 .0003
17
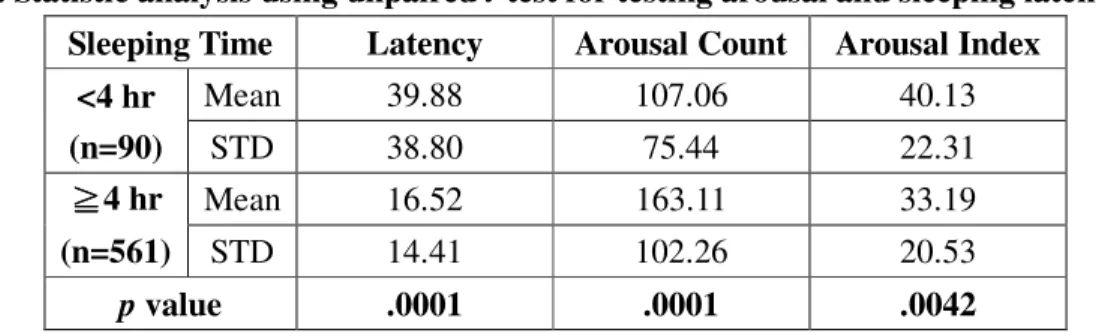
There are two possible explanations of this finding: (1) some severe patients tend to sleep less because of early apnea or hypopnea occurrence and (2) data recorded from subjects who do not have enough sleeping time are not reliable for further analysis. Regarding the first possibility, the early occurrence of apnea or hypopnea after having fallen asleep induces insomnia for severe patients. The environmental change might also be the reason for causing insomnia. By observing the latency time in Table 7, significant difference (p<0.0001) can be found between two groups. Subjects with less sleeping time demonstrate greater latency. Although arousal counts for SL group is significantly smaller than the SH group (p<0.0001), the arousal index (arousal counts per hour), however, is significantly greater (p<0.0042). We suggest that subjects who were diagnosed as normal but didn’t take enough sleeping time in the sleeping center might be caused by environmental change and should have another PSG test. By using oximeter to test OSA at home might be able to eliminate such variation.
Table 7. Statistic analysis using unpaired t-test for testing arousal and sleeping latency
Sleeping Time Latency Arousal Count Arousal Index
<4 hr (n=90) Mean 39.88 107.06 40.13 STD 38.80 75.44 22.31 ≧ ≧≧ ≧4 hr (n=561) Mean 16.52 163.11 33.19 STD 14.41 102.26 20.53 p value .0001 .0001 .0042
With regard to the second possibility, the data collected from the 90 subjects who had sleeping time less than 4 hours were removed and resulted in a total of 561 subjects for further analysis. The percentage of patients without enough sleeping time accounts to 13.82%. To compare the accuracy in detecting 4 different groups in Table 2, great changes can be observed with regard to normal (65.41% vs 73.71%) and mild (59.10% vs 67.14%) groups, while only small variation for moderate (41.82% vs 41.93%) and severe (88.25% vs 86.46%) groups. However, as indicated in Tables 3 and 4, no significant influence is found for detecting severe groups and combined moderate and severe group. The effect of patients whose sleeping time less than 4 hours needs to be further investigated.
Unlike PSG and single-lead ECG (Thomas et al. 2005), the limitation of oximetry measurement is that it cannot score sleep quality. Standard PSG scores sleep quality based on EEG signal analysis by grading the sleep quality into 4 stages of continuum of depth during non-REM sleep. Thomas et al. (2005) suggested that sleep could be identified as wake/REM, cyclic alternating pattern (CAP), and non-CAP based on the Fourier analysis of R-R interval series and its associated ECG-derived respiration (EDR) signal. However, the main advantage of using oximetry as predictive parameter is its great sensitivity in detecting severe OSA patients
18 with cheaper price compared to PSG.
4.3 Study Limitation
Among the 651 subjects studied, only 75 were verified as normal which accounts for only 11.52% of the total subjects. This is quite normal since the subjects suspected to have OSA were recruited from the outpatients. Another limitation is that all events found in PSG were verified by technicians work in the sleep center. The variation occurred among different technicians cannot be avoided and negleted since each one has his/her subjective judgment. Therefore, design of an objective computer-assisted system is needed for eliminating the loads and subjective opinions of individual technicians.
As discussed in Section 4.2, analyzed results for subjects whose sleeping time less than 4 hours are significantly different form the results obtained from subjects with more sleeping time. In this study, the data collected for subjects with less sleeping time are included, which might affect the results of this study. However, some data obtained from subjects without enough sleeping time seem to have diagnostic value, especially for those with severe OSA. Further investigation on normal or less severe patients is needed for determining if these subjects should take more tests.
5. Conclusion and Future Works
In addition to ODI, other variable such as heart rate variability (HRV) for quantizing sympathetic tone was also suggested as a useful parameter in the evaluation of OSA. Future work will test this parameter to verify if it is a valuable parameter. It will be accompanied with ODI for constructing a predictive model for OSA diagnosis if it has been verified as an effective parameter.
In previous section, we have demonstrated that the variables, such as age, ODI, and AHI, obtained from subjects without enough sleeping time is significantly different from those whose sleeping time is more than 4 hours. The former group tends to be more severe than the latter group. More PSG tests are needed to confirm if the test with sleeping less than 4 hours is valid for OSA diagnosis.
Based on the cost-benefit analysis, we suggest that home-styled oximetry alone can be used for sifting severe patients which will be followed by PSG to discriminate normal, mild, and moderate subjects with a total cost down of 35.72%. More large scale experiment and rigorous analysis are needed to see the proportion of normal subjects will be incorrectly diagnosed as severe.
19
References
Al-Delaimy, W.K., Manson, J.E., Willette, W.C., Stampfer, M.J., Hu, F.B. Snoring as a risk factor for type II diabetes mellitus: a prospective study. Am J Epidemiol 2002;155:387-393.
Arias, M.A., Garcia-Rio, F., Alonso-Fernandez, A., Mediano, I., Martinez, O., Villamor, J. Obstructive sleep apnea syndrome affects left ventricular diastolic function: effect of nasal continuous positive airway pressure in men. Circulation 2005;112:375-383.
Atwood, C.W., McCroy, D., Garcia, J.G.N., Abman, S.H., Aheam, G.S. Pulmonary artery hypertension and sleep-disordered breathing: ACCP evidence-based clinical practice guidelines. Chest 2004;126:72-77.
Baltzan, M.A., Verschelden, P., Al-Jahdali, H., et al. Accuracy of oximetry with thermistor (OxiFlow) for diagnosis of obstructive sleep apnea and hypopnea. Sleep 2000;23:61–69. Barnes, M., Houston, D., Worsnop, C.J., et al. A randomized controlled trial of continuous
positive airway pressure in mild obstructive sleep apnea. Am J Respir Crit Med 2002; 165: 773-780.
Basner, R.C. Continuous positive airway pressure for obstructive sleep apnea. N Engl J Med 2007;356:1751-1758.
Bloch, K.E. Alternatives to CPAP in the treatment of the obstructive sleep apnoea syndrome. Swiss Med Wkly 2006;136:261-267.
Bradley, T.D., Floras, J.S. Sleep apnea and heart failure: Part I: obstructive sleep apnea. Circulation 2003;107:1671-1678.
Brouillette, R.T., Morielli, A., Leimanis, A., Waters, K.A., Luciano, R., Ducharme, F.M. Nocturnal pulse oximetry as an abbreviated testing modality for pediatric obstructive sleep apnea. Pediatrics 2000;105:405-412.
Brown, M. P. S., Grundy, W. N., Lin, D., Cristianini, N., Sugnet, C., Furey, T. S., Ares, J. M., et al. (2000). Knowledge-based analysis of microarray gene expression data using support vector machines. PNAS, 97(1), 262–267.
Caples, S.M., Gami, A.S., Somers, V.K. Obstructive sleep apnea. Ann Intern Med 2005;142:187-197.
Castronovo, V., Zucconi, M., Nosetti, L., et al. Prevalence of habitual snoring and sleep disordered breathing in pre-school-aged children in an Italian community. J Pediatr 2003;142: 377-382.
Chervin, R.D., Aldrich., M.S. The Epworth Sleepiness Scale may not reflect objective measurements of sleepiness or sleep apnea. Neurology 1999;52:125–131.
Chesson, A.L., Berry, R.B., Pack, A. Practice parameters for the use of portable monitoring devices in the investigation of suspected obstructive sleep apnea in adults. Sleep 2003;26:907-913.
Choi, S., Bennett, L.S., Mullins, R., et al. Which derivative from overnight oximetry best predicts symptomatic response to nasal continuous positive airway pressure in patients with obstructive sleep apnea? Respir Med 2000;94:895-899.
20
Bodywork and Movement Therapies 2006; 10: 134-146.
Cristianini, N., Shawe-Taylor, J. An Introduction to Support Vector Machines and Other Kernel-Based Methods. Cambridge University Press, Cambridge UK (2000).
De La Eva, R.C.,. Baur, L.A., Donaghue, K.C., Waters, K.A. Metabolic correlates with obstructive sleep apnea in obese subjects. J Pediatr 2002;140:654-659.
DeCoste, D., & Schuolkopf, B. (2002). Training invariant support vector machines. . Machine
Learning, 46, 161-190.
Devouassoux, G., Levy, P., Rossini, E., Pin, I., Fior-Gozlan, M., Henry, M., Seigneurin, D., Pepin, J-L. Sleep apnea is associated with bronchial imflammation and continuous positive airway pressure-induced airway hyperresponsiveness, J Allergy Clin Immunol 2007; 119: 597-603. Dixon, J.B. , Schachter, L.M., O’Brien., P.E. Predicting sleep apnea and excessive day sleepness
in the severely obese: Indicators for polysomnography. Chest 2003; 123:1134-1141.
El Solh, A.A., Aldik, Z., Alnabhan, M., Grant, B. Predicting effective continuous positive airway pressure in sleep apnea using an artificial neural network. Sleep Med 2007;8:471-477. Eom, J. H., Kim, S. C., & Zhang, B. T. (2008). AptaCDSS-E: A classifier ensemble-based clinical
decision support system for cardiovascular disease level prediction. Expert Systems with
Applications, 34(4), 2465-2479.
Fleisher, K.E., Krieger., A.C. Current trends in the treatment of obstructive sleep apnea. J Oral Maxillofac Surg 2007;65:2056-2068.
Flemons, W.W., Littner, M. R. , Rowley, J. A., Gay, P. , Anderson, W. M. , Hudgel, D.W., McEvoy, R. D., and Loube, D. I., Home diagnosis of sleep apnea: A systematic review of the literature, Chest 2003; 124:1543-1579.
Flemons, W.W., Douglas, N.J., Kuna, S.T., Rodenstein, D.O., Wheatley, J. Access to diagnosis and treatment of patients with suspected sleep apnea. Am J Respir Crit Care Med 2004;169:668-672.
Flemons, W.W. Obstructive sleep apnea. N Engl J Med 2002;347:498-504.
Flint, J., Kothare, S.V., Zihlif, M., Suarez, E., Adams, R., Legido, A., De Luca., F. Association between inadequate sleep and insulin resistance in obese children. J Pediatr 2007;150:364-369.
Freire, A.O., Sugai, G.C., Chrispin, F.S. , Togeiro, S.M. , Yamamura, Y., Mello, L.E. , Tufik., S. Treatment of moderate obstructive sleep apnea syndrome withacupuncture: A randomised, placebo-controlled pilot trial. Sleep Med 2007;8:43-50.
Gami, A.S., Pressman, G., Caples, S.M., Kanagala, R., Gard, J.J., Davison, D.E. Association of atrial fibrillation and obstructive sleep apnea. Circulation 2004;110:364-367.
Gami, A.S., Howard, D.E., Olson, E.J., Somers, V.K. Day-night pattern of sudden death in obstructive sleep apnea. N Engl J Med 2005;352:1206-1214.
Gjorup, P.H., Sadauskiene, L. J., Wessels, O. Nyvad, B. Strunge, E.B. Pedersen. Abnormally increased endothelin-1 in plasma during the night in obstructive sleep apnea: relation to blood pressure and severity of disease. Am J Hypertension 2007; 20:44-52.
Goncalves, M.A., Paiva, T., Ramos, E. and Guilleminault, C. Obstructive Sleep Apnea Syndrome, Sleepiness, and Quality of Life, Chest 2004;125:2091-2096.
21
Gosselin, N., Mathieu, A., Mazza, S., Petit, D., Malo, J., Montplaisir, J. Attentional deficits in patients with obstructive sleep apnea syndrome: An event-related potential study, Clinical Neurophysiology 2006; 117:2228–2235.
Grebe, M., Eisele, H.J., Weissmann, N., Schaefer, C., Tillmanna, H., Seeger, W., et al. Antioxidant vitamin C improves endothelial function in obstructive sleep apnea. Am J. Respir Crit Care Med 2006; 173:897-901.
Guilleminault, C., Lee, J.H., Chan, A. Pediatric obstructive sleep apnean syndrome. Arch Pediatr Adolesc Med 2005; 159: 775-785.
Hartenbaum, N., Collop, N., Rosen, I.M., Phillips, B., George, C.F. P., et al. Sleep Apnea and Commercial Motor Vehicle Operators: Statement from the joint task force of the American College of Chest Physicians, American College of Occupational and Environmental Medicine, and the National Sleep Foundation, JOEM 2006; 48: S4-S37.
Hunsaker, H., Riffenburgh, R.H. Snoring significance in patients undergoing home sleep studies, Otolary Head Neck Surg 2006; 134:756-760.
Huupponen, E., Saastamoinen, A., Eskelinen, V. Apnea patients show a frontopolar inter-hemispheric spindle frequency difference. Neuros Letter 2006;403:186-189.
Jankel, W.R., Niedermeyer, E. Sleep spindles. J Clin Neurophysiol 1985; 2:1-35.
Johns, M.W. A new method for measuring daytime sleepiness: the Epworth sleepiness scale. Sleep 1991; 14: 540-545.
Juan-Carlos, V., Willis, H.T., Flemons, W.W., et al. Automated analysis of digital oximetry in the diagnosis of obstructive sleep apnea. Thorax 2000;55:302-307.
Kao, Y.H., Shnayder, Y. K., Lee. The efficacy of anatomically based multilevel surgery for obstructive sleep apnea. Otolaryngol Head Neck Surg 2003;129:327-335.
Khoo, S.M., Tan, W.C., Ng, T.P., Ho, C.H. Risk factors associated with habitual snoring and sleep-disordered breathing in a multi-ethnic Asian population: a population-based study. Resp Med 2004;98: 557-566.
Kirby, S.D., Danter, W., George, C.F.P., Francovic, T., Ruby, R.R.F., Ferguson, K.A. Neural network prediction of obstructive sleep apnea from clinical criteria. Chest 1999; 116:409-415.
Kirk, V.G., Bohn, S.G., Flemons, W.W., Remmers, J.E. Comparison of home oximetry monitoring with laboratory polysomnography in children. Chest 2003; 124:1702-1708.
Lam, J.C.M., Lam, B., Lam, C.L., Fong, D., Wang, J.K.L., Tse, H.F., Lam, K.S.L., Ip, M.S.M. Obstructive sleep apnea and the metabolic syndrome in community-based Chinese adults in Hong Kong, Respiratory Medicine 2006; 100: 980-987.
Lavie-Nevo, K. and Pillar, G.. Evening-morning differences in blood pressure in sleep apnea syndrome: effect of gender. Am J Hypertension 2006;19:1064-1069.
Lewis, C.A., Eaton, T.E., Fergusson, W., Whyte, K.F., Garrett, J.E., Kolbe, J. Home overnight pulse oximetry in patients with COPD: More than one recording may be needed. Chest 2003; 123:1127-1133.
Lin, C.C., Hsieh, W.Y., Chou, C.S., Liaw, S.F.. Cardiopulmonary exercise testing in obstructive sleep apnea syndrome, Respiratory Physiology & Neurobiology 2006; 150: 27-34.
22
Lin, C.L., Yeh, C., Yen, C.W., Hsu, W.H. and Hang, L.W. Comparison of the Indices of Oxyhemoglobin Saturation by Pulse Oximetry in Obstructive Sleep Apnea Hypopnea Syndrome. Chest 2009; 135(1):86-93.
Lindman, R., Stal, P.S. Abnormal palatopharyngeal muscle morphology in sleep-disordered breathing. J Neurol Sci. 2002;195:11–23.
Lu, L.R., Peat, J.K. Sullivan, C.E. Snoring in preschool children: prevalence and association with nocturnal cough and asthma. Chest 2003;124:587-593.
Lecun, Y., Jackel, L., Bottou, L., Brunot, A., Cortes, C., Denker, J., et al. (1995). Comparison of
learning algorithms for handwritten digit recognition. Paper presented at the International Conference on Artificial Neural Networks.
Luthje, L. and Andreas, S. Obstructive sleep apnea and coronary artery disease. Sleep Med Rev 2008; 12:19-31
Masa, J.F., Jimenez, A., Duran, J., et al. Alternative methods of titrating continuous positive airway pressure: A large multicenter study. Am J Resp Crit Care Med 2004;170:1218-1224. Monasterio, C. Vidal, S. Duran, J., et al. Effectiveness of continuous positive airway pressure in
mild sleep apnea-hypopnea syndrome. Am J Respir Crit Med 2001;164:939-943.
Montplaisir, J., Bedard, M.A., Richer, F., Rouleau , I. Neurobehavioral manifestations in obstructive sleep apnea syndrome before and after treatment with continuous positive airway pressure. Sleep 1992; 15: 517-519.
Mortimore, I. Douglas, N. Palatal muscle EMG response to negative pressure in awake sleep apneic and control subjects. Am J Respir Crit Care Med 1997;156:867-873.
Mulgrew, A.T., Fox, N., Ayas, N.T., Ryan, C.F. Diagnosis and initial management of obstructive sleep apnea without polysomnography-A randomized validation study. Ann Intern Med 2007;146:157-166.
Netzer, N., Eliasson, A.H., Netzer, C., Krisco, D.A. Overnight Pulse Oximetry for Sleep-Disordered Breathing in Adults-A Review. Chest 2001; 120:625-633.
Nieto, F.J., Herrington, D.M., Redline, S., Benjamin, E.J., Robbins, J.A. Sleep apnea and markers of vascular endothelial function in a large community sample of older adults. Am J. Respir Crit Care Med 2004;169:354-360.
Nuber, R., Varvrina, J., Karrer, W. Predictive value of nocturnal pulse oximetry in sleep apnea screening. Schweiz Med Wochenschr Suppl 2000;116:120S–122S.
Orth, M., Kotterba, S., Walther, J.W., Rasche, K., Schultze-Weringhaus, G., Duchna, H.W. Lomg-term compliance of CPAP therapy-update, predictor and interventions. Pneumologie 2006;60:480-484.
Pang, K.P., Terris, D.J., Podolsky, R. Severity of obstructive sleep apnea: Correlation with clinical examination and patient perception. Otolaryngology-Heah and Neck Surgery 2006;135:555-560.
Pang, K.P., Terris, D.J., Podolsky. R., Screening for obstructive sleep apnea: an evidence-based analysis. Am J Otolaryngology 2006;27:112-118.
23
treating sleepiness in a diverse population with obstructive sleep apnea 2003;163:565-571. Peppard, P.E., Young, T., Palta, M. et al. Prospective study of the association between
sleep-disordered breathing and hypertension. N Engl J Med 2000;342:1378-1384.
Phillips, B.G., Narkiewicz, K., Pesek, C.A., Haynes, W.G., Dyken, M.E., Somers, V.K. Effects of obstructive sleep apnea on endothelin-1 and blood pressure. J Hypertens 1999;17:61-66. Polat, K., & Gunes, S. (2007). Breast cancer diagnosis using least square support vector machine.
Digital Signal Processing, 17(4), 694-701.
Rosen, C., Larkin, E., Kirchner, H. et al. Prevalence and risk factors for aleep-disordered breathing in 8-11-year-old children: association with race and prematurity. J Pediatr 2003;142: 383-389.
Russo, M.B. Normal Sleep, Sleep Physiology, and Sleep Deprivation: General Principles. Retrieved from http://www.emedicine.com/neuro/topic444.htm 2005. Last Updated: April 6, 2005
Sangal, R.B., Sangal, J.M., Thorp, K. Atomoxetine improves sleepiness and global severity of illness but not the respiratory disturbance index in mild to moderate obstructive sleep apnea with sleepiness. Sleep Med 2008; 9:506-510
Schellenberg, J.B., Maislin, G., Schwab, R.J. Physical findings and the risk for obstructive sleep apnea: the importance of oropharyngeal structure. Am J Respir Crit Care Med 2000;162:740-748.
Schultz, R., Eisele, H.J., Weissmann, N., Seeger. W. Pulmonary hypertension and sleep-related breathing disorders. Pneumologie 2005;59:270-274.
Schulz, R., The vascular micromilieu in obstructive sleep apnea. Eur Respir J 2005;25:780-782. Schulz, R., Schmidt, D., Blum, A., Lopes-Ribeiro, X., Lucke, C., Mayer, K. et al. Decreased
plasma levels of nitride oxide derivatives in obstructive sleep apnoea: response to CPAP therapy. Thorax 2000;55:1046-1051.
Schwab, R., Pack, A., Gupta, K. et al. Upper airway and soft tissue structure changes induced by CPAP in normal subjects. Am J Respir Crit Care Med 1996;154:1106-1116.
Schwab, R., Pasirstein, M., Pierson, R. et al. Identification of upper airway anatomical risk factors for obstructive sleep apnea with volumetric magnetic resonance imaging. Am J Respir Crit Care Med 2003; 168:522-530.
Series, F., Mare, I. Nasal pressure recording in the diagnosis of sleep apnea- hypopnea syndrome. Thorax 1999; 54:506–510.
Shahar, E., Whitney, C.W., Redline, S. et al. Sleep-disordered breathing and cardiovascular disease: cross-sectional results of he sleep heart study. Am J Respir Crit Care Med 2001;163:19-25.
Shin, C., Joo, S., Kim, J., Kim, T. Prevalence and correlates of habitual snoring in high school students. Chest 2003;124:1709-1715.
Shinji, T., Takeshi, M., Yoshinosuke, F. Clinical significance of nocturnal oximeter monitoring for detection of sleep apnea syndrome in the elderly. Sleep Med 2002;3:67-71.
Shinohara, E., Kihara, S., Yamashita, S., Nishida, M., Arai, T. et al. Viseral fat accumulation as an important risk factor for obstructive sleep apnea syndrome in obese subjects, J Intern Med
24 1997;241:11-18.
Shivalkar, B., Van De Heyning, C., Kerremans, M., Rinkevich, D., Verbraecken, J., De Backer, W., Vrints. C. Obstructive sleep apnea syndrome-more insights on structural and functional cardiac aletrations, and the effects of treament with continuous positive airway pressure. J Am Coll Cardiol 2006;47:1433-1439.
Steriade. M., Basic mechanisms of sleep generation. Neurology 1992;42:9-18.
Taman, R. and Gozal, D. Obesity and obstructive sleep apnea in children. Pediatr Respir Review 2006;7:247-259.
Taman, R., Gulliver, T.E., Krishna, J., Montgomery-Downs, H.E., O’Brien, L.M., A. Ivanenko, D. Gozal. Persistence of obstructive sleep apnea syndrome in children after adenotonsillectomy. J Pediatr 2006;149:803-808.
Teloken, P.E., Smith, E. B., Lodowsky, C., Freedom, T., and Mulhall, J. P. Defining association between sleep apnea syndrome and erectile dysfunction, Urology 2006; 67: 1033-1037. Theodoridis, S., Koutroumbas, K. Pattern Recognition. 2nd edn. Academic Press, San Dieago
(2003).
Thomas, R.J., Mietus, J.E., Peng, C.K. A.L. Goldberger. An electrocardiogram-based technique to assess cardiopulmonary coupling during sleep, Sleep 2005; 28: 1151-1161.
Tong, J., Jiang, P., & Lu, Z. (2008). RISP: A web-based server for prediction of RNA-binding sites in proteins. Computer Methods and Programs in Biomedicine, 90(2), 148-153.
Vagiakis, E., Kapsimalis, F., Lagogianni, I., Perraki, H., Minaritzoglou, A., Alexandropoulou, K., Roussos, C. Kryger, M. Gender differences on ploysomnographic findings in Greek subjects with obstructive sleep apnea syndrome. Sleep Med 2006;7:424-430.
Whitelaw, W.A., Brant, R.F., Flemons. W.W. Clinical usefuleness of home oximetry compared with polysomnography for assessment of sleep apnea. Am J Respir Crit Care Med 2005;171:188-193.
Yaggi, H.K., Concato, J., Kernan, W.N., Lichtman, J.H., Brass, L.M., Mohsenin, V. Obstructive sleep apnea as a risk factor for stroke and death. N Engl J Med 2005;353:2034-2041.
Young, T., Palta, M., Dempsey, J. et al. The occurrence of SDB among middle-aged adults. N Engl J Med 1993; 328: 1230-1235.
Young, T., Even, L., Finn, L. et al. Estimation of the clinically diagnosed proportion of sleep apnea syndrome in middle aged men and women. Sleep 1997; 20: 705-706.
Zhang, J., Wang, Y., Dong, Y., & Wang, Y. (2008). Computer-aided diagnosis of cervical lymph nodes on ultrasonography. Computers in Biology and Medicine, 38(2), 234-243.
Zhi, L., Zhang, D., Yan, J., Li, Q., & Tang, Q. (2007). Classification of hyperspectral medical tongue images for tongue diagnosis. Computerized Medical Imaging and Graphics, 31(8), 672-678.