Identification of over-expressed proteins in oral squamous cell carcinoma
(OSCC) patients by clinical proteomic analysis
Wan-Yu Lo
a, Ming-Hsui Tsai
b, Yuhsin Tsai
c, Chun-Hung Hua
b, Fuu-Jen Tsai
a,
Shiuan-Yi Huang
a, Chang-Hai Tsai
d, Chien-Chen Lai
a,e,⁎
aDepartment of Medical Research, China Medical University Hospital, Taichung, Taiwan bDepartment of Otorhinolaryngology, China Medical University Hospital, Taichung, Taiwan cGraduate Institute of Chinese Medical Science, China Medical University, Taichung, Taiwan
dDepartment of Biotechnology and Bioinformatics, Asia University, Taichung, Taiwan e
Institute of Molecular Biology, National Chung Hsing University, Taichung, Taiwan Received 18 May 2006; received in revised form 12 June 2006; accepted 26 June 2006
Available online 30 June 2006
Abstract
Background: Oral cancer is a worldwide problem. It is a universal aggressive disease in the population of smoking and drinking. The oral cancer mortality has been ranked 5th place in Taiwan in male cancer patients. A number of protein markers for oral cancer are still not applicable in large populations. Proteomic technologies provide excellent tools for rapid screening of a large number of potential biomarkers in malignant cells. Method: Proteomics and real-time quantitative RT-PCR were used to analyze over-expressed proteins in 10 OSCC patients.
Result: Forty-one proteins were identified as commonly over-expressed in OSCC tissues. In OSCC tissues,αB-crystallin, tropomyosin 2, myosin light chain 1, heat shock protein 27 (HSP27), stratifin, thioredoxin-dependent peroxide reductase, flavin reductase, vimentin, rho GDP-dissociation inhibitor 2 (rho GDI-2), glutathione S-transferase Pi (GST-pi) and superoxide dismutase [Mn] (MnSOD) were significantly over-expressed (an average of 7.2, 6.0, 5.7, 4.3, 3.6, 3.4, 3.0, 3.0, 2.6, 2.5, 2.1-fold, respectively). In real-time quantitative RT-PCR analysis, the gene expressions ofαB-crystallin, HSP27 and MnSOD were also increased in the cancer tissues, consistent with proteomic results.
Conclusion: The identified proteins in this experiment may be used in future studies of carcinogenesis or as diagnostic markers and therapeutic targets for OSCC.
© 2006 Elsevier B.V. All rights reserved.
Keywords: Oral squamous cell carcinoma (OSCC); Oral cancer; Proteomics; LC-MS/MS; Real-time quantitative RT-PCR
1. Introduction
Oral cancer is one of the most common types of human cancer in the world [1]. Among them, oral squamous cell carcinoma (OSCC) occurs with the highest frequency. Never-theless, factors deciding on its clinical characteristics including carcinogenesis, development, progression, invasion, and me-tastasis have not been elucidated yet. This cancer is a highly
variable disease with multiple heterogeneous genetic and epigenetic changes associated with various types of clinical behavior. Globally about 500,000 new oral and pharyngeal cancers are diagnosed annually, and three quarters of these are from the developing world [2]. In Taiwan, the incidence of OSCC is one of the highest in the world, 20 per 1,000,000 among men, and comprising approximately 4–5% of all malignancies[3].
The mortality rate of oral cancer increased about 5.83-fold from 1981 to 2003 in Taiwan, making its prevention and early detection and treatment an important public health issue [4]. Generally, both smoking and drinking are the important risk factors for cancer of the oral cavity, oropharynx, hypopharynx, and larynx. Other risk factors for oral cancer include: human papillomavirus (HPV) infection, Epstein-Barr virus infection,
⁎ Corresponding author. Department of Medical Research, China Medical University Hospital, Taichung, Taiwan. Tel.: +886 4 22062121x7083; fax: +886 4 22033295.
E-mail address:lailai@www.cmuh.org.tw(C.-C. Lai).
0009-8981/$ - see front matter © 2006 Elsevier B.V. All rights reserved. doi:10.1016/j.cca.2006.06.030
occupational exposure to wood dust and consumption of certain preservatives or salted foods [5,6]. It is different from other regions; chewing areca quid is the most important risk factor to induce oral cancer in Taiwan. Approximately 85% of all patients with OSCC habitually use betel quid [7].Following previous reports, the 5-year survival rates for mouth, tongue, oropharynx, and laryngopharyngeal caners seldom exceed 40%. Therefore, the existence of a reliable, accurate, cost-effective, and noninvasive test for OSCC is desirable[8].
The alteration of genes has been traditionally revealed by the use of cytogenetics, immunohistochemistry, or molecular ap-proaches based on one or a few genes that changed the expres-sion of many genes such as oncogenes and tumor suppressor genes which have been associated with oral carcinogenesis[9–
11]. But the molecular signals triggering the onset of oral carcinogenesis are still unknown. Genomics has been incorpo-rated in oncology research and now, in the postgenomic era, there is a strong drive to incorporate proteomic technologies as well [12,13]. Proteomics is a promising approach in the iden-tification of proteins with changed levels which may be useful as diagnostic markers for the early detection of cancer[14,8]. Proteomics have been successfully employed in studies of lung
[15], breast [16], prostate [17], gastrointestinal cancer [18], tongue squamous cell carcinoma (SCC)[19]and head and neck squamous cell carcinoma (HNSCC)[20].
In this study, we combined the proteomics and real-time quantitative RT-PCR to approach the characterization of sig-nificantly over-expressed proteins from OSCC patients. We designed a rapid and convenient system to hunt all possible diagnostic markers from OSCC patients in a short term. We globally surveyed differential gene expression using matched normal and tumor tissues from patients with OSCC to identify genes that may predispose to the cancer.
2. Materials and methods 2.1. Patients and tissues
The pairs of surgical archived specimens of primary OSCC and their matched adjacent normal surrounding mucosa speci-mens from 10 patients were obtained from the China Medical University Hospital (Taichung, Taiwan). The patients were between 40 and 60 years old. Patient information about sex, age, and histories of cigarette smoking, betel quid chewing, and medical illness was obtained from medical charts or by telephone inquiry. The American Joint Committee on Cancer pathologic stage of ten patients was T3 (9 N0, 1 N2). The stage of the cancer was defined by the extent of the lesion and was determined by physical examination, radiological studies, and pathological examination. The histology for all patients was confirmed by 2 independent histopathologist following fixation, embedding, sectioning and H&E staining. Overall, the tumor specimens all containedN90% tumor cells. No tumor cells were detected in the surrounding mucosal tissue. Tissues were kept at −80 °C and the freezing chain was not interrupted until analysis. The study was approved by the ethical committee of the China Medical University Hospital.
2.2. Protein extractions
For two-dimensional gel electrophoresis, to remove blood by PBS, all tissues were minced into pieces of about 1–2 mm3
and then homogenized with 0.5 ml lysis buffer (8 mol/l urea, 4% CHAPS), containing protease inhibitor cocktail (Sigma, St. Louis, MO), by a homogenizer (MagNA Lyser, Roche) for 60 s at 6500 rpm. The lysates were centrifuged at 8000 rpm for 20 min at 4 °C and supernatants were collected for acetone precipitation for protein purification. The protein pellet was denatured with sample buffer (8 mol/l urea, 4% CHAPS, 65 mmol/l DTE, 0.5% ampholytes). The denatured proteins were incubated at 4 °C 2–3 h before centrifugation at 13,000 rpm for 15 min. The protein concentrations of the resulting supernatants were measured using the Bio-Rad Protein Assay (Bio-Rad, Hercules, CA) according to the NenoDrop instruction.
2.3. Two-dimensional gel electrophoresis
We took 200 μg protein extraction per sample for 2D gel separation. The extracted sample was diluted to 350 μl with rehydration buffer consisted of an 8 mol/l urea, 4% CHAPS, 65 mmol/l DTE, 0.5% ampholytes, and a trace of bromophenol blue. Then, the rehydration solution (containing the sample) was applied into 17 cm immobilized pH gradient pH 3–10 IPG strip (ReadyStrip IPG strip, Bio-Rad) overnight. Electrophoresis in the first dimension was focused for a total of 60 kV h (Protean IEF cell, Bio-Rad) at 20 °C and then stored at−20 °C until SDS-PAGE. Before SDS-PAGE, IPG strips were equilibrated with 3 ml of an equilibrium solution containing 50 mmol/l Tris–HCl (pH 8.8), 6 mol/l urea, 30% glycerol, 2% SDS, a trace of bromophenol blue, and DTE (1% w/v) for 20 min, and followed with second equi-libration for 20 min in the same equilibrium solution containing iodoacetamide (2.5% w/v) instead of DTE. Finally, the strip was transferred to the top of 12% polyacrylamide gels and held in position with molten 0.5% agarose in running buffer containing 25 mmol/l Tris, 0.192 mol/l glycine and 0.1% SDS. Gels were run at 16 mA/gel for 30 min followed by 50 mA/gel for 4–5 h. 2.4. Detection of protein spots and data analysis
Gels were routinely stained with silver nitrate and then scanned by GS-800 imaging Densitometer with PDQuest software ver. 7.1.1 (Bio-Rad). Protein spots were quantified using the PDQuest software. To compare the tumor and normal samples from 10 patients, we screened the over-expressed proteins (N2-fold) in tumor samples for the advance analysis. Comparisons were made between gel images of individual tumor and normal samples by PDQuest software. Normalized volume differences were statis-tically calculated for all ten cases. Consistently and significantly over-expressed spots (N2-fold) were averaged in each protein and selected for analysis with nanoLC-MS/MS.
2.5. Enzyme digestion
The in-gel digestion method was a modification of Gharahda-ghi et al.'s[21]and Terry et al.'s[22]. Each protein spot (1–2 mm
diameter) of interest was cut out with a pipette tip and transferred into a microcentrifuge tube (0.6 ml). The gel pieces were washed twice with 50 μl of 50% acetonitrile (ACN):50% 200 mmol/ l ammonium bicarbonate for 5 min, shrank with 100% acetonitrile until the gels turned white, then dried for 5 min in a speed vacuum at room temperature. The gel pieces were rehydrated in 15μl of 50 mmol/l ammonium bicarbonate (37 °C, 4 min), and an equi-valent volume (15μl) of trypsin solution (20 ng/μl in 50 mmol/ l ammonium bicarbonate; Promega, Madison, WI) was added, then it was incubated at 37 °C for 4 h or 30 °C for at least 16 h. After digestion, vortex and spin down of the gel pieces, the supernatant was the peptide solution and was stored at−20 °C until mass analysis.
2.6. Nanoelectrospray mass spectrometry
Nanoscale capillary LC-MS/MS was used to analyze the meaningful proteins involved in the reaction. LC-MS/MS anal-ysis was performed using an Ultimate capillary LC system (LC Packings, Amsterdam, The Netherlands) coupled to a QSTARXL quadrupole-time of flight (Q-TOF) mass spectrom-eter (Applied Biosystem/MDS Sciex, Foster City, CA). The nanoscale capillary LC separation was performed on an RP C18 column (15 cm × 75 m i.d.) with a flow rate of 200 nl/min and a 60 min linear gradient of 5–50% buffer B. Buffer A contained 0.1% formic acid in 5% aqueous ACN; buffer B contained 0.1% formic acid in 95% aqueous ACN. The nanoLC tip used for on-line LC-MS was a PicoTip (FS360-20-10-D-20; New Objec-tive, Cambridge, MA). Data acquisitions were performed by Automatic Information Dependent Acquisition (IDA; Applied Biosystem/MDS Sciex). The IDA automatically finds the most intense ions in a TOF MS spectrum, and then performs an optimized MS/MS analysis on the selected ions. The product ion spectra generated by nanoLC-MS/MS were searched against NCBI databases for exact matches using the ProID program (Applied Biosystem/MDS Sciex) and the MASCOT search program (http://www.matrixscience.com)[23]. A homo sapiens taxonomy restriction was used and the mass tolerance of both precursor ion and fragment ions was set to ± 0.3 Da. Carbamidomethyl cysteine was set as a fixed modification, while serine, threonine, tyrosine phosphorylation and other modifica-tions were set as variable modificamodifica-tions. All phosphopeptides identified were confirmed by manual interpretation of the spectra. 2.7. Validation of proteomic data by real-time quantitative RT-PCR To define the relative expression of the genes, the PCR product from each tumor sample was compared with the grossly normal tissue from the same patient. A comparison real-time quantitative RT-PCR method was used to assay the relative expression of the genes in the normal and tumor tissues as described previously[24]. Total RNA was extracted using the TRIzol reagent (Invitrogen, Carlsbad, CA) according to the manufacturer's instructions. All PCR reactions were performed using the real-time fluorescence detection method using the LightCycler System (Roche Diagnostics, Mannheim, Germany) with a FirstStart DNA Master SYBR Green I kit (Roche
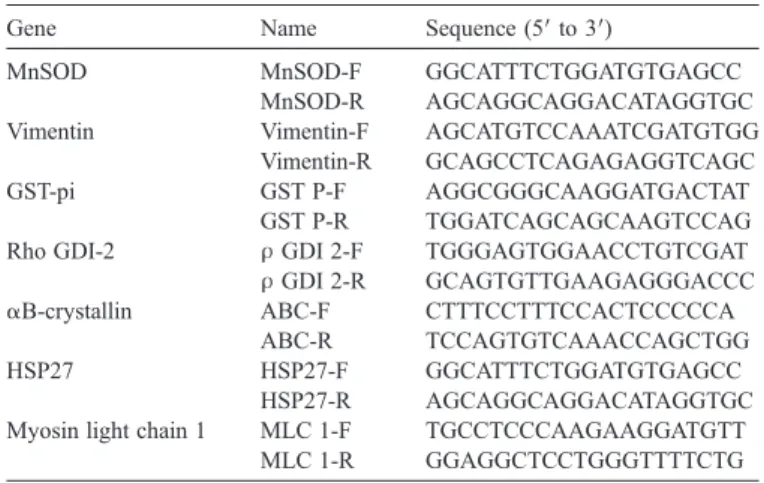
Molecular Biochemicals, Indianapolis, IN). The LightCycler System was used for quantitative assessment of gene expres-sion. The primers used for real-time quantitative RT-PCR are listed inTable 1. A reaction mixture containing the following components at the indicated end-concentration was prepared according to the manufacturer's instructions: 9.4μl water, 1.6 μl MgCl2(2.5 mmol/l), 1μl of forward primer (20 pmol), 1 μl of
reverse primer (20 pmol), and 2 μl FastStart DNA Master SYBR Green I mix. Fifteen microliters of the reaction mixture was distributed into precooled capillaries and 20 ng of reverse-transcribed total RNA in a volume of 5μl was added as PCR template. The GAPDH gene was chosen for normalization of the data. A negative control without cDNA template was per-formed to assess the overall specificity. To prepare the standard curve, 1μg of RNA from oral normal tissue was reverse-tran-scribed and dilutions of 200, 20, 2, and 0.2 ng of cDNA were made. PCR cycle conditions were the following: initial dena-turation was for 10 min at 95 °C followed by 45 cycles of amplification at 95 °C (10 s) for denaturation, 56–68 °C (10 s) for annealing, and 72 °C for extension, with a temperature slope of 20 °C/s. After amplification, the temperature was slowly elevated above the melting temperature of the PCR product to measure the fluorescence and thereby to determine the melting curve. A relative value for the initial target concentration in each reaction was determined on the basis of the kinetic approach using the LightCycler software, ver. 3.5. These real-time quan-titative RT-PCR data were calculated by the 2−ΔΔCtmethod for RNA quantification[25]. A gene expression in tumor tissue less than 2-fold of the normal counterpart was defined as under-expression and one with greater than 2-fold the normal counterpart was defined as over-expression.
3. Results
3.1. Analysis of the over-expressed proteins from OSCC tissue extracts
In this study, we investigated the reliability of protein detections by coupling an improved extraction method and a 2D-PAGE method previously optimized for soluble proteins, using the OSCC as a model system. A flow chart of the methods used in this work is depicted in Fig. 1. To identify the over-expressed proteins in OSCC tissues, we used the 2D-PAGE technology to monitor changes in the abundance of proteins. Total protein extraction rates do not differ significantly between OSCC and matching surrounding normal tissues. The proteins were quite evenly distributed in gel with P/S in the range of 3– 10 and molecular masses of 10–250 kDa. Fig. 2 shows re-presentative 2D master gel images for both OSCC (Fig. 2A) and matching normal samples (Fig. 2B). Some proteins were present in train spots, indicating that modified proteins or isoforms were well separated by 2-DE.
Averages of 800 spots were detected across all gels. Fully automated spot detection and quantification were also per-formed by PDQuest software, image pairs from each patient, followed by automated image to image matching and statistical analysis. The ratio values were compared and abundance ratios
between different samples from different gels were calculated. The ratio values are expressed as fold changes, i.e., a 2-fold increase in OSCC is expressed as 2.0. In the OSCC tissues, we found 41 commonly over-expressed protein spots (pb0.001) compared to the normal tissue pairs (data not shown). Highlighted in squares are the 11 protein spots that consistently showed significant over-expression in OSCC tissues in all cases analyzed. Statistic data for these proteins (or the sum of the isoforms) are summarized in Table 2 with fold differences in OSCC tissues relative to the normal tissue pairs (for an average of 10 pairs indicated). The table shows the alterations in the over-expression levels of the identified protein spots in OSCC tissues.αB-crystallin was increased 7.2-fold in OSCC that was the highest level over-expression among the 11 proteins. GST-pi was the lowest level (2.5-fold).
3.2. Protein identification by nanoLC-MS/MS analysis Each protein spot was excised and subjected to in-gel tryptic digestion, nanoLC-MS/MS and database matching.Table 3is a summary of the 11 over-expressed proteins: most of the matched proteins had high sequence coverage, accession number, theoretical Mr (kDa)/pI and MOWSE scores.
Fig. 1. Schematic representation of the procedures used for screening over-expressed proteins and genes in OSCC tissues.
Fig. 2. 2D protein patterns from OSCC and the normal tissue pair extracts. Two hundred micrograms of proteins were separated on 17 cm gels followed by silver staining. (A) Protein expression profile of one OSCC tissue of ten patients. (B) The normal tissue pair of (A).
Table 2
Summary of over-expressed proteins in OSCC tissues Spot no. Protein ID Experimental Mr (kDa) Experimental pI Over-expression (fold) 1 αB-crystallin 14.4–16 6–7 + 7.2 2 Tropomyosin 2 31 5–5.5 + 6.0 3 Myosin light chain 1 14.4–18 4–5 + 5.7 4 HSP27 21.5–37 6–6.5 + 4.3 5 Stratifin 14.4–21.5 4–5 + 3.6 6 Thioredoxin-dependent peroxide reductase 15–21.5 7.5–8 + 3.4 7 Flavin reductase 14.4–21.5 7–7.5 + 3.0 8 Vimentin 36.5–42 5 + 3.0 9 Rho GDI-2 14.4–21.5 5.5 + 2.6 10 GST-pi 14.4–21.5 5.5–6 + 2.5 11 MnSOD 19–21.5 8–9 + 2.1 HSP27, heat shock protein 27; MnSOD, superoxide dismutase [Mn]; Rho GDI-2, Rho GDP-dissociation inhibitor 2; GST-pi, glutathione S-transferase pi. Table 1
Names and sequences of oligonucleotides used for real-time RT-PCR analysis Gene Name Sequence (5′ to 3′)
MnSOD MnSOD-F GGCATTTCTGGATGTGAGCC MnSOD-R AGCAGGCAGGACATAGGTGC Vimentin Vimentin-F AGCATGTCCAAATCGATGTGG
Vimentin-R GCAGCCTCAGAGAGGTCAGC GST-pi GST P-F AGGCGGGCAAGGATGACTAT
GST P-R TGGATCAGCAGCAAGTCCAG Rho GDI-2 ρ GDI 2-F TGGGAGTGGAACCTGTCGAT ρ GDI 2-R GCAGTGTTGAAGAGGGACCC αB-crystallin ABC-F CTTTCCTTTCCACTCCCCCA
ABC-R TCCAGTGTCAAACCAGCTGG HSP27 HSP27-F GGCATTTCTGGATGTGAGCC
HSP27-R AGCAGGCAGGACATAGGTGC Myosin light chain 1 MLC 1-F TGCCTCCCAAGAAGGATGTT
MLC 1-R GGAGGCTCCTGGGTTTTCTG Total RNA was extracted from ten pairs of OSCC tissue and a pair of normal tissue. GAPDH gene was used as quantitative control.
HSP27, heat shock protein 27; MnSOD, superoxide dismutase [Mn]; Rho GDI-2, Rho GDP-dissociation inhibitor 2; GST-pi, glutathione S-transferase pi.
3.3. Functional annotation of over-expressed proteins identified from OSCC tissues
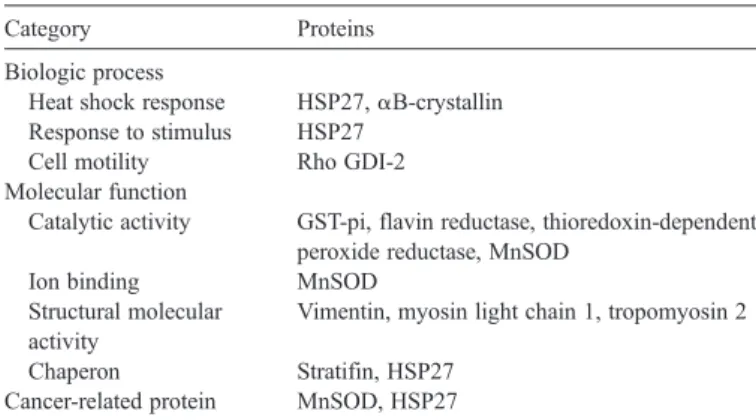
One goal of this study was to discover novel components of the OSCC proteome in order to identify potentially new bio-markers for OSCCs. To gain a better understanding of the 11 proteins identified in this study, we carried out functional annotation analysis of these proteins. Grouping and naming of the identified proteins in the functional annotation analysis were done according to the Gene Ontology convention[26]. Infor-mation on the four functional categories, i.e., biologic process, cellular component, molecular function and cancer-related protein was collected from the 11 proteins (Table 4).
3.4. Detection of the gene expression levels of the over-expressed proteins
In order to determine whether observed over-expressed proteins in OSCC tissues occurred at the levels of gene ex-pression, we performed real-time quantitative RT-PCR to evaluate the levels of mRNA of the 11 over-expressed proteins. These real-time quantitative RT-PCR data were calculated by using the 2−ΔΔCtmethod.
The expression levels ofαB-crystallin, myosin light chain 1 and MnSOD were the highest among 11 genes in all OSCC samples; the average increase over normal levels being 3.37-, 1.69- and 2.02-fold, respectively. The elevations of HSP27, Vimentin, and Rho GDI-2 in OSCC tissue were less obvious, with the average increase being over 0.79-, 1.07- and 1.04-fold (Fig. 3). 4. Discussion
Oral cancer remains one of the leading causes of death among men and therefore new protein markers have to be identified for its early detection. Identification of new bio-markers by proteomics currently relies on the 2-DE technology, picking out single spots, tryptic digestion and sequencing by MS. Once protein spots of interest have been identified as potential biomarkers, it is necessary to establish a more reliable assay. This is usually dependent on the development of a real-time quantitative RT-PCR or similar assay. The approach described in this study has the capability for improved screening and identification of over-expressed proteins in OSCC patients with oral cancer. In the present study, we quantified the protein levels in OSCC and the normal tissue pair with the goal to detect differences in the levels of proteins, which could serve as markers for the disease.
The number of proteins selected with over 2.0-fold induction consistent within 10 OSCC cases by our proteomic analysis consisted of 11 of the total approximately 800 proteins (Table 2). Even so, because the expression of these 11 proteins was consistently changed with OSCC, they may have relevance to the malignant alteration of oral mucosal epithelial cells. These seven genes have the potential of playing significant roles in
Table 3
Results of Q-TOF mass spectra and database searching for protein identification Protein ID Accession no. Identification method Theoretical Mr (kDa)/pI Score Sequence coverage Vimentin P08670 nanoLC-MS/ MS 53.5/5.06 135 10% Tropomyosin 2 P07951 nanoLC-MS/ MS 32.8/4.66 207 19% Myosin light chain 1 P05976 nanoLC-MS/ MS 21.0/4.97 92 19% HSP27 P04792 nanoLC-MS/ MS 22.8/5.98 138 32% Stratifin P31947 nanoLC-MS/ MS 27.8/4.68 82 15%
Rho GDI-2 P52566 nanoLC-MS/ MS 23.0/5.10 66 21% GST-pi P09211 nanoLC-MS/ MS 23.2/5.44 265 24% αB-crystallin P02511 nanoLC-MS/ MS 20.1/6.67 63 22% MnSOD P04179 nanoLC-MS/ MS 24.7/8.35 94 40% Thioredoxin-dependent peroxide reductase P30048 nanoLC-MS/ MS 27.7/7.67 29 36% Flavin reductase P30043 nanoLC-MS/ MS 22.0/7.31 69 19%
HSP27, heat shock protein 27; MnSOD, superoxide dismutase [Mn]; Rho GDI-2, Rho GDP-dissociation inhibitor 2; GST-pi, glutathione S-transferase pi.
Table 4
Classification of identified proteins by functional category Category Proteins
Biologic process
Heat shock response HSP27,αB-crystallin Response to stimulus HSP27
Cell motility Rho GDI-2 Molecular function
Catalytic activity GST-pi, flavin reductase, thioredoxin-dependent peroxide reductase, MnSOD
Ion binding MnSOD Structural molecular
activity
Vimentin, myosin light chain 1, tropomyosin 2
Chaperon Stratifin, HSP27 Cancer-related protein MnSOD, HSP27
HSP27, heat shock protein 27; MnSOD, superoxide dismutase [Mn]; Rho GDI-2, Rho GDP-dissociation inhibitor 2; GST-pi, glutathione S-transferase pi.
Fig. 3. Relative expressions of the seven genes were identified by real-time quantitative RT-PCR in OSCC tissues.
elucidating the molecular mechanisms of the carcinogenesis and malignant behavior. At the mRNA level, therefore, it may be very difficult to find an mRNA that is universally up-regulated or down-regulated in all oral cancer patients (Fig. 3).The reason for the heterogeneous changes of mRNA level may be due to the fact that the biology of oral cancer is very complex at the molecular level and there is no or very few common changes at the mRNA and protein levels among very heterogeneous oral cancer patients. Accumulating evidence has indicated that intracellular redox state plays important roles in cellular signal transduction and gene expression[27]. It has been suggested that ROS plays a role in all stages of carcinogenesis, including initiation, pro-motion, and progression [28]. In order to protect themselves from oxidative radical stress, cells have developed defense systems that comprise protein superoxide dismutases (SOD), catalase, glutathione peroxidases, and peroxiredoxins (PRX). SODs are antioxidant enzymes that catalyze the dismutation of O2−free radicals in H2O2, thereby preventing the accumulation
of this activated oxygen species. H2O2can be further converted
into H2O and O2by catalase and/or glutathione peroxidase.
The manganese-dependent MnSOD is characteristic of aerobic organisms and composed of 4 homologous 24 kDa subunits[29]. While MnSOD has been reported to protect the cell from a variety of insults and to suppress apoptosis[30], this enzyme may also be deleterious and impede cell proliferation under some circumstances [31,32]. Thus, MnSOD appear to control multiple reactions, the orchestration of which will determine the fate of cells, in particular cancer cells[33]. Fol-lowing the previous study, the up-regulation of MnSOD cor-related with progression of disease from premalignant to invasive cancer reflects the cell defense effort in maintaining intracellular homeostasis[34]. Similar observations have been found in other cancers including the over-expression of MnSOD in human prostate cancer cell lines[35]and in buccal SCC[36]. The role of MnSOD in carcinogenesis is still controversial and unclear. In our study, MnSOD over-expressed in the protein level and correlated with gene expression. The elevation of MnSOD may imply that the antioxidant defense system has been stimulated in OSCC tissues.
Experimental evidence suggests that HSPs may promote tumorigenesis by suppressing apoptosis[37]. On the contrary, it seems that some members of HSPs play important roles in the immune response against cancer [38]. HSP27 is a stress-in-ducible cytosolic protein that ubiquitously present in many normal tissues[39]. Recent studies have shown that HSP27 may play a role in thermotolerance, cellular proliferation and apo-ptosis, estrogen response and molecular chaperoning[40–44]. Over-expression of HSP27 has been reported in many kinds of tumor tissues and found to be associated with the prognosis of astrocytic brain tumor, breast cancer, malignant fibrous histiocy-toma, ovarian carcinoma, osteosarcoma, hepatocellular carcino-ma and renal cell carcinocarcino-ma [45–52]. Moreover, it was also reported to play a cytoprotective role in hormone-refractory prostate cancer [53]. Therefore, HSP27 will not be a specific tumor marker for OSCC. Among the several HSP proteins, HSP27 and HSP70 have been shown to have a strong association with cancer, showing, during carcinogenesis, alteration of their
expression levels, either increasing or decreasing[54]. Moreover, the HSP27 was known to be a constitutive protein in many cell types, therefore it was only over-expressed in protein levels, but not in gene levels in OSCC tissues which is a common phe-nomenon (Table 2andFig. 3).
To our knowledge, MnSOD and HSP27 are both cancer-related proteins. Using proteomic and real-time quantitative RT-PCR analyses, we established initially that there is over-expression of MnSOD and HSP27 in OSCC tissues from oral cancer patients in this study. In order to understand the bio-logical role of MnSOD and HSP27 in tumorigenesis of oral cancer, we will study their expression in oral cancer by immu-nohistochemistry (IHC) and western blot in samples of OSCCs and in oral relative cell lines, correlating its expression with clinicopathological features. Now, for further validation of MnSOD and HSP27 as the OSCC biomarkers, we used a larger cohort of samples and studies on the molecular mechanisms in OSCC carcinogenesis are being carried out in our lab. The current success in identifying a number of tumor-associated proteins proved that proteomic analysis could provide rich information to help understand the pathology of a disease in an integrated way. These extensive protein variations indicate that multiple cellular pathways were involved in the process of tumorigenesis, and suggest that multiple protein molecules should be simultaneously targeted as an effective strategy to counter the disease. These tumor-associated proteins can be further evaluated as potential biomarkers for clinical diagnosis and as targeted proteins for pathogenetic investigations. Acknowledgments
This work was supported by a grant from China Medical University Hospital (DMR-93-058).
References
[1] Petersen PE. Continuous improvement of oral health in the 21st century— the approach of the WHO global oral health programme. Geneva: World Health Organization; 2003.
[2] Fearlay J, Bray F, Pisani P, Parkin DM. Cancer incidence, mortality and prevalence worldwide. Version 1.0. IARC cancer base, vol. 5. Lyon: IARC Press; 2001.
[3] Chen CH. An epidemiological study of oral squamous cell carcinoma in southern Taiwan. J Formosan Dent Assoc 1987;10:268–74.
[4] Department of Health. Cancer registry annual report in Taiwan area, 2003. Taipei: Department of Health. The Executive Yuan, ROC; 2005. [5] Yang Yu-Yen, Koh Lim-Woh, Yang Chi-Chiang. Involvement of viral and
chemical factors with oral cancer in Taiwan. Jpn J Clin Oncol 2004;34:176–83. [6] Chen PC, Pan CC, Kuo C, Lin CP. Risk of oral nonmalignant lesions associated with human papillomavirus infection, betel quid chewing, and cigarette smoking in Taiwan: an integrated molecular and epidemiologic study. Arch Pathol Lab Med 2006;130:57–61.
[7] Chen IH, Chang JT, Liao CT, Wang HM, Hsieh LL, Cheng AJ. Prognostic significance of EGFR and Her-2 in oral cavity cancer in betel quid prevalent area cancer prognosis. Br J Cancer 2003;89:681–6.
[8] Turhani D, Krapfenbauer K, Thurnher D, Langen H, Fountoulakis M. Identification of differentially expressed, tumor-associated proteins in oral squamous cell carcinoma by proteomic analysis. Electrophoresis 2006;27 (7):1417–23.
[9] Gstaiger M, Jordan R, Lim M, et al. Skp2 is oncogenic and overexpressed in human cancers. Proc Natl Acad Sci U S A 2001;98:5043–8.
[10] Huang X, Gollin SM, Raja S, Godfrey TE. High-resolution mapping of the 11q13 amplicon and identification of a gene, TAOS1, that is amplified and overexpressed in oral cancer cells. Proc Natl Acad Sci U S A 2002;99: 11369–74.
[11] Sugimura T, Kumimoto H, Tohnai I, et al. Gene–environment interaction involved in oral carcinogenesis: molecular epidemiological study for metabolic and DNA repair gene polymorphisms. J Oral Pathol & Med 2006;35:11–8.
[12] Kallioniemi O. Medicine: profile of a tumour. Nature 2004;428:379–82. [13] Geho David H, Petricoin Emanuel F, Loitta Lance A. Blasting into the
microworld of tissue proteomics: a new window on cancer: commentary re S. A. Schwartz et al., protein profiling in brain tumors using mass spectrometry feasibility of a new technique for the analysis of protein expression. Clin Cancer Res 2004;10:825–7.
[14] Herrmann Paul C, Liotta Lance A, Petricoin III Emanuel F. Cancer proteomics: the state of the art. Dis Markers 2001;17:49–57.
[15] Xiao X, Liu D, Tang Y, et al. Development of proteomic patterns for detecting lung cancer. Dis Markers 2003–2004;19:33–9.
[16] Wulfkuhle JF, McLean KC, Paweletz CP, et al. New approaches to proteomic analysis of breast cancer. Proteomics 2001;1:1205–15. [17] Paweletz CP, Trock B, Pennanen M, et al. Proteomic patterns of nipple
aspirate fluids obtained by SELDI-TOF: potential for new biomarkers to aid in the diagnosis of breast cancer. Dis Markers 2001;17:301–7. [18] Feldman AL, Espina V, Petricoin EF, Liotta LA, Rosenblatt KP. Use of
proteomic patterns to screen for gastrointestinal malignancies. Surgery 2004;135:243–7.
[19] He Q, Chen J, Kung H, Yuen A, Chiu J. Identification of tumor-associated proteins in oral tongue squamous cell carcinoma by proteomics. Proteomics 2004;4:271–8.
[20] Wu W, Tang X, Hu W, Lotan R, Hong WK, Mao L. Identification and validation of metastasis-associated proteins in head and neck cancer cell lines by two-dimensional electrophoresis and mass spectrometry. Clin Exp Metastasis 2002;19(4):319–26.
[21] Gharahdaghi F, Weinberg CR, Meagher DA, Imai BS, Missche SM. Mass spectrometric identification of proteins from silver-stained polyacrylamide gel: a method for the removal of silver ions to enhance sensitivity. Lectrophoresis 1999;20:601–5.
[22] Terry DE, Umstot Edward, Desiderio DM. Optimized sample-processing time and peptide recovery for the mass spectrometric analysis of protein digests. J Am Soc Mass Spectrom 2004;15:784–94.
[23] Hirosawa M, Hoshida M, Ishikawa M, Toya T. MASCOT: multiple alignment system for protein sequences based on three-way dynamic programming. Comput Appl Biosci 1993;9:161–7.
[24] Chang JT, Chen IH, Liao CT, et al. A reverse transcription comparative real-time PCR method for quantitative detection of angiogenic growth factors in head and neck cancer patients. Clin Biochem 2002;35:591–6. [25] Livak Kenneth J, Schmittgen Thomas D. Analysis of relative gene
expression data using real-time quantitative PCR and the 2−ΔΔCTmethod. Method 2001;25:402–8.
[26] Ashburner M, Ball CA, Blake JA, et al. Gene ontology: tool for the unification of biology. The Gene Ontology Consortium. Nat Genet 2000;25: 25–9.
[27] Kamata H, Hirata H. Redox regulation of cellular signalling. Cell Signal 1999;11:1–14.
[28] Klaunig JE, Xu Y, Isenberg JS, et al. The role of oxidative stress in chemical carcinogenesis. Environ Health Perspect 1998;106:289–95. [29] Wispe JR, Clark JC, Burhans MS, Kropp KE, Korfhagen TR, Whitsett JA.
Synthesis and processing of the precursor for human mangano-superoxide dismutase. Biochim Biophys Acta 1989;994:30–6.
[30] Scott MD, Meshnick SR, Eaton JW. Superoxide dismutase amplifies organismal sensitivity to ionizing radiation. J Biol Chem 1989;264: 2498–501.
[31] Wheeler MD, Smutney OM, Samulski RJ. Secretion of extracellular superoxide dismutase from muscle transduced with recombinant adeno-virus inhibits the growth of B16 melanomas in mice. Mol Cancer Res 2003;1:871–81.
[32] Mashiba H, Matsunaga K. Device for intracellular increase of oxygen free radicals and inhibition of MethA tumour cell proliferation: in vitro and in vivo studies. Int J Tissue React 1988;10:273–80.
[33] Guyton KZ, Kensler TW. Oxidative mechanisms in carcinogenesis. Br Med Bull 1993;49:523–44.
[34] Qi Y, Chiu JF, Wang L, Kwong DL, He QY. Comparative proteomic analysis of esophageal squamous cell carcinoma. Proteomics 2005;5(11):2960–71. [35] Zhong W, Yan T, Webber MM, Oberley TD. Alteration of cellular
phenotype and responses to oxidative stress by manganese superoxide dismutase and a superoxide dismutase mimic in RWPE-2 human prostate adenocarcinoma cells. Antioxid Redox Signal 2004;6:513–22.
[36] Chen J, He QY, Yuen AP, Chiu JF. Proteomics of buccal squamous cell carcinoma: the involvement of multiple pathways in tumorigenesis. Proteomics 2004;4:2465–75.
[37] Jaattela M. Escaping cell death: survival proteins in cancer. Exp Cell Res 1999;248:30–43.
[38] Multhoff G, Botzler C, Jennen L, Schmidt J, Ellwart J, Issels R. Heat shock protein 72 on tumor cells: a recognition structure for natural killer cells. J Immunol 1997;158(9):4341–50.
[39] Multhoff G, Botzler C, Jennen L, Schmidt J, Ellwart J, Issels R. Heat shock protein 72 on tumor cells: a recognition structure for natural killer cells. J Immunol 1997;158:4341–50.
[40] Landry J, Chre'tien P, Lambert H, et al. Heat shock resistance conferred by expression of the human HSP27 gene in rodent cells. J Cell Biol 1989;109: 7–15.
[41] Charette SJ, Lavoie JN, Lambert H, Landry J. Inhibition of Daxx-mediated apoptosis by heat shock protein 27. Mol Cell Biol 2000;20:7602–12. [42] Mehlen P, Schultze-Osthoff K, Arrigo AP. Small stress proteins as novel
regulators of apoptosis. Heat shock protein 27 blocks Fas/APO-1-and staurosporine-induced cell death. J Biol Chem 1996;271:16510–4. [43] Jakob U, Gaestel M, Engel K, Buchner J. Small heat shock proteins are
molecular chaperones. J Biol Chem 1993;268:1517–20.
[44] Porter W, Wang F, Wang W, et al. Role of estrogen receptor/Sp1 complexes in estrogen-induced heat shock protein 27 gene expression. Mol Endocrinol 1996;10:1371–8.
[45] Assimakopoulou M, Sotiropoulou-Bonikou G, Maraziotis T, Varakis I. Prognostic significance of Hsp-27 in astrocytic brain tumors: an im-munohistochemical study. Anticancer Res 1997;17:2677–82.
[46] Storm FK, Gilchrist KW, Warner TF, Mahvi DM. Distribution of Hsp-27 and HER-2/neu in in situ and invasive ductal breast carcinomas. Ann Surg Oncol 1995;2:43–8.
[47] Tetu B, Lacasse B, Bouchard HL, et al. Prognostic influence of HSP-27 expression in malignant fibrous histiocytoma: a clinicopathological and immunohistochemical study. Cancer Res 1992;52:2325–8.
[48] Geisler JP, Geisler HE, Tammela J, et al. Heat shock protein 27: an independent prognostic indicator of survival in patients with epithelial ovarian carcinoma. Gynecol Oncol 1998;69:14–6.
[49] Uozaki H, Ishida T, Kakiuchi C, et al. Expression of heat shock proteins in osteosarcoma and its relationship to prognosis. Pathol Res Pract 2000;196: 665–73.
[50] King KL, Li AF, Chau GY, et al. Prognostic significance of heat shock protein-27 expression in hepatocellular carcinoma and its relation to histologic grading and survival. Cancer 2000;88:2464–70.
[51] Chen J, Kahne T, Rocken C, et al. Proteome analysis of gastric cancer metastasis by two-dimensional gel electrophoresis and matrix assisted laser desorption/ionization-mass spectrometry for identification of metastasis-related proteins. J Proteome Res 2004;3:1009–16.
[52] Sarto C, Valsecchi C, Magni F, et al. Expression of heat shock protein 27 in human renal cell carcinoma. Proteomics 2004;4:2252–60.
[53] Rocchi P, So A, Kojima S, et al. Heat shock protein 27 increases after androgen ablation and plays a cytoprotective role in hormone-refractory prostate cancer. Cancer Res 2004;64:6595–602.
[54] Ferrarini M, Heltai S, Zocchi MR, Rugarli C. Unusual expression and localization of heat-shock proteins in human tumor cells. Int J Cancer 1992;51(4):613–9.