台灣汽車產業分析
52
0
0
全文
(2) 台灣汽車產業分析 指導教授:李博志 博士 國立高雄大學 亞太工商管理學系 丁一賢 博士 國立高雄大學 資訊管理學系 學生:林玟萱 國立高雄大學國際企業管理碩士學位學程. 摘要 隨著台灣人民所得增加,購買汽車的需求也相對成長,在一個國家的經濟發 展上,汽車產業常扮演著主導的角色。利用赫芬德指數分析,我們發現台灣汽車 產業是高度集中,在定價方面,主導廠商扮演關鍵的角色,而奢侈稅的出現就是 要限制汽車大量進口的現象。本地製造的汽車影響國家的總體經濟說明參照台灣 汽車產業。. 關鍵字:汽車產業,赫芬德指數,價格領導,奢侈稅. 2.
(3) A Study of Automobile Industry in Taiwan Advisor: Po-Chih Lee, Ph. D Department of Asia-Pacific Industrial and Business Management National University of Kaohsiung I-Hsien Ting, Ph. D Department of Information Management National University of Kaohsiung Student: Wen-Hsuan Lin International Master of Business Administration Program National University of Kaohsiung. Abstract As the income of Taiwanese has risen, then the demand for cars has grown, the automobile industry often plays a dominant role in a country's economic development. With firms in the fringe acting as price takers, the dominant firm, as the only agent, which is able to set price. By using the Herfindahl index, we find that the automobile industry in Taiwan is highly concentrated, and dominant firm plays a key role in setting price. Locally made cars influence the macroeconomic of country is illustrated with reference to the Taiwan automobile industry.. Keywords: Automobile industry, Herfindahl index, Price leadership, Luxury tax. 3.
(4) Table of Contents Chapter 1 Introduction 1.1Background………………………………………………...………………………1 1.2 Purposes of the Study……………………………………………………………...5 1.3 Flow Chart of the Study…………………………………………………………...5 Chapter 2 Literature Review 2.1Demand for cars……………………………………………………………………7 2.2 Income Factor…………………………………………………………………….13 2.3 Price Factor……………………………………………………………………....14 Chapter 3 Methodology 3.1Market structure use The Herfindahl Index……………………………………....17 3.2 Price leadership Theory…………………………………………………………..20 Chapter 4 Major Findings 4.1Current car producers in Taiwan………………………………………………….24 4.2 Evaluate concentration ratios of car productive………………………………….30 4.3 Assume pricing issue……………………………………………………………..32 4.4 Evaluate luxury tax……………………………………………………………….34 4.5 Upgrade technology issue………………………………………………………..36 Chapter 5 Concluding Remarks 5.1Major Findings……………………………………………………………………41 5.2 Suggestions………………………………………………………………………42 5.3 Future Study………………………………………………………………...……43 Reference……………………………………………………………………………..45. 4.
(5) List of Tables Table 1.1: Per Capita Gross National Product………………………………………...3 Table 1.2: Number of Motor Vehicles Registered…………………………………….4 Table 2.1: Estimates of Minimum Efficiency Scale…………………………………10 Table 4.1: The Units of Passenger Cars……………………………………………...25 Table 4.2: The Taiwanese Automobile Industry for New Car……………………….27 Table 4.3: The Units of Production for Each Automobile Firm……………………..28 Table 4.4: The Units of Taiwanese Locally Made Car (1)…………………………...29 Table 4.5: The Units of Taiwanese Locally Made Car (2)…………………………...30 Table 4.6: The Price of 2000cc Model of Each Automobile Firm…………………...33 Table 4.7: Cumulative Prius Sales…………………………………………………...38. 5.
(6) List of Figures Figure 1.1: Flow Chart………………………………………………………………...6 Figure 2.1: Demand and Supply in a Market………………………………………...15 Figure 3.1: Price Leadership Theory (1)……………………………………………..23 Figure 3.2: Price Leadership Theory (2)……………………………………………..23. 6.
(7) Chapter 1 Introduction 1.Background. In 1946, Peter Drucker labeled the international automotive industry as the “industry of industries”, it is being a cradle for technological, manufacturing, commercial and organizational innovations that shaped also the structure of many other industries. The reason Drucker made this statement is clear if we consider the industry’s scale, the share in total manufacturing employment, GDP and exports as well as its numerous forward and backward linkages with the rest of the economy. Cars are pervasive in modern economies, and are almost a defining gauge for how we view a country’s degree of economic development. Widespread car ownership has major implications for everyday life, countries economic and social fabric, and government policies. (Chamon, 2008) Automobile industry in Taiwan has the characteristics of capital and technology intensive, strong operation management capability; supply chain closed relationship and has played a critical role in the international market. With the aim of "Using Generators to Save the Nation", the founder of the YULON Company Mr. Ching-Ling Yen established the company on September 10, 1953. From 1968 to 1978, policy started to change towards export orientation, there are many car factory was established in succession, the economy of Taiwan started to bloom, the average income of the citizen was over 2,000 US dollars a year and the automobiles market scale had reached 150,000 cars a year. With the assistant programs & policy from the government, YULON started to expand production 7.
(8) capacity and open up the automobiles market in Taiwan and took the lead of the entire development of automobiles industry in Taiwan. From 1979 to 1985, the introduction of various technologies for components localization, the economy of Taiwan grew rapidly, the average income of the citizen was over 3,352 US dollars a year and the automobiles market scale had reached 250,000 cars a year. The most basic form of assistance was the erection of a high tariff wall, as much as 65% as recently as 1985, to protect manufacturers from more efficient producers abroad. Taiwan completely changed its automotive industry policy from protection to deregulation in 1985. The new policy included the free entry of assemblers, reductions in import tariffs, the loosening of local content requirements, and the promotion of foreign capital inflows and technology transfers. As a result, the major Taiwanese vehicle manufacturers, which had previously monopolized the domestic market, were exposed to competition from joint ventures located overseas. In order to survive, they were compelled to invite foreign capital, especially from Japan, and form their own joint ventures. Many of these introduced the Japanese system of components procurement and made efforts to improve quality and lower costs. From 1986 to 1997, lower tariffs, and the introduction of foreign cooperation depot to Taiwan. From 1997 to now, after joining the WTO in 2002, Taiwan’s auto industry gradually with international standards. In 1995, Taiwan’s automobile market of locally made has reached total amount 577,000 cars, the highest peak in history. Taiwan's gross industrial output value of the vehicle continues to grow in 2005 reached a record high of NT$ 230.9 billion, the highest peak in history. The year of 2013 in quarter 1 and quarter 2 has reached of NT$ 90.6 billion.. 8.
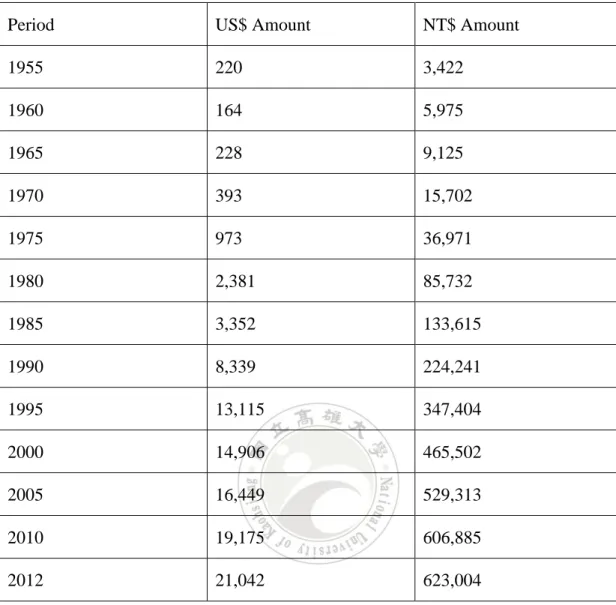
(9) Table 1.1: Per Capita Gross National Product At Current Prices Period. US$ Amount. NT$ Amount. 1955. 220. 3,422. 1960. 164. 5,975. 1965. 228. 9,125. 1970. 393. 15,702. 1975. 973. 36,971. 1980. 2,381. 85,732. 1985. 3,352. 133,615. 1990. 8,339. 224,241. 1995. 13,115. 347,404. 2000. 14,906. 465,502. 2005. 16,449. 529,313. 2010. 19,175. 606,885. 2012. 21,042. 623,004. Sources: Taiwan Statistical Data Book 2013, Executive Yuan, R.O.C. (Taiwan). Table 1.1 shows that through the year of 1955 to 2012, the 57 years, the amount of US Dollar from 220 to 21,042, have gained 96 times, and the amount of NT Dollar from 3,422 to 623,004, have increased 182 times, it represents the growing of Taiwanese per capita gross national product.. 9.
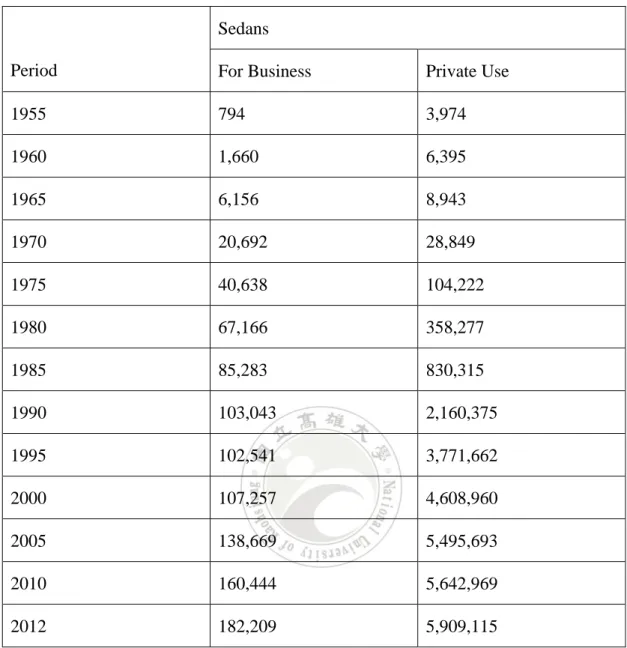
(10) Table 1.2: Number of Motor Vehicles Registered Sedans Period. For Business. Private Use. 1955. 794. 3,974. 1960. 1,660. 6,395. 1965. 6,156. 8,943. 1970. 20,692. 28,849. 1975. 40,638. 104,222. 1980. 67,166. 358,277. 1985. 85,283. 830,315. 1990. 103,043. 2,160,375. 1995. 102,541. 3,771,662. 2000. 107,257. 4,608,960. 2005. 138,669. 5,495,693. 2010. 160,444. 5,642,969. 2012. 182,209. 5,909,115. Sources: Taiwan Statistical Data Book 2013, Executive Yuan, R.O.C. (Taiwan). Table 1.2 shows that through the year of 1955 to 2012, the 57 years, the number of sedans for business from 794 to 182,209, have increased 229 times, and the number of sedans for private use from 3,974 to 5,909,115, have gained 1,487 times, it means the increasing of number of motor vehicles. Because economies of scale in the production of Taiwan cannot reach the goal in order to enjoy the cost advantages that come with mass production, although the. 10.
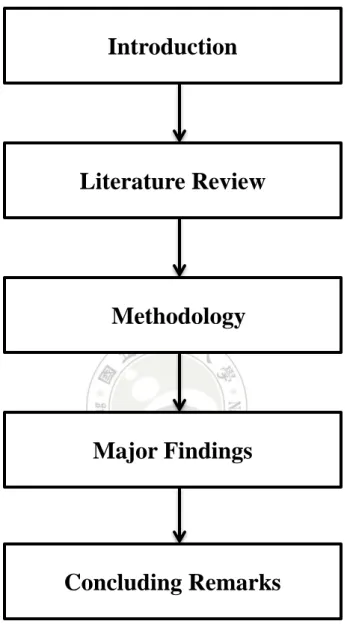
(11) quality of Taiwan-made cars is sufficient for international competition, the high costs of production limits their competitiveness due to a lack of economies of scale, overseas investment in factories of the future development necessary.. 2. Purposes of the Study. This study is to analyze household demand for new passenger car, exclude trucks, bus, and the used cars. Our primary goal is to analyze the market structure of new car industry and its demand situation. Namely, the main purposes of this study are to 1.. Investigate Taiwan automobile industry. 2.. Analyze the market structure of new cars to see if there is an existence of competitive market, and. 3.. Examine the pricing issue of new cars. 3. Flow Chart of the Study. There are a total of 5 chapters in this thesis. Chapter 1 gives an introduction of the research. Chapter 2 literature on the whole automobile market, especially for Taiwanese firms future policy. Chapter 3 identifies the major firms market share in this industry using concentration ratio. Chapter 4 determines the reasons causing the economic inefficiency and the reaction of current automobile firms. Chapter 5 outline major findings and provide suggestions to its future perspectives. We draw a chart in Figure 1.1.. 11.
(12) Introduction. Literature Review. Methodology. Major Findings. Concluding Remarks Figure 1.1: Flow Chart. 12.
(13) Chapter 2 Literature Review 1. Demand for Cars. Based on the Industrial Bureau of the Ministry of Economic Affair, Taiwan, the number of cars in Taiwan increased by 42% from 109,160 in 1979 to 258,753 in 2013. The demand for automobiles in the Unites States has been examined numerous times. A classic regression analysis is that done by Gregory Chow (1960). Chow’s estimated automobile demand function in the United States is. Where the per-capita stock of automobiles at the end of time period , given in hundredths of a unit, an automobile price index, and expected per-capita income. The. Since the coefficient of. is negative while that of. indicates that an increase in automobile prices will reduce expected income would increase. is positive, the equation , whereas an increase in. , which is as we would expect. It is possible from. Chow’s equation to calculate price and income elasticity of demand for car ownership when. and. are specified.. Car ownership increases with income. All else equal, one would expect higher inequality to increase the growth in ownership rates at low levels of income, because. 13.
(14) higher inequality increases the number of households with sufficiently high income to buy a car. However, at a more advanced stage of development, higher inequality will have the opposite effect, by creating a larger mass of poor households that cannot afford a car despite a relatively high average income in the country (Chamon, 2008). Accelerated economic development and increased living standards in Taiwan have made automobiles the conventional means of transportation. In light of increased personal income levels and fierce market competitiveness, consumers highly prioritize appearance and model, when selecting vehicles. To satisfy consumers’ preferences, except for fitting basic functions, automobile model must undergo innovative advances with respect to the size effect to gain a competitive advantage in the car market. Although increasing the consumers’ range of selection, a wide variation of sizes has created refit side effects in the automobile. As a case in point, consider car manufacturers. A car owner relies on warranties to cover malfunctions early in the car’s life, on car parts to be available when the car breaks down, and on the presence of a dealer who can service the car. In autos, as in many other durable goods industries, the provision of these and similar services is frequently vertically integrated into the manufacturer. If a car manufacturer were to go bankrupt, it may not honor the warranties or provide parts and services in the future, reducing the consumption of the durable goods owner. (Gregor Matvos, Chad yverson, Ali orta su, Sriram Venkataraman, 2010) The durable goods channel is a potentially important source of indirect costs of financial distress. Durable goods manufacturers alone account for about 7 percent of U.S. value added, and many other products and services have long-lived “durable-like” elements in their provisions, making them subject to the mechanism described above. Automobiles represent a significant fraction of household wealth; they account for 14.
(15) about 5 percent of consumption in the U.S. and are the nonfinancial asset most commonly held by households. (Bucks, 2009) Michael Porter in 1980 of his book “Competitive trategy” mentioned that there are four segmentations of the industry, cost leadership, cost focus, differentiation leadership and differentiation focus. Automobile industry as a cost leadership, it has to create a low cost of operation within their niche. The use of this strategy is primarily to gain an advantage over competitors by reducing operation costs below that of others in the automobile industry. Economies of scale have two different categories, one is internal economies of scale occur when the cost per unit depends on the size of an individual firm but not necessarily on that of the industry as a whole. On the other hand, the other is external economies of scale occur at the level of the industry instead of the firm. The failure of the Taiwanese automobile industry discussed here is a typical case to show problems resulting from a lack of internal economies of scale. Because of internal economies of scale are easier to identify in practice and of immediate value to the automobile assembly industry. (Chia-Wen Chen, 1995) However, in 2013, the six manufactures produced passenger cars an aggregate total of about 338,084 vehicles and over 60 models. That is an average of only 56,347 vehicles per manufacturer per year and less than 5634 units per model per year. If we look at the production scale of one single model, those ones produced below 10,000 units stood for two-thirds of the total production and there was no model with a production over 50,000 units. No firm could remain competitive without taking full advantage of scale economies for all component manufacture and assembly. Major world firms are able to combine these economies with economies in design and development of new models, and in marketing and distribution, and apply all of these 15.
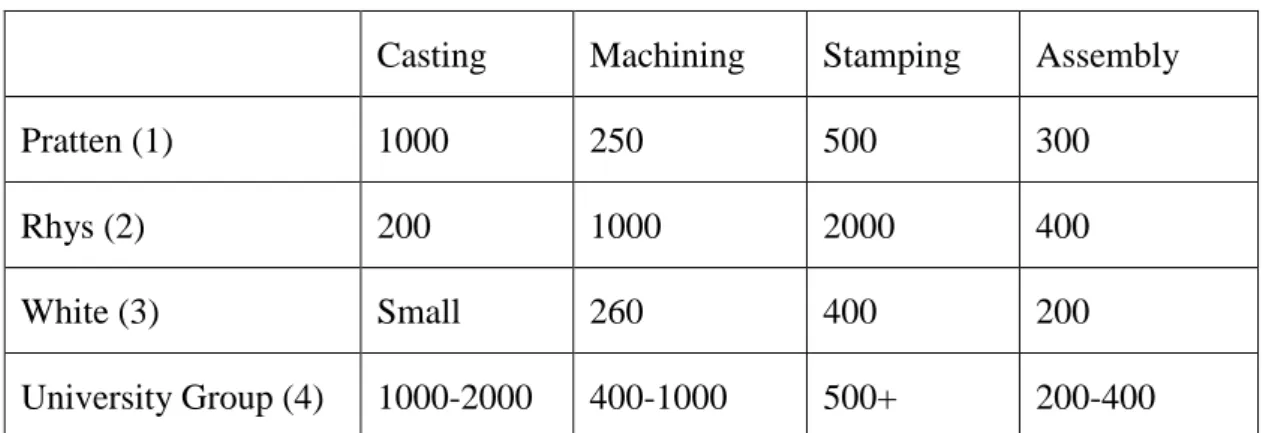
(16) scale economies across a multi-model range spanning all the major market segments. It has been argued that only integrated mega volume producers can survive in this market. (Altshuler, 1984) Table 2.1: Estimates of Minimum Efficiency Scale Casting. Machining. Stamping. Assembly. Pratten (1). 1000. 250. 500. 300. Rhys (2). 200. 1000. 2000. 400. White (3). Small. 260. 400. 200. University Group (4). 1000-2000. 400-1000. 500+. 200-400. Units: Thousand Units Per Year (1) Pratten, C.F. (1971) Economics of Scale in Manufacturing Industries (2) Rhys, D.G. (1971) The Motor Industry: An Economic Survey (3) White, L.J. (1971) The Automobile Industry Since 1945 (4) University of Bristol Research Group Source: Krish Bhaskar, The Future Of The World Motor Industry, 1980, NY, NY: Nicholas Publishing Co.. Table 2.1 lists the estimates given by a number of researchers of the minimum efficiency scale, shows that individual models should be produced at a minimum level of 200,000 units according to the traditional mass production principles. Close relationships between the automobile industry and other industries, for instance, vertical correlations and horizontal correlations. The processes of the automobile industry include market surveys, specifications setting, model fabrication, design, fabrication of molds and dies, trial fabrication of components, assembly, 16.
(17) testing, mass-production, marketing and after-sales services, all of which involve several related industries (namely market survey, service, mold fabrication, component manufacturing, dealership and advertisement). Additionally, it requires many professional skills: marketing, purchase, technicians and management. Summarizing the above, significant vertical correlation exists between the automobile industry and other industries. Generally, an automobile comprises approximately 8,000 to 15,000 components, made from various materials, including steel, rubber, plastics and glass. If the production capacity of automobiles can continue growing and auto- mobile quality can continue improving, this can be significantly attributed to the upgrading and development of the component and parts industries, simultaneously brining these industries profit and prosperity. (Taiwan Industrial Outlook, 2013) Despite its recent rapid growth, Taiwan's automotive industry now faces various problems. This section discusses the diseconomies of scale that are one result of the flood of assemblers, as well as the difficulties that Taiwan's membership of the WTO, to be realized in the near future, will produce. It also discusses the prospects for Taiwan's automotive industry. As mentioned above, fierce competition among assemblers has been the engine of the industry's recent growth. There are at present, however, 11 assemblers operating on this small island, the same number as that of major assemblers in Japan, although Taiwan's annual automotive production was only 4.12 percent of that of Japan in the January of 2014. Clearly, Taiwan has too many assemblers, and the production system of each manufacturer is inevitably inefficient as a result. The issue of diseconomies of scale is particularly serious for components manufacturers, which should enjoy the benefits of economies of scale more effectively than the final assemblers. One study shows that out of 72 components 17.
(18) produced on the island, only 27 were internationally competitive in terms of price. Although the level of Taiwan's components industry has recently improved, it is still far below international levels. Since 1991, the government has obliged Japanese assemblers to export components back to Japan. The main aim of this policy is to foster the components industry by enlarging its scale of production, while at the same time trying to reduce the trade deficit with Japan. This policy, however, has not yet solved the industry's fundamental problems. Moreover, Taiwan's membership of the WTO will probably have a serious impact on the automotive industry, as further liberalization will be required. For instance, some protective measures that remained even after 1985, such as import restrictions on finished vehicles from certain countries such as Japan, and regulations on the local-component ratio, will have to be alleviated or removed. In addition, tariff rates will be lowered. The removal of the import ban on Japanese cars will cause particularly serious damage to assemblers on the island. Even from the standpoint of Japanese assemblers and components manufacturers in Taiwan, the import of Japanese vehicles will press the management of their subsidiaries on the island. Although Taiwan is currently considering plans to introduce a tariff quota system, the industry will face a difficult situation in the near future. Thus, although Taiwan's automotive industry has been achieving rapid growth, the circumstances surrounding it are becoming increasingly severe. Recently, the necessity of concentrating production into the top 3 assemblers has been frequently discussed in Taiwan. A restructuring of the industry is inevitable. In fact, a polarization of assemblers into top and bottom groups has been 18.
(19) occurring in Taiwan over the last few years. With the environment surrounding the automotive industry, it is expected that this trend will accelerate further and eventually lead to a greater concentration of production. The automotive industry in Taiwan is now at a turning point. (Momoko Kawakami, 1995) As the pressure of international competition has grown, so too has the demand for hybrid business unit strategies. They combine the competitive advantages of low costs and differentiation. There are both empirical and theoretical arguments for their use. The possibilities and limits of these strategies and their growing importance for different market segments are illustrated with reference to the German automotive industry. (Heike Proff, 2000). 2. Income Factor. Bill Gates says, “The more income a person has, the more expensive cars he will buy”. The automobile industry often plays a dominant role in a country's economic development. In the US, the automotive industry accounts for 5 percent of GNP and 17 percent of industrial employment. It is a vital element in the country's development because of the substantial linkages to other economic activities. As income rises, this share tends to decline, whereas demand for manufactures rises. Similarly, as income rises further, demand for manufactures increases at diminishing rates, whereas demand for services rises rapidly. Changes in demand will also change sectorial employment and output shares and impact the economy’s labor productivity. Furthermore, trade has an impact on countries’ specialization patterns and on the rate of industrialization or structural change within industries. (Matleena 19.
(20) niivil , 2005) The current understanding of economic growth is largely based on the neoclassical growth model developed by Robert Solow (1956). In the Solow model, capital accumulation is a major factor contributing to economic growth. Productivity growth, measured as an increase in output per worker – results from increases in the amount of capital per worker, or capital accumulation (Fagerberg, 1994). Capital deepening will continue until the economy reaches its steady state, a point at which net investments grow at the same rate as the labor force and the capital labor ratio remains constant. The further the economy is below its steady state, the faster it should grow (Jones, 1998). Changes in the market environment, particularly in the supply and demand conditions, and new technologies, can contribute to the two strategies, low costs and differentiation, being successful simultaneously. On the demand side, they show up in stagnating demand for new cars, which is making long turn profits in the core segments fall, the increasing practice of providing the full range of equipment as standard rather than as optional extras that bring in more profit and the increasing demand for niche products.. 3. Price Factor. The word demand has a precise meaning in economics. It refers to the willingness and ability of buyers to purchase different quantities of a good at different prices during a specific time period (per day, week, and so on). Unless both willingness and ability to buy are present, a person is not a buyer and there is no demand. (Roger Arnold, 2005) 20.
(21) Figure 2.1: Demand and Supply in a Market. Figure 2.1 shows price factors will shift at D1 to D2. Supply remains the same; quantity demand will shift from Q1 to Q2, as price will from P1 to P2.. The law of demand tells us that when prices go up demand goes down and when prices go down demand goes up; states that price and quantity demanded are inversely related, which quantity demanded is the number of units of a good that individuals are willing and able to buy at a particular price during some period. Demand measures the amount of a good or service that people are willing and able to buy at a specified price. And a demand curve plots the size of demand at various prices. Several factors influence demand: diminishing marginal utility, income, substitution goods, complementary goods, and tastes or preferences. And the more that a price changes influences our willingness and ability to buy a product, the more elastic is that product’s demand. The downward sloping demand curve is the graphical representation of the inverse relationship between price and quantity demanded specified by the law of demand. 21.
(22) The law of supply states that, all else equal, as the price of good rises, the quantity supplied of the good rises, and as the price of good falls, the quantity supplied of the good falls, ceteris paribus, which quantity supplied is the number of units of a good sellers are willing and able to produce and offer to sell at a particular price. (Roger Arnold, 2005) In other words, there is a direct relationship between price and quantity: quantities respond in the same direction as price changes. This means that producers are willing to offer more products for sale on the market at higher prices by increasing production as a way of increasing profits. The upward sloping supply curve is the graphical representation of the law of supply.. 22.
(23) Chapter 3 Methodology 1. Market Structure Use the Herfindahl Index. In economics there is a ratio that indicates the relative size of firms in relation to their industry as a whole. Concentration ratios have often been used to gauge the amount of competition in an industry, low concentration ratio in an industry would indicate greater competition among the firms in that industry than one with a ratio nearing 100%, which would be evident in an industry characterized by a true monopoly. The concentration ratio indicates whether an industry is comprised of a few large firms or many small firms. The four-firm concentration ratio, which consists of the market share (expressed as a percentage) of the four largest firms in an industry, is a commonly used concentration ratio. But there are two major problems of concentration ratio, first, concentration ratio do not address the issue of foreign competition, second, four-firm concentration ratio can remain stable over time even though there is competition among the four major firms in the industry. In 1982, the Justice Department replaced the four-firm and eight-firm concentration ratio with The Herfindahl index, another indicator of firm size, has a fair amount of correlation to the concentration ratio, although it too is subject to some of the same criticisms as the concentration ratios. The Herfindahl index measures the degree of concentration in an industry. It is equal to the sum of the squares of the market shares of each firm in the industry.. 𝐻𝐻. 𝑆1. 𝑆. 𝑆3. 23. ⋯. 𝑆𝑛.
(24) Where S1 through Sn are the market shares of firms 1 through n. For example, if there are 10 firms in an industry and each firm has a 10 percent market share, the Herfindahl index is 1000, comes from 102+102+102+102+102+102+102+102+102+102 =1000. The closer a market is to being a monopoly, the higher the market's concentration (and the lower its competition). The U.S. Department of Justice considers a market with a result of less than 1,000 to be a competitive marketplace; a result of 1,000-1,800 to be a moderately concentrated marketplace; and a result of 1,800 or greater to be a highly concentrated marketplace.. . When the HHI value is less than 100, the market is highly competitive.. . When the HHI value is between 100 and 1000, the market is said to be not concentrated.. . When the HHI value is between 1000 and 1800, the market is said to be moderately concentrated.. . When the HHI value is above 1800, the market is said to be highly concentrated.. Antitrust actions are usually brought by Justice Department if the index rises by 100 points or more and the (premerger) index is initially in the 1000 to 1800 category or the index rises by 50 points or more and the (premerger) index is initially in the greater than 1800 category. To illustrate, suppose two firms, A and B, want to merge. The market share of firm A is 20 percent and the market share of firm B is 10 percent. In other words, together these firms account for 30 percent of the market. We assume there are 7 other firms in the industry and each has a 10 percent market share. The Herfindahl index in this industry is 1200, from 202+102+102+102+102+102+102+102+102 = 1200. 24.
(25) Firms. Market Share. A. 15%. B. 12%. C. 11%. D. 10%. E. 8%. F. 7%. G. 7%. H. 6%. I. 6%. J. 6%. K. 6%. L. 6%. (1 ). (1 ). Old method: four firm concentration ration 1 %. 1 %. 11%. 1 %. %. New method: Herfindahl index Square the market share of each firm and then add:. (11) (6). (1 ). ( ). ( ). ( ). (6). (6). (6). (6). 3. If the merger is approved, there will be 8, not 9, firms. Moreover, the market share of the merged firm (A and B now from one firm) will be 30 percent. The Herfindahl index after the merger will be 1600. In other words, there will be an increase of 400 points if the firms merge. The advantage of the Herfindahl index over the four-firm and eight-firm concentration ratios is that it provides information about the dispersion of firm size in an industry. For example, the Herfindahl index will distinguish between these two situations, first is 4 firms together have a 50 percent market share and there are only 4 other firms in the industry, and second is 4 firms together have a 50 percent market 25.
(26) share and there are 150 other firms in the industry. The Herfindahl index and the four-firm and eight-firm concentration ratios have been criticized for implicitly from firm size to market power. Both assume that firms that have large market shares have market power that they are likely to be abusing.. 2. Price Leadership Theory. When a firm that is the leader in its sector determines the price of goods or services. Price leadership can leave the leader's rivals with little choice but to follow its lead and match these prices if they are to hold onto their market share. The firms in the oligopolistic industry (without any formal agreement) accept the price set by the leading firm in the industry and move their prices in line with the prices of the leader firm. The acceptance of price set by the price leader firm maximizes the total profits of each firm in the oligopolistic industry. The basic story in this model is that the dominant firm leaves room for the competitive fringe and therefore profit maximizes according to the “residual” demand curve. Since the fringe of firms behaves like perfect competitors, the sum of their marginal cost curves is essentially their supply curve. It represents the amount that these firms together will want to supply at any possible price. A microeconomic law that states, all other factors being equal, as the price of a good or service increases, consumer demand for the good or service will decrease, and vice versa. The law of demand says that the higher the price, the lower the quantity demanded, because consumers’ opportunity cost to acquire that good or service increases, and they must make more tradeoffs to acquire the more expensive product. Law of demand explains consumer choice behavior when the price changes. 26.
(27) In the market, assuming other factors affecting demand being constant, when the price of a good rises, it leads to a fall in the demand of that good. This is the natural consumer choice behavior. This happens because a consumer hesitates to spend more for the good with the fear of going out of cash. Raymond Deneckere and Dan Kovenock (1992) gave a game theoretic foundation of Forchheimer’s model (1908) of dominant firm price leadership in the framework of a capacity constrained Bertrand Edge worth duopoly. According to Forchheimer’s model we have one large firm and many small firms in the market. The large firm is assumed to set the price in the market, while the small firms act as price takers. The traditional industrial organization literature is very fond of the dominant firm model of price leadership. In this model it is generally assumed that there is one large producer and many small producers, no one of which produces a high enough output to affect price. According to Scherer in 1970, dominant firm price leadership occurs when an industry consists of one firm dominant in the customary sense of the word, controlling at least 50% of total industry output, plus a competitive fringe of firms, each too small to exert a perceptible influence on price through its individual output decisions. With firms in the fringe acting as price takers, the dominant firm is left as the only agent able to set price, and does so by maximizing profit subject to its residual demand curve. It thus, by necessity becomes a price leader. Markham (1951) in his seminal paper concluded on the one hand that price leadership in a dominant firm market is not simply a modus operandi designed to circumvent price competition but is instead an inevitable consequence of the industry’s structure. While on the other hand he stated that in a large number of industries, which do not contain a partial monopolist, the price leader is frequently but not always the largest firm. 27.
(28) Stigler (1947) in his paper, The Kinky Oligopoly Demand Curve and Rigid Prices attaches major important to the dominant firm model of price leadership. Stigler separates into two types of price leadership, dominant firm price leadership and barometric price leadership. In the former a dominant firm sets the price, allow the minor firms to sell what they wish at this price, and supplies the remainder of the quantity demanded. Oxenfeldt (1951) stated it when argued, price leadership probably works best and arises most frequently in industries in which a single firm is outstanding by virtue of large size or recognized high quality of management. (Rotemberg and Saloner, 1986) The existence of a large firm facilitates price leadership in several ways, first, a large firm’s price policy exerts a great influence on the sale of its smaller rivals, and consequently the large firm must consider the probable responses of its rivals before setting its own price. In effect, the large firm must think in terms of a price policy for the entire industry. As indicated above, the notion of price leadership emerges when an enterprise in a market can dictate its price to the other enterprises in the market. (It must be clear, however, that the following enterprises accept the dominant enterprise's price because they believe that it is the best thing to do.) In particular, it was indicated that price leadership emerges in markets when a dominant enterprise appears.. 28.
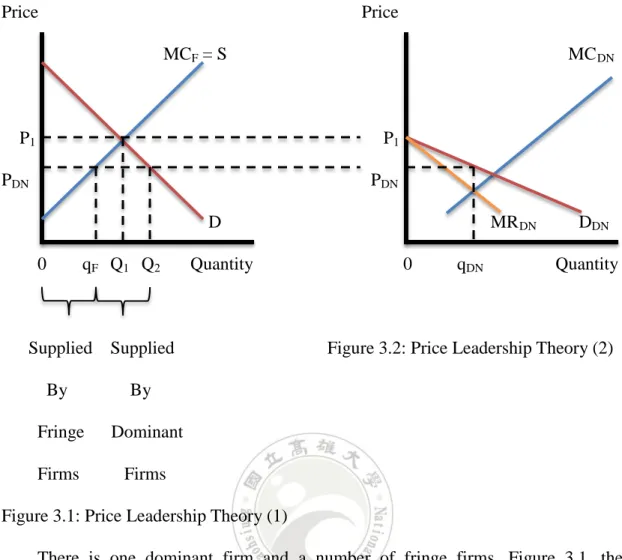
(29) Price. Price MCF = S. MC DN. P1. P1. PDN. PDN D 0. qF Q1 Q2. MR DN. Quantity. 0. Supplied Supplied By. qDN. DDN Quantity. Figure 3.2: Price Leadership Theory (2). By. Fringe. Dominant. Firms. Firms. Figure 3.1: Price Leadership Theory (1) There is one dominant firm and a number of fringe firms. Figure 3.1, the horizontal sum of the marginal cost curves of the fringe firms is their supply curve. At P1, the fringe firms supply the entire market. In short, P1 and Q1 define the situation in the industry or market excludes the dominant firm. Figure 3.2, the dominant firm derives its demand curve by computing the difference between market demand, D, and MCF at each price below P1. It then produces the quantity of output at which its marginal revenue equals its marginal cost, this level is qDN (where MRDN = MCDN) and charges the highest price for this quantity of output, which is PDN. PDN becomes the price that the dominant firm sets and the fringe firms take. They equate price and marginal cost and produce qF in Figure 3.1. The remainder of the output produced by the industry, the difference between Q2 and qF, is produced by the dominant firm. (Roger Arnold, 2005) 29.
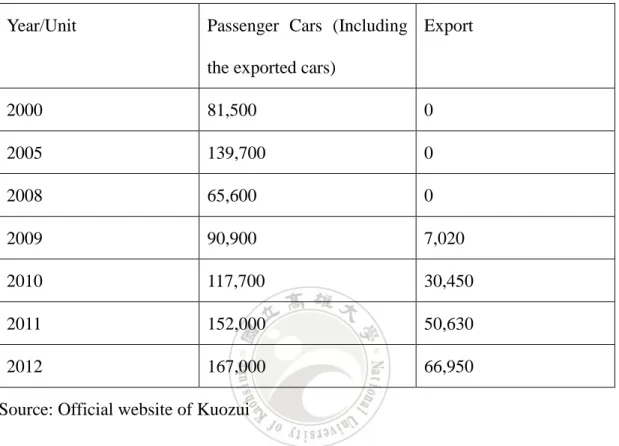
(30) Chapter 4 Major Findings 1. Current Car Producers in Taiwan. The automobile industry has been a representation of many nations’ manufacturing industry. The number of consumers who owns a vehicle is a common indicator of the national economic level. 2012 global automobile market total sales amount is about 84,100,167 units, compared to the previous year of growth, it is more than 5.1%; summarize, the majority of the country's automobile market scenery close, but the European automobile market due to the European debt crisis and faltering. In the global ranking, 19,271,808 units in China's automobile market sales champion, followed by the U.S. 10,328,884 units, the third is Japan 9,942,771 units.. In Taiwan, there are now seven automobile firms, named Kuozui Motors, Ford Lio Ho Motor Company, China Motor Corporation, Yulon Motors, Sanyang Industry Company, Honda Motor Company and Formosa automobile corporation, Formosa, which is totally manufacture the trucks, it does not fit our study’s need, so we will only introduce the others, expect Formosa.. Kuozui In early 1984, Toyota, Hino and Hotai, joint venture with China Development Trust, established Kuozui Motors, Ltd, and Toyota and Hino has 56.6% of the shares. Under the expectations of the country's economic development, Kuozui Motors started to produce locally cars. ome of Toyota’s cars manufactured by. uozui like CAMRY,. CAMRY HYBRID, COROLLA ALTIS, WISH, VIOS, YARIS, and INNOVA. And some. 30.
(31) of. ino’s also manufactured by. uozui, such as. INO small / medium / large truck,. bus. In 2009, started to export to Middle East country. Table 4.1: The Units of Passenger Cars Year/Unit. Passenger Cars (Including Export the exported cars). 2000. 81,500. 0. 2005. 139,700. 0. 2008. 65,600. 0. 2009. 90,900. 7,020. 2010. 117,700. 30,450. 2011. 152,000. 50,630. 2012. 167,000. 66,950. Source: Official website of Kuozui. Ford Lio Ho Taiwanese car firm named Lio Ho signed the contract with Ford of joint venture on November 20, 1972. And, founded the Ford Lio Ho Motor Company on December 1 in the same year, and Ford has 70% of the shares. In 1973, Ford Lio Ho promoted the first locally made car called Cortina, after that here comes the Fiera the second, now there are three types of locally made passenger car, one is FOCUS, another is MONDEO, the third is FIESTA. Besides, the first one Taiwanese car manufacturer got the certification of ISO9001 in 1996. Ford, the experienced car manufacturer, now owns the fifth market share in the world, with 3,123,340 units in 2012. Mazda Motor Corporation they have arrangement with Ford sine 1979, at that time Ford had 25% 31.
(32) shares of Mazda, now so there are two kinds of cars locally made by Ford Lio Ho, one is MAZDA 3, and the other is MAZDA 5.. China Motor Corporation CMC (China Motor Corporation) was founded in June of 1969 and signed a technical collaboration with Mitsubishi Motors Corporation in the following year, and Mitsubishi Motors Corporation has 22.8% of shares, now there are four types locally made cars, one is COLT, another is LANCER FORTIS, other is SAVIN, the last is OUTLANDER. In 1993, the company garnered both ISO 9002 certification and the National Quality Award of Taiwan. In 1997, the company also obtained ISO 14001 Environmental Management certification.. Sanyang Industry Company Sanyang Industry Co., Ltd., founded in 1954, is the sole international enterprise in Taiwan that manufactures both motorcycles and automobiles. In the automobile business, Sanyang allies with Hyundai and successfully makes it a household auto brand in Taiwan, there are three kinds if cars locally made, one is I30, another is ELANTRA, and the other is yundai products through. ANTA.. trengthening. yundai’s brand, selling. anyang’s marketing channels and providing. yundai. worldwide with great quality components and parts have made Sanyang an important partner to Hyundai in its global strategy.. Honda Motor Company In October 1946, Soichiro Honda established the Honda Technical Research Institute in Hamamatsu, Japan, to develop and produce small 2-cycle motorbike 32.
(33) engines. Two years later, Honda Motor Company, Ltd. was born, and in 2002 established the Honda Motor Company in Taiwan, and was divided to Taiwan Honda Motor Company Ltd. There are three types of locally made cars by Honda, one is ACCORD, another is CIVIC, and the last is FIT. It is a foreign direct investment company of Japan, auto parts was imported from Japan either.. Yulon Mr. Ching-Ling Yen established the company on September 10, 1953; in the beginning YULON was named YULON Machinery Co., Ltd. While the first Yulon model was a 1956 jeep, with engine production beginning in September 1956, passenger car assembly only started in 1960 with the Bluebird after an agreement with Nissan was signed in 1957. The first Taiwanese auto brand, Luxgen, was created by Yulon in 2008. Yulon's second brand, Tobe, was established in 2009.. Table 4.2: The Taiwanese Automobile Industry for New Car Year. 2004. 2005. 2006. 2007. 2008. Automobile industry 219.7. 230.9. 160.1. 145.1. 101.6. Growth rate. 12.3%. 5.1%. -30.7%. -9.4%. -30%. Year. 2009. 2010. 2011. 2012. ‘13/1-6. Automobile industry 118.5. 164.9. 192.8. 189.4. 90.6. Growth rate. 39.2%. 16.9%. -1.8%. -10.3%. 16.6%. Unit: Billion Source: Taiwan Transportation Vehicle Manufacturers Association. 33.
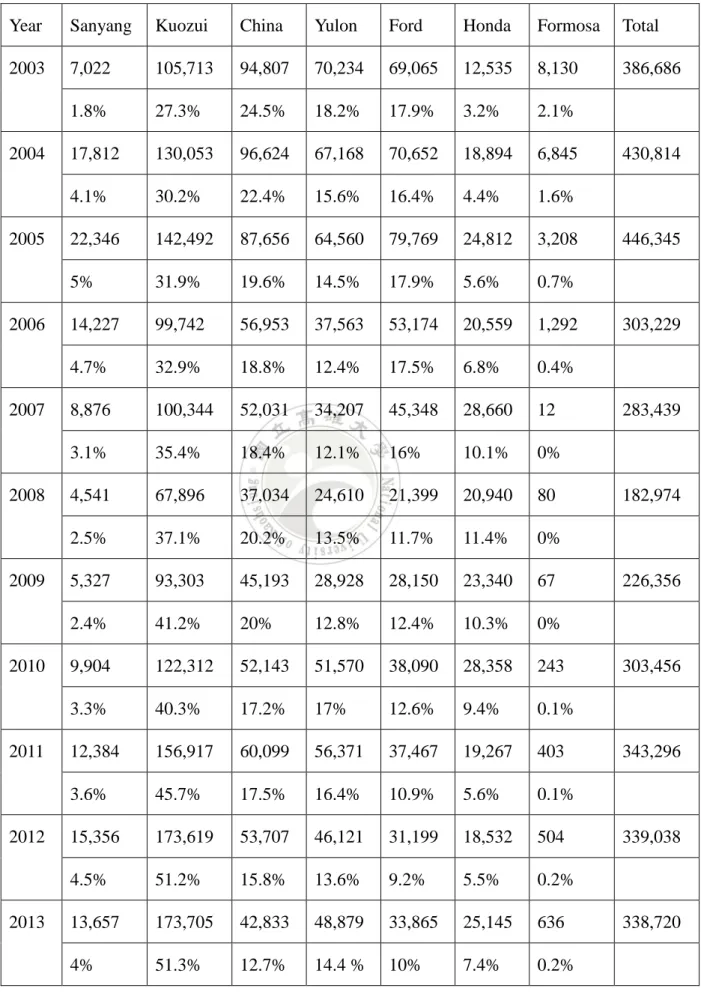
(34) Table 4.3: The Units of Production and the percentage for Each Automobile Firm Year. Sanyang. Kuozui. China. Yulon. Ford. Honda. Formosa. Total. 2003. 7,022. 105,713. 94,807. 70,234. 69,065. 12,535. 8,130. 386,686. 1.8%. 27.3%. 24.5%. 18.2%. 17.9%. 3.2%. 2.1%. 17,812. 130,053. 96,624. 67,168. 70,652. 18,894. 6,845. 4.1%. 30.2%. 22.4%. 15.6%. 16.4%. 4.4%. 1.6%. 22,346. 142,492. 87,656. 64,560. 79,769. 24,812. 3,208. 5%. 31.9%. 19.6%. 14.5%. 17.9%. 5.6%. 0.7%. 14,227. 99,742. 56,953. 37,563. 53,174. 20,559. 1,292. 4.7%. 32.9%. 18.8%. 12.4%. 17.5%. 6.8%. 0.4%. 8,876. 100,344. 52,031. 34,207. 45,348. 28,660. 12. 3.1%. 35.4%. 18.4%. 12.1%. 16%. 10.1%. 0%. 4,541. 67,896. 37,034. 24,610. 21,399. 20,940. 80. 2.5%. 37.1%. 20.2%. 13.5%. 11.7%. 11.4%. 0%. 5,327. 93,303. 45,193. 28,928. 28,150. 23,340. 67. 2.4%. 41.2%. 20%. 12.8%. 12.4%. 10.3%. 0%. 9,904. 122,312. 52,143. 51,570. 38,090. 28,358. 243. 3.3%. 40.3%. 17.2%. 17%. 12.6%. 9.4%. 0.1%. 12,384. 156,917. 60,099. 56,371. 37,467. 19,267. 403. 3.6%. 45.7%. 17.5%. 16.4%. 10.9%. 5.6%. 0.1%. 15,356. 173,619. 53,707. 46,121. 31,199. 18,532. 504. 4.5%. 51.2%. 15.8%. 13.6%. 9.2%. 5.5%. 0.2%. 13,657. 173,705. 42,833. 48,879. 33,865. 25,145. 636. 4%. 51.3%. 12.7%. 14.4 %. 10%. 7.4%. 0.2%. 2004. 2005. 2006. 2007. 2008. 2009. 2010. 2011. 2012. 2013. 34. 430,814. 446,345. 303,229. 283,439. 182,974. 226,356. 303,456. 343,296. 339,038. 338,720.
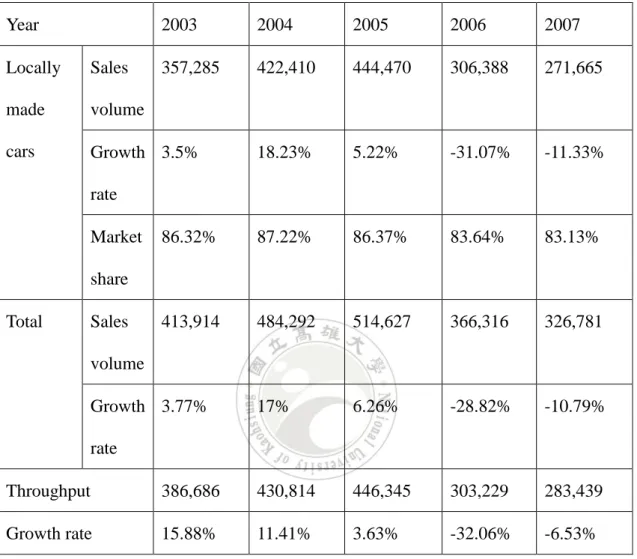
(35) Source: Taiwan Transportation Vehicle Manufacturers Association. Table 4.4: The Units of Taiwanese Locally Made Car (1) Year. 2003. 2004. 2005. 2006. 2007. 357,285. 422,410. 444,470. 306,388. 271,665. 18.23%. 5.22%. -31.07%. -11.33%. 86.32%. 87.22%. 86.37%. 83.64%. 83.13%. 413,914. 484,292. 514,627. 366,316. 326,781. 17%. 6.26%. -28.82%. -10.79%. Locally. Sales. made. volume. cars. Growth 3.5% rate Market share. Total. Sales volume. Growth 3.77% rate Throughput. 386,686. 430,814. 446,345. 303,229. 283,439. Growth rate. 15.88%. 11.41%. 3.63%. -32.06%. -6.53%. Source: Taiwan Transportation Vehicle Manufacturers Association. Formosa Automobile Corporation Formosa Automobile Co., Ltd. was set up in 1988 on November 11, the company set up for the Formosa Plastics Group, the main operating items for the wholesale and retail automotive, motorcycle parts with wholesale and retail, auto repair and inspection of large and small vehicles on behalf of other related business. Nowadays Formosa Automobile Corporation only produces the trucks.. 35.
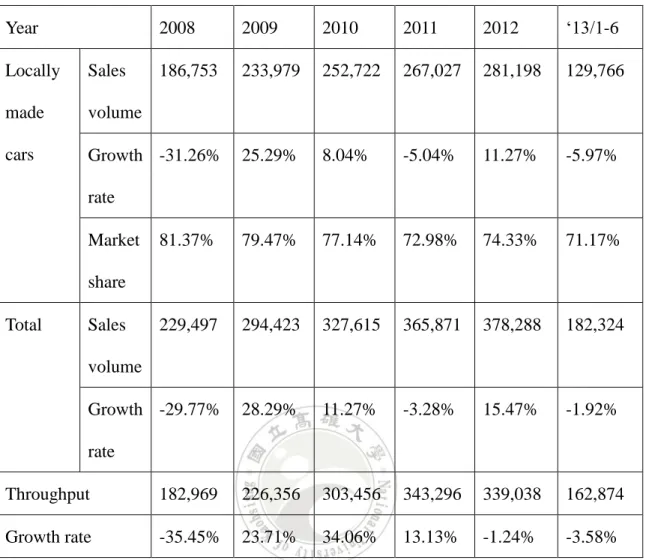
(36) Table 4.5: The Units of Taiwanese Locally Made Car (2) 2008. 2009. 2010. 2011. 2012. ‘13/1-6. 186,753. 233,979. 252,722. 267,027. 281,198. 129,766. 25.29%. 8.04%. -5.04%. 11.27%. -5.97%. 81.37%. 79.47%. 77.14%. 72.98%. 74.33%. 71.17%. 229,497. 294,423. 327,615. 365,871. 378,288. 182,324. Growth -29.77%. 28.29%. 11.27%. -3.28%. 15.47%. -1.92%. Year Locally. Sales. made. volume. cars. Growth -31.26% rate Market share. Total. Sales volume. rate Throughput. 182,969. 226,356. 303,456. 343,296. 339,038. 162,874. Growth rate. -35.45%. 23.71%. 34.06%. 13.13%. -1.24%. -3.58%. Source: Taiwan Transportation Vehicle Manufacturers Association. 2. Evaluate Concentration Ratios of Car Productive. We take the year of 2013 of each automobile firm market share as sample; due to Formosa Automobile Corporation does not produce 2000cc passenger car, which is not related to our study, so we do not calculate as Herfindahl Index.. 𝐻𝐻. 𝑆1. 𝑆. 𝑆3. ⋯. Kuozui Motors market share. 𝑆𝑛. 1. % 36.
(37) Ford Lio Ho Motor Company market share. 1 6 %. China Motor Corporation market share 1. Yulon Motors market share. 1 %. 3% 3%. Sanyang Industry Company market share. %. Honda Motor Company market share. 𝐻𝐻. ( 1. ) 6. (1 ) 6. 1. (1 6 ) 16. (1. 3). ( 16. 3). (. ). 6. ≈ 316 . When the HHI value is less than 100, the market is highly competitive.. . When the HHI value is between 100 and 1000, the market is said to be not concentrated.. . When the HHI value is between 1000 and 1800, the market is said to be moderately concentrated.. . When the HHI value is above 1800, the market is said to be highly concentrated.. According to the 𝐻𝐻. 316 , it means the Taiwan automobile industry is. highly concentrated, which pointed that the market without competitive. The advantage of the Herfindahl index is that it provides information about the dispersion of firm size in an industry. The Herfindahl index and the four-firm and eight-firm concentration ratios have been criticized for implicitly from firm size to market power. Both assume that firms that have large market shares have market power that they are likely to be abusing. The closer a market is to being a monopoly, the higher the market's concentration.. 37.
(38) 3. Assume Pricing Issue. The post-Keynesians (Aichner, 1976, Harcourt and Kenyon, 1976, and Wood, 1975), who linked price setting behavior with investment behavior or economic growth. However, as Yamamoto (1988) analyzed their characteristics and limits in detail, these theories have many problems. As a reason why the oligopoly industry adopts the full-cost principle, Eckstin and Fromm (1968) indicated that it is particularly suitable for price leadership. That is to say, the full-cost principle is the determining method for pricing by raising the price by a value equal to cost increase multiplied by a percentage which the entrepreneur wants to set as a target. This principle provides the mechanical calculation method in price setting, and at the same time is able to judge easily cost conditions of the marginal producer. Therefore, Bain (1968) mentioned that when every company adopts the full-cost principle as the common accounting system, and if the common cost factor among company’s changes by the same degree, a parallel price increases becomes feasible. The leader can either use his costs, or apply a standard costing procedure, which provides an umbrella for higher cost producers (Eckstin and Fromm, 1968) For example, the price of Toyota Camry 2.0E is NT849000, in price leadership model it is generally assumed that there is one large producer that would be Kuozui and many small producers, no one of which produces a high enough output to affect price. The large firm is assumed to set the price in the market, while the small firms act as price takers, Kuozui become the dominant firm, which is assumed to set the price, then other small firms will set their price around firm in automobile industry can be seen in Table 4.6.. 38. uozui’s. The price of each.
(39) Table 4.6: The Price of 2000cc Model of Each Automobile Firm Toyota. Ford. Ford. China. Yulon. Yulon. Honda. Camry. Focus4. Mondeo. Motor. Nissan. Luxgen. Civic. Classic. Lancer. Teana. S5 Turbo. 849,000 799,000 999,000. 809,000 849,000. 646,000 879,000. Focus5. Mondeo. Teana. Classic. Luxury. Navigation Turbo. 729,000 1099,000. 899,000. Focus5. Mondeo. Teana. Sport. Sport. Flagship. Flagship 759,000 1190,000 Focus5. Mondeo. Diesel. Diesel. 935,000. Classic 899,000 960,000 Mondeo Diesel Luxury 1059,000 Unit: NT Dollar Source: The official website of each firm. 39. U6. CR-V. 729,000 859,000.
(40) 4. Evaluate Luxury Tax. Industrial policy making in Taiwan has been susceptible to societal pressures and mass media. During the slow development of the automobile industry, domestic public opinion has become increasingly impatient with the high price of automobiles. As small passenger cars came increasingly within the reach of more and more of the urban middle class, the tariff policy on imported cars became more politicized. Under public pressure, the government reduced the tariffs from 65% to 42.5% between 1985 and 1988, which boosted the sale of imported cars. This policy of reducing tariffs has continued until today because the pressure still exists, but its sources has shifted to some trade partners demanding free trade. The Taiwanese government has not protected its automobile industry as it promised. This has made the manufactures lose confidence toward government and become more near sighted, pursuing immediate profits rather than looking at long run development. In contrast, the Korean government adopted a consistent long-term policy by first banning imports, second, limiting foreign ownership of domestic firms, and third helping to obtain the necessary technology through licensing. Its industry received a lot of support in the form of easy lines of credit, favorable tax treatments, and assistance in exporting. Therefore, the Korean firms were more ambitious about future development because of their confidence in their government. In the WTO accession package negotiated with Taiwan, it was agreed that the local content rule would be eliminated entirely starting from this year and that tariffs would undergo a gradual reduction. From the 30% level that had been maintained for the previous decade, duties on imported autos brought in under a quota system were 40.
(41) cut this year to 29% and will continue to drop in annual increments until they reach 17.5% in 2010. For vehicles of more than 3.5 tons (trucks and buses), the duty rate will decline from the current 37% to 25% in 2008. "This level of tariffs should be sufficient to provide balance -- low enough to encourage market opening but at the same time allowing our local industry to maintain its competitiveness," says the IDB's Wu Chih-kwei. One more element of the WTO accession program involved an adjustment of Taiwan's commodity tax on automobiles, which had been especially high for larger cars as a means not only of generating revenue but also of discouraging traffic congestion and fuel consumption. Under the WTO regime, the commodity tax for all cars with engines of 2-liters and above will decrease to 30% by 2007. The rate is currently 60% for engines of 3.6 liters or more, and 35% for the 2 to 3.6 liter bracket. (The tax for cars with engines below 2 liters remains unchanged at 25%). The Ministry of Finance said the “luxury tax”, more detailed called “The pecifically elected Goods and. ervices Tax”, a specifically selected goods and. services tax shall be imposed, in accordance with the provisions of this act, on the sale, manufacture, and import of specifically selected goods or the sale of specifically selected services within the territory of the Republic of China, any passenger car that including the driver’s seat, has nine seats or less and a selling price or taxable value of not less than NT$3 million, and the tax rate for the specifically selected goods and services tax is 10 percent, that was implemented on June 1 of 2011. It has helped slow both speculative transactions and unreasonably high housing prices in the real-estate market. The luxury tax is the main cause of the slowdown in sales, the dealer said, which has on average added around NT$300,000 (US$10,000) to the price of each car. 41.
(42) 5. Upgrade Technology Issue. The importance of information technology is well recognized in the automotive industry. Since the nature of the automotive supply chain is relative easy to implement Electronic Data Interchange (EDI), Big Three automobile manufacturers have strongly encouraged their first-tier suppliers to communicate with them through EDI since the end of 1997. Since Internet provides many cost effective solutions such as EOI (EDI over Internet), it is possible nowadays to extend this B2B (Business-to-Business) relationship from the first-tier suppliers to their suppliers. Based on the information on web sites, it is known that GM now runs a global network named EDSNET linking more than 30 GM data processing centers with over 2,000 suppliers via EDI. Ford uses a private telecommunication network named Ford Net for establishing EDI connections with its suppliers, and has built up an on-line website, www.fordvehicles.com, to provide build-to-order function that gives customers flexible combination of their needs. The Greek word ‘hybrid’ means made from combining different varieties or resulting from cross breeding. A hybrid car is an automobile that has two or more major sources of propulsion power. Most hybrid cars currently marketed to consumers have both conventional gasoline and electric motors, with the ability to power the vehicle by either one independently or in tandem. These vehicles are appropriately termed gas-electric hybrids. Other power sources may include hydrogen, propane, CNG, and solar energy. The technology used depends on the goals set for the vehicle, whether they be fuel. 42.
(43) efficiency, power, driving range, or reduced greenhouse gas emissions. Consumer oriented hybrid cars, which have been on the market for about ten years, are usually tuned for reduced emissions and driving range. Additionally, owners of hybrid vehicles often enjoy social benefits such as prestige and discounted secondary services. A gasoline-electric hybrid car has one or two auxiliary electric motors that supplement the main gasoline engine. Compared to conventional automobiles, the gasoline engine in a gas-electric hybrid is smaller, less powerful, and more efficient. Although the gasoline engine alone would be sufficient to power the vehicle under most circumstances, during maneuvers requiring unusually high power the electric motor is used as well. These conditions include passing, hill climbing, and acceleration from a standstill. Some hybrid cars, such as the Toyota Prius, shut down the gasoline engine under conditions in which the electric motor alone would suffice, such as coasting and breaking. In fact, the Toyota Prius has a special electric-only mode designed for stop-and-go traffic. This is made possible by the super heavy-duty electric motor used in the Prius, which is capable of propelling the vehicle from a standstill without the gasoline assist. Thus, in contrast to most other hybrid vehicles, the Prius actually uses the electric motor more than the gasoline engine. Hybrid car companies like Toyota, Honda, Ford and BMW have pulled together to create a movement of Hybrid vehicle sales pushed by Washington lobbyist to lower the worlds emissions and become less reliant on our petroleum consumption. Toyota Motor Corporation (TMC) announced that as of the end of June in 2013, worldwide cumulative sales of the Prius gasoline-electric hybrid vehicle (generations I, II and III) passed the 3-million mark. (Figure 4.7 is based on worldwide cumulative 43.
(44) sales through the end of May 2013 plus June sales in the US.) Total global Prius nameplate sales (the expanded Prius family) are at 3.436 million units. Since the development of the first-generation Prius, TMC has positioned hybrid technology as a core. technology. required. for. the. development. of. various. types. of. environment-friendly vehicles and has placed emphasis on the development and production of core components such as motors, inverters, batteries and electronic control units (ECUs), giving rise to substantial investment in Japan. Table 4.7: Cumulative Prius Sales Model. Cumulative sales (1000s). Production Status. Model 1. 123. Ended Aug 2003. Model 2. 1,192. Ended Dec 2011. Model 3. 1,688. On-going. Total Prius. 3,002. Prius +/Alpha/v. 322. On-going. Prius PHV. 35. On-going. Prius c. 75. On-going. Total nameplate. 3,436. Source: Toyota Europe News 2013-07-03. 44.
(45) The Toyota Camry is a mid-size car that was produced by Toyota from 2006 to 2011. Known as the "Toyota Camry Hybrid", the gasoline–electric model premiered in January 2006—alongside the non-hybrid car. This latest Toyota Camry Hybrid was redesigned for 2012, as was the conventional Camry. As such, it benefited from the same generational upgrades, such as a much nicer interior and new electronics features. Fuel economy and power are also considerably better than they were with the previous-generation hybrid. Note that these Camry Hybrids lack a few minor updates of the current version, including the addition of the SE Limited Edition trim level, the rearview camera becoming standard across the board and a renaming of the car's infotainment systems. Many of the technologies found in hybrid vehicles would benefit vehicles of any type, including conventional gasoline automobiles. However, the engineering and manufacturing costs associated with these technologies often would increase the price of the vehicle to the point where the fuel savings are negligible in comparison. Only in tax-subsidized electric and hybrid vehicles are these technologies practical, in which associated cost increases are absorbed by the government instead of the manufacturer or consumer. These technologies include regenerative braking, aerodynamic refinements, and lightweight building materials. Hybrid vehicle emissions today are getting close to or even lower than the recommended level set by the EPA (Environmental Protection Agency). The recommended levels they suggest for a typical passenger vehicle should be equated to 5.5 metric tons of carbon dioxide. The three most popular hybrid vehicles, Honda Civic, Honda Insight and Toyota Prius, set the standards even higher by producing 4.1, 3.5, and 3.5 tons showing a major improvement in carbon dioxide emissions. Hybrid vehicles can reduce air emissions of smog-forming pollutants by up to 90% and cut 45.
(46) carbon dioxide emissions in half. Temma Ehrenfeld (2008) explained in an article by Newsweek. Hybrids may be more efficient than many other gasoline motors as far as gasoline consumption is concerned but as far as being green and good for the environment is completely inaccurate. Hybrid car companies have a long time to go if they expect to really go green. According to Harvard business professor Theodore Levitt states "managing products" and "meeting customers' needs", "you must adapt to consumer expectations and anticipation of future desires.. 46.
(47) Chapter 5 Concluding Remarks 1. Major Findings. The Taiwan automobile manufacturers depend too much on Japanese firms, which are the main corporation partners for providing technical support. Of all the current six manufacturers, expect for the corporation between Ford, United States, and Sanyang with Hyundai, Korea, the rest of these firms are in some degree of corporation or joint venture with Japanese firms. As for the foreign technical corporation partners for parts and component suppliers, most of these firms are also Japanese firms. This has weakened the Taiwanese manufacture’s incentives to spend more on Research and Development with hope to build their own technology. It also has significant effects on the costs of Taiwan made cars whose major parts and components are imported from Japan. Automobile industry is a very competitive industry; the characteristics in Taiwan enable the total costs of the supply chains are lower compared to other countries. However, most of the managers are still eager to looking for the opportunities to improve their values and to reduce their costs in the same time. As increase in personal income, there will be increased demand for new car; in economics there is a ratio that indicates the relative size of firms in relation to their industry as a whole. Concentration ratios have been often used to see whether the industry has competition or not, in Taiwan automobile industry the concentration ratio is high that would indicate lesser competition among the firms. After, comes from the Herfindhal index to indicate the firm size, the greater the firm size is, the bigger the 47.
(48) market power. The large firm of Kuozui in automobile industry becomes the dominant firm, which set the price as leader, then other five small firms as price taker. Due to join the WTO, it was agreed that local content rules would be eliminates entirely, and the Taiwanese government has not protected its automobile industry as it promised, this cause lots of manufacturers lose confidence toward government, and become near sighted than looking at a long run development. Nowadays, the growing importance of information technology becomes the main of Research and Development; with information technology Taiwanese automobile manufacturers start to reverse the situation, the awareness of Research and Development in Taiwanese automobile industry, each firm has strongly inputted a lot of resources doing this field.. 2. Suggestions. Electro mobility will be a central part of future powertrain design across both developed and emerging markets, with great potential in the BRICs and especially in China. The biggest challenge will be to identify the most promising technology. According to the survey, fuel cell technology has not yet realized its full potential, although Daimler, Hyundai/Kia, Toyota and GM are already very active in this area. The industry has to move from vehicle-oriented to human-oriented urban design and mobility concepts. Among the more progressive OEMs are Volkswagen with its. 48.
(49) car-sharing concept Quicar and the Audi Urban Future Initiative. BMW also combines car sharing and urban design with Drive Now and its sub-brand BMWi. Manufacturers cannot manage everything alone. Many advances in technology and services have flowed from other industries. For example, the mobility services concept is very different from the traditional OEM model. Collaboration is the obvious way to manage such change and brings a number of additional benefits, including joint R&D spending, access to new technologies and products, new business models and the potential to pool risk and investments.. 3. Future Study. PMG’s 2012 global survey shows that the automotive industry continues to face environmental challenges, growing urbanization and shifting customer behavior, which calls for radical new approaches to future mobility. And these issues are becoming universal; with three quarters (75 percent) of respondents believing that emerging and mature markets will converge by 2025. The analysis of car demand evolution offers rich information on economic development, consumer habits, life-style, and policy impacts in a given economy. Spain is a latecomer among the highly motorized societies where policy incentives and public infrastructure investments played a prominent role in developing the automobile market. The structure of the car demand in Spain experiences fundamental. 49.
(50) changes, which from a mixture of long-term trends and the impact of the economic crisis since 2008. The concept of a two-tier global industry is rapidly becoming redundant. The vast majority of respondents believe that by 2025, the emerging and mature markets will converge in terms of customer requirements for quality, safety, and reliability, as well as for vehicle segment shares between low-cost and premium. This study, which will be investigated in more detail in future research, may provide the basis for a model of demand for cars.. 50.
(51) References 1.. Bucks, Brian K., Kennickell, Arthur B., Mach, Traci L. and Moore, Kevin B., 2009, Changes in U.S. Family Finances from 2004 to 2007: Evidence from the Survey of Consumer Finances, Federal Reserve Bulletin, vol. 95, A1-A55.. 2.. Chamon, M., P. Mauro and Y. Okawa, 2008, Cars, International Monetary Fund.. 3.. Chia-wen, C. (1995), Massachusetts Institute of Technology, Department of Technology and Policy.. 4.. Deneckere, R. and D. Kovenock, 1992, Price Leadership, Review of Economic Studies 59, 143-162.. 5.. Ehrenfeld, Temma. "Green, or Greenwash? Newsweek 14 July 2008: 56.. 6.. Fagerberg, J. (1994), Technology and international differences in growth rates. Journal of Economic Literature, Vol. 32, No.3, pp. 1147-1175.. 7.. Gregor Matvos, Chad Syverson and Sriram Venkataraman (2010), National Bureau of Economic Research, Working Paper 16197.. 8.. Heike Proff (2000), The International Journal of Management Science, Omega 28, pp. 541-553.. 9.. Holm-Detlev Köhler and José Pablo Calleja Jiménez, 2012, Atlantic Review of Economics 2.. 10. Jones, C.I. (1998), Introduction to economic growth. W.W. Norton & Company Ltd.. 51.
(52) 11. JrJung Lyu and Yi-Chen Lin (2003), International Journal of Electronic Business Management 1, No. 2, 85-90. 12. Matleena niivil (1998), Pellervo Economic Research Institute, elsinki, Finland. 13. Markham, J.W. (1951), The Nature and Significance of Price Leadership, American Economic Review 41, 891-905. 14. Momoko Kawakami (1995), 1995 Tokyo Automobile Industry Handbook. 15. Oxenfeldt, A. (1951), Industrial Pricing and Market Practices (Prentice-Hall, Inc., New York). 16. Roger, A. (2005), Principles of Economics. 17. Rotemberg, J. and G. Saloner (1986), Price Leadership, Massachusetts Institute of Technology, Department of Economics, Working Paper No.412. 18. Scherer, F. M. (1970), Industrial Market Structure and Economic Performance, First Edition. 19. Solow, R. (1956), A contribution to the theory of economic growth. Quart. J. Econ., vol. 70, No. 1, pp. 65-94. 20. Stigler, G (1947), The Kinky Oligopoly Demand Curve and Rigid Prices, Journal of Political Economy 55, 432-449. Reprinted in G. Stigler, The Organization of Industry (1983).. 52.
(53)
數據
+7

相關文件
Now, nearly all of the current flows through wire S since it has a much lower resistance than the light bulb. The light bulb does not glow because the current flowing through it
Courtesy: Ned Wright’s Cosmology Page Burles, Nolette & Turner, 1999?. Total Mass Density
This kind of algorithm has also been a powerful tool for solving many other optimization problems, including symmetric cone complementarity problems [15, 16, 20–22], symmetric
Warrants are an instrument which gives investors the right – but not the obligation – to buy or sell the underlying assets at a pre- set price on or before a specified date.
The packed comparison instructions compare the destination (second) operand to the source (first) oper- and to test for equality or greater than.. These instructions compare eight
• When a call is exercised, the holder pays the strike price in exchange for the stock.. • When a put is exercised, the holder receives from the writer the strike price in exchange
• When a call is exercised, the holder pays the strike price in exchange for the stock.. • When a put is exercised, the holder receives from the writer the strike price in exchange
專案執 行團隊
