Observation of a sequence of wetting transitions in the binary water
+ ethylene glycol monobutyl ether mixture
Chih-Kang Wu and Li-Jen Chena兲
Department of Chemical Engineering, National Taiwan University, Taipei, Taiwan 10617 Republic of China
共Received 20 May 2005; accepted 29 June 2005; published online 30 August 2005兲
A homemade pendant drop/bubble tensiometer was assembled and applied to perform the surface-interfacial tension measurements for the binary water+ ethylene glycol monobutyl ether 共C4E1兲 mixture over the temperature range from 50 to 128 °C at 10 bar. The symbol CiEjis the abbreviation of a nonionic polyoxyethylene alcohol CiH2i+1共OCH2CH2兲jOH. The wetting behavior of the C4E1-rich phase at the interface separating the gas and the aqueous phases was systematically examined according to the wetting coefficient calculated from the experimental results of surface/ interfacial tensions. It was found that the C4E1-rich phase exhibits a sequence of wetting transitions, nonwetting→partial wetting→complete wetting, at the gas-water interface in the water+C4E1 system along with increasing the temperature, consistent with the conjecture of Kahlweit and Busse 关J. Chem. Phys. 91, 1339 共1989兲兴. In addition, the relationship of the mutual solubility and the interfacial tension of the interface separating the C4E1-rich phase and the aqueous phase is discussed. © 2005 American Institute of Physics.关DOI:10.1063/1.2008235兴
I. INTRODUCTION
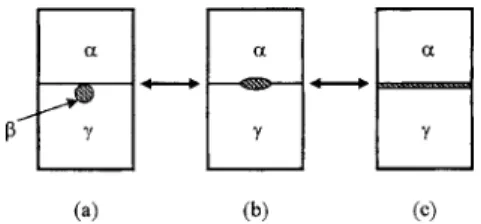
Consider three fluid phases,␣,, and␥, in equilibrium under gravity and the densities of these three phases are in the order␥⬎⬎␣. The wetting behavior of the middle phase can be easily realized by the wetting coefficient de-fined as W =共␣−␣␥兲/␥. The symbol ij stands for the interfacial tension of the interface separating i and j phases. Based on the wetting coefficient W, the wetting behavior of a small amount of thephase at the␣-␥interface can then be classified into three types, as illustrated in Fig. 1.
共a兲 W=1, a nonwetting  phase at the ␣-␥ interface, as shown in Fig. 1共a兲. In this case the Antonow’s rule1is applied in the form␣=␣␥+␥.
共b兲 1⬎W⬎−1, a partial wettingphase at the␣-␥ inter-face, as shown in Fig. 1共b兲. The relationship between interfacial tensions is ␣−␥⬍␣␥⬍␣+␥, which follows the Neumann’s inequality.2
共c兲 W=−1, a complete wetting  phase at the ␣-␥ inter-face, as shown in Fig. 1共c兲. In this case the tensions obey the Antonow’s rule,1␣+␥=␣␥.
The transition from a complete wetting共or nonwetting兲 regime to a partial wetting regime, or vice versa, is called a wetting transition. This remarkable interfacial phenomenon is the subject of intense current research3,4due to its impor-tance in many industrial applications.
The wetting behavior of the middle CiEj-rich phase at the oil-water interface in ternary water+ oil+ CiEj mixtures had been extensively and systematically studied.5–18 The symbol CiEjis the abbreviation of a nonionic polyoxyethyl-ene alcohol CiH2i+1共OCH2CH2兲jOH. It was found that these
ternary systems can exhibit diverse wetting behaviors by simply varying thermodynamic variables, such as temperature,5–12 oil chain length,13,15 amphiphilicity of an amphiphile,6–10 and salinity.17,18
The most intriguing phenomenon observed in the water + n-alkane共such as octane, decane, dodecane, or tetradecane兲 +C6E2 system12,13 was that the middle C6E2-rich phase would undergo a sequential wetting transition, nonwetting
→partial wetting→complete wetting, along with increasing
temperature. This observation verifies the suggestion that the wetting behavior can be related to the temperature depen-dence of the amphiphilicity of a surfactant.6These results are consistent with the critical-point wetting theory of Cahn19 and of Ebner and Saam.20
Although the binary water+ CiEj mixtures are relatively simpler than the ternary water+ oil+ CiEjmixtures, these sys-tems also exhibit the intriguing phenomena in wetting behav-ior. The wetting behavior of the water+ C8Ej mixtures at 298.15 K was carefully investigated by Kahlweit and Busse.6 These authors found that the contact angle of the sus-pended lens of the C8Ej-rich phase at the air-water interface increases with an increase in the number of oxyethylene groups j from 0 to 3 stepwise. Based on this
phenomenologi-a兲Author to whom correspondence should be addressed. Electronic mail: ljchen@ntu.edu.tw
FIG. 1. Wetting behavior at a fluid-fluid interface.共a兲 A nonwettingphase at␣-␥interface,共b兲 a partial wettingphase at␣-␥interface, and共c兲 a complete wettingphase at␣-␥interface. The expected condition for only a small amount of thephase at the␣-␥interface.
cal argument, Kahlweit and Busse6conjectured that it is pos-sible to observe a wetting transition between nonwetting and partial wetting by the CiEj-rich phase at the air-water inter-face near the lower critical solution temperature共LCST兲 and another wetting transition between partial wetting and com-plete wetting near the upper critical solution temperature 共UCST兲 in binary CiEj+ water mixtures. In other words, the CiEj-rich phase in the water+ C8Ej mixtures exhibits a se-quence of wetting transitions from nonwetting to partial wet-ting to complete wetwet-ting at the air-water interface along with increasing temperature from its LCST to UCST. To the best of our knowledge, this conjecture has not been experimen-tally verified.
The effect of the molecular structure of CiEjon the wet-ting behavior in the water+ CiEj mixtures was carefully ex-amined in our previous works,21,22which was still subject to relatively low temperatures. In this study, we assembled a new pendant bubble/drop tensiometer to extend our experi-mental temperature window up to 140 ° C. Based on the ex-perimental wetting coefficients, the wetting behavior in the binary water+ C4E1 system was carefully investigated over the whole temperature range of its closed-loop miscibility gap共between temperatures 323.15 and 401.15 K兲.23–25 This paper is organized as follows: The experimental details are described in the Sec. II. The results of the temperature de-pendence of the surface/interfacial tensions for the binary water+ C4E1 system are presented. The wetting behavior of the C4E1-rich phase at the water surface is carefully dis-cussed. Indeed, the occurrence of a sequence of wetting tran-sitions in the binary water+ C4E1 system is experimentally verified. Additionally, the interfacial tension between the C4E1-rich and aqueous liquid phases were verified to be strongly related to the miscibility gap.
II. EXPERIMENTS A. Materials
Ethylene glycol monobutyl ether共n-C4E1,⬎99%兲 was purchased from Merck Chemical Co., and used as received. Water was purified by double distillation and then followed by a PURELAB Maxima Series共ELGA LabWater兲 purifica-tion system with the resistivity always better than 18.2 M⍀ cm.
B. Apparatus
A homemade pendant bubble/drop tensiometer was used to measure the interfacial tension between two coexisting liquid phases and the surface tensions of both liquid phases against helium. The schematic setup of the tensiometer is shown in Fig. 2. This device was mainly composed of a parallel light generator including a light source 共model 190, fiber-optical illuminator, Dolan-Jenner兲, a diffuser, a pinhole, an achromatic lens, a solid-state monochrome change-coupled device共CCD兲 camera 共XC-ST70, Sony兲, and a com-puter equipped with an image frame grabber 共DT3155 MACH Series, Data Translation兲. The bubble 共or liquid drop兲 image on the active area of the camera was magnified ap-proximately 1⫻ 共or 1.8⫻兲 for surface- 共or interfacial兲 ten-sion measurement. The frame grabber digitized an image
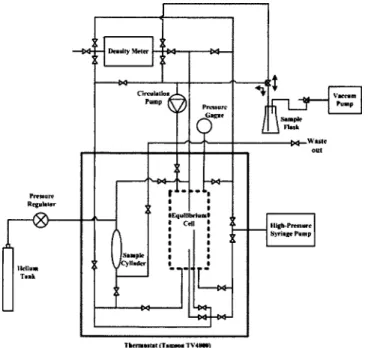
into 640⫻480 pixels with an 8-bit resolution of 256 gray levels. The bubble共or liquid drop兲 forming system was com-posed of a precision syringe pump 共model 100DM, ISCO Inc.兲 and stainless-steel needles. Two needles 共Hamilton Co.兲 of different diameters, gauge 17 关1.07-mm inner diameter 共i.d.兲; 1.47-mm outer diameter 共o.d.兲兴 and gauge 27 共0.21 -mm i.d.; 0.41-mm o.d.兲, were equipped at the bottom of the equilibrium cell for, respectively, the surface-and interfacial tension measurement. The glass liquid level gage共series 20兲 of JERGUSON Gage & Valve Co. was applied as the equi-librium cell. The sample mixture was held in the equiequi-librium cell, which was housed in a thermostat 共TV4000, Tamson Labovisco, Holland兲. The temperature stability of the ther-mostat was better than ±0.05 K. The density for each phase was measured by using a vibrating-tube densiometer 共DAM 60/ 512, Anton Paar, Austria兲 directly connected to the equi-librium cell through the pipeline and the liquid pump 共LDC analytical minipump兲. We were able to measure the density online. The detailed layout of the experimental apparatus and the piping is schematically illustrated in Fig. 3.
C. Procedures
The equilibrium cell and all the pipelines were vacu-umed by a vacuum pump 共GCD-050XA, Sinku Kiko Co.,
FIG. 2. The schematic setup of the pendant bubble/drop tensiometry.
FIG. 3. The schematic setup of the experimental apparatus and the bubble/ drop forming system.
Ltd. Japan兲. About 100 ml of degassed sample mixture with a proper composition 共⬃0.3 mass fraction of n−C4E1兲 was automatically sucked into the equilibrium cell through the pipelines by pressure difference. The inert gas helium of 99.99% purity was then injected into the system to maintain the system at 10 bar, as indicated by a digital pressure gauge 共DPI280/PDCR330, Druck Limited兲. The liquid sample in the equilibrium cell was circulated by the liquid pump for at least 2 h to ensure thorough mixing. The equilibration was established for at least several hours up to 1 day. When the equilibrium was reached, both the liquid phases in the equi-librium cell were clear and transparent with sharp and mir-rorlike interfaces.
Note that a stainless-steel sample cylinder was as-sembled right beside the equilibrium cell, as shown in Fig. 3, for adjusting the level of the interface separating the C4E1-rich and aqueous phases in the equilibrium cell to per-form the pendant bubble/drop method. The Hamilton needle for the pendant bubble/drop measurement was installed at the bottom of the equilibrium cell. Once the sample mixture was input, the whole needle was immersed in the lower aqueous phase after the equilibration. First we performed the surface-tension measurement for the lower aqueous phase. Then we had to pump a certain amount of the lower aqueous phase from the equilibrium cell to the sample cylinder to lower the level of the interface separating the C4E1-rich and aqueous phases, i.e., to ensure the tip of the needle right in the middle of the upper C4E1-rich phase for further surface-tension measurement for the upper C4E1-rich phase.
The precision syringe pump共model 100DM, ISCO Inc.兲 was applied to drive the upper fluid phase through the pipe-lines to form a bubble共or liquid drop兲 at the selected needle in the lower liquid phase. For each tension, at least ten dif-ferent bubbles 共or liquid drops兲 were formed. For each bubble 共or liquid drop兲, at least ten images were taken for image analysis. An edge detection program was adopted from that of the previous work26–28to determine the bubble/ drop profile from a digitized image. Once a bubble 共or a liquid drop兲 profile was digitized and allocated, the selected-plane method was applied to determine the surface共or inter-facial兲 tension by numerically fitting the profile to the Young-Laplace equation.26–28The experimental uncertainty of the surface-interfacial tension measurements was always better than 0.3%.
III. RESULTS AND DISCUSSION
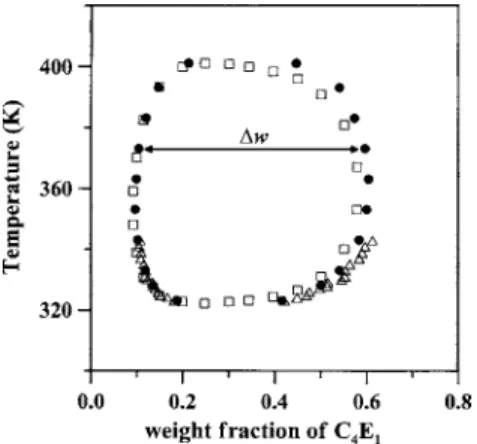
It is well understood that the water+ C4E1system exhib-its a loop miscibility gap. Figure 4 shows the closed-loop phase diagram of the system.23,24Its LCST and UCST are, respectively, 49 and 129 ° C.23,24 We started with the system to perform its surface/interfacial tensions over its temperature window of closed loop at atmospheric pressure. However, when the temperature was higher than 85 ° C, the mixture started boiling and no stable air-liquid interface was observed any more. Therefore, the inert helium was applied to increase the system pressure up to 10 bar, that suppressed thermal instability to gain stable interfaces for surface-interfacial tension measurements. Note that the closed-loop
phase behavior of the water+ C4E1 system would shrink as the system pressure increases.29However, 10 bar is still rela-tively a small pressure and too small to influence substan-tially the phase behavior of the mixture. The ␣, , and ␥ phases defined in Fig. 1 correspond to the insert helium, C4E1-rich phase, and aqueous phase, respectively, in this liquid-liquid equilibrium system.
The surface/interfacial tensions for the water+ C4E1 mix-ture at 10 bar were measured by the homemade pendant drop/bubble tensiometer between the upper and lower critical solution temperatures of the system. The experimental results of the surface tensions of the C4E1-rich phase共␣兲 and of the aqueous phase共␣␥兲 are given in Figs. 5 and 6, respec-tively. Both surface tensions decrease along with increasing temperature. It should be noted that the experimental uncer-tainties for each data point are also given in Figs. 5 and 6. The error bars are always smaller than the size of open sym-bols.
Figure 7 shows the variation of experimental results of the interfacial tension between the C4E1-rich phase and the aqueous phase 共␥兲 as a function of temperature ranging from its lower to upper critical solution temperature. The interfacial tension must be zero either at the lower or at the upper critical solution temperature of the system. To start with the lower critical solution temperature, the interfacial
FIG. 4. Mutual solubility for the water+ C4E1 binary system. Cox and Cretcher共Ref. 23兲 共䊐兲; Kim and Lim 共Ref. 25兲 共䉭兲; Christensen et al. 共Ref. 24兲 共쎲兲.
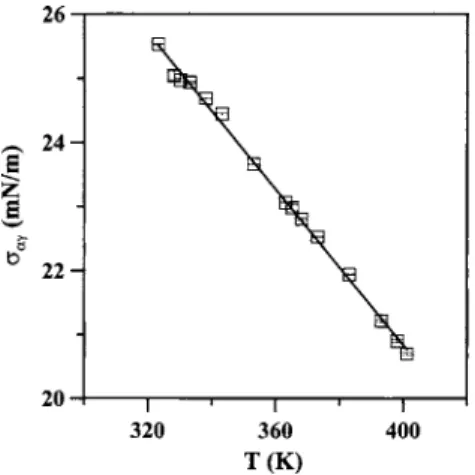
FIG. 5. Variation of surface tension␣of the C4E1-rich phase as a function of temperature for the water+ C4E1system at 10 bar.
tension ␥ increases along with increasing temperature, reaches to a maximum around 90 ° C, and then decreases along with increasing temperature. There is a qualitative rule for the interfacial tension related to the mutual solubility.30 That is, the smaller the mutual solubilities, the greater the interfacial tension. Donahue and Bartell31 proposed a linear relation between the interfacial tension of water-organic liq-uid interfaces and the logarithm of the “degree of miscibil-ity,” defined by ln共N1+ N2兲, where N1is the mole fraction of the water in the organic liquid phase and N2 is the mole fraction of the organic liquid in the aqueous phase. These authors had applied more than 30 organic liquids to verify that the interfacial tension decreases when ln共N1+ N2兲 lin-early increases at constant temperature.31
Instead of the “degree of miscibility,” the miscibility dif-ference ⌬w is proposed and defined by the difference be-tween the weight fraction of C4E1in the aqueous phase and that in the C4E1-rich phase, as schematically illustrated in Fig. 4. It is obvious that a large miscibility difference stands for a small mutual solubility. The variation of the miscibility difference⌬w as a function of the temperature is also shown in Fig. 7 along with the interfacial tension. The miscibility difference⌬w must be zero either at the lower or at the upper critical solution temperature of the system. To start with the lower critical solution temperature, the miscibility difference ⌬w increases along with increasing temperature, reaches to a
maximum around 90 ° C, and then decreases along with fur-ther increasing temperature, as shown in Fig. 7. As expected, the greater the miscibility difference ⌬w, the greater the in-terfacial tension. It is much more interesting to observe the variation of the interfacial tension as a function of the mis-cibility difference⌬w, shown in Fig. 8, in which the square symbol stands for the data points of temperature below 90 ° C and the circle symbol for that above 90 ° C. Our ex-perimental temperature range is from 50 to 128 ° C. Both branches共below and above 90 °C兲 coincide with each other perfectly to form one curve. That implies the interfacial ten-sion is strongly related to the miscibility difference⌬w, and this relationship is irrelevant to the temperature, as illus-trated in Fig. 8. It should be pointed out that Donahue and Bartell31 found out that the interfacial tension linearly de-creases along with an increase in ln共N1+ N2兲 for more than 30 binary water+ organic liquid mixtures only at constant
temperature. However, our experimental data of interfacial
tensions do not follow the linear dependence of ln共N1+ N2兲. The wetting behavior of the C4E1-rich phase at the inter-face separating the inert helium and the aqueous phase could be simply verified by the wetting coefficient. The wetting coefficients for the water+ C4E1 system were determined from the surface/interfacial tensions. Figure 9 illustrates the variation of the wetting coefficient as a function of
tempera-FIG. 6. Variation of surface tension␣␥of the aqueous phase as a function of temperature for the water+ C4E1system at 10 bar.
FIG. 7. Variation of interfacial tension␥and the miscibility difference⌬w as a function of temperature for the water+ C4E1system.␥共䊊兲; ⌬w 共䊐兲 关Christensen et al. 共Ref. 24兲兴, LCST 共䉲兲, and UCST 共䉱兲.
FIG. 8. Variation of the interfacial tension␥as a function of the misci-bility difference⌬w. Experimental data below 90 °C 共䊐兲 and above 90 °C 共䊊兲.
FIG. 9. Variation of wetting coefficient as a function of temperature for the water+ C4E1system at the normal pressure共䉭兲 and at 10 bar 共䊐兲.
ture at 10 bar. In addition, the wetting coefficients deter-mined at normal pressure are also shown in Fig. 9 by using the triangle symbol. These data共at normal pressure兲 coincide with that at 10 bar, as shown in Fig. 9. The pressure differ-ence is too small to see the differdiffer-ence in wetting behavior, as expected.
The wetting behavior of the C4E1-rich 共兲 phase at the interface separating the helium and the aqueous phases for the water+ C4E1 system is then classified into three regimes according to the wetting coefficient. They are 共1兲 the non-wetting phase with temperatures below 58.5 ° C and with
W = 1, 共2兲 the partial wetting  phase with temperatures in between 58.5 and 91 ° C and with 1⬎W⬎−1, and 共3兲 the complete wetting  phase with temperatures above 91 ° C and with W = −1.
To start with the system at 80 ° C, the C4E1-rich phase exhibits partial wetting behavior at the surface of the aque-ous phase. A wetting transition from partial wetting to non-wetting occurs at 58.5 ° C while the system is brought to approach the LCST. This finding is consistent with that of Hirtz et al.32 On the other direction, while the system is driven to approach the UCST, another wetting transition from partial wetting to complete wetting happens at 91 ° C. In other words, a sequence of wetting transition, nonwetting→partial wetting→complete wetting, is ob-served in the water+ C4E1 system with increasing tempera-ture under 10 bar. Our results experimentally verify the con-jecture of Kahlweit and Busse:6 the existence of a wetting transition from nonwetting to partial wetting near the LCST and another wetting transition from partial wetting to com-plete wetting near the UCST for the binary mixture water + CiEj.
Figure 8 illustrates obviously that the wetting coefficient drops substantially right after the occurrence of the transition from nonwetting to partial wetting, then slowly decreases and “asymptotically” approaches −1 to trigger another tran-sition from partial wetting to complete wetting by simply increasing the temperature. The order of the wetting transi-tion between partial wetting and complete wetting is hard to identify based on our experimental accuracy. Currently we are in the process of using an ellipsometry to identify the order of this transition. On the other hand, the wetting tran-sition between partial wetting and nonwetting is a first-order transition, consistent with previous experimental results33,34 as well as with the theoretical prediction.35,36Currently, we are also in the process of using an ellipsometry to further verify this finding. Note that a hysteresis of the thickness of a wetting layer was found in the cyclohexane+ methanol system,34consistent with the assumption of a first-order tran-sition.
Previous experimental results16,21,32 also demonstrated that for the binary mixtures water+ C6E2 and water+ C10E4 the wetting transition from nonwetting to partial wetting oc-curs near the LCST. However, these two systems are ex-pected to have very high UCSTs, beyond the limitation of our apparatus. Therefore, we have no intention to perform the surface-interfacial tension measurements to further verify the existence of another wetting transition from partial wet-ting to complete wetwet-ting near its UCST. However, the inert
gas phase can be replaced by an oil phase, then the binary water+ CiEj system switches to the ternary water+ oil+ CiEj system. It is expected that the wetting behavior of the CiEj-rich phase at the oil-water interface in the ternary sys-tem would be similar to that of the CiEj-rich phase at the gas-water interface in the binary system, simply because both the inert gas and the oil are hydrophobic. More pre-cisely, the inert gas is more hydrophobic than the oil. Thus, introduction of an alkane to the binary system would reduce the temperature difference between UCST and LCST,15 that enables us to observe the wetting behavior over the whole temperature range in between UCST and LCST. For ex-ample, the UCST and LCST for the water+ tetradecane + C6E2system are 46.23 and 9.86 ° C, respectively.12Indeed, the middle C6E2-rich phase in the water+ tetradecane+ C6E2 system would undergo a sequential wetting transition, nonwetting→partial wetting→complete wetting, at the oil-water interface along with increasing temperature.12
In this study, we already verified that the C4E1-rich phase in the water+ C4E1 system would exhibit a sequence of wetting transitions, nonwetting→partial wetting
→complete wetting, at air-water interface along with
in-creasing temperature. Therefore, it is plausible to conjecture the existence of a sequential wetting transition, nonwetting
→partial wetting→complete wetting, of the C4E1-rich phase at the oil-water interface in the ternary water+ oil + C4E1 system. In previous studies, no such sequential wet-ting transition was observed. Chen et al.11as well as Kahl-weit and co-workers6–10 found that the C4E1-rich phase al-ways completely wets the oil-water interface in the water + octane+ C4E1 system over the whole temperature range in between UCST and LCST. On the other hand, another sequential wetting transition, complete wetting
→partial wetting→complete wetting, of the C4E1-rich phase at the oil-water interface was observed in the water + octane+ C4E1system by Bonkhoff et al.5All these previous studies5–11are not consistent with the conjecture mentioned above. Thus, the wetting behavior of the C4E1-rich phase at the oil-water interface in the water+ octane+ C4E1system re-mains a controversial problem. Currently, we are in the pro-cess of carrying out the surface-interfacial tension measure-ments to further verify the existence of a sequential wetting transition in the water+ octane+ C4E1system.
IV. CONCLUSION
In this study, the surface-interfacial tension measure-ments were performed over the whole temperature range be-tween UCST and LCST of the water+ C4E1system at 10 bar. Based on the wetting coefficient data, it is found that the C4E1-rich phase exhibits a sequence of wetting transitions, nonwetting→partial wetting→complete wetting, at the air-water interface by increasing the system temperature, consis-tent with the conjecture of Kahlweit and Busse.6
The interfacial tension is strongly related to the miscibil-ity difference ⌬w over the whole temperature range of liquid-liquid equilibrium of the binary water+ C4E1 system, as illustrated in Fig. 8. Note that this relationship is irrelevant to temperature.
ACKNOWLEDGMENTS
This work was supported by the National Science Coun-cil of Taiwan, Republic of China. We thank Professor Ming-Jer Lee for the help in assembling the apparatus.
1G. N. Antonow, J. Chim. Phys. Phys.-Chim. Biol. 5, 372共1907兲. 2F. P. Buff, in Encyclopedia of Physics, edited by S. Flugge 共Springer,
Berlin, 1960兲, Vol. 10, Sec. 7, pp. 298 and 299.
3G. Gompper and M. Schick, in Phase Transitions and Critical Phenom-ena, edited by C. Domb and J. L. Lebowitz共Academic, New York, 1994兲, Vol. 16.
4D. Bonn and D. Ross, Rep. Prog. Phys. 64, 1085共2001兲.
5K. Bonkhoff, A. Hirtz, and G. H. Findenegg, Physica A 172, 174共1991兲. 6M. Kahlweit and G. Busse, J. Chem. Phys. 15, 1339共1989兲.
7M. Aratono and M. Kahlweit, J. Chem. Phys. 95, 8578共1991兲. 8M. Kahlweit, R. Strey, M. Aratono, G. Busse, J. Jen, and K. V. Schubert,
J. Chem. Phys. 95, 2842共1991兲.
9M. Kahlweit, R. Strey, and G. Busse, Phys. Rev. E 47, 4197共1993兲. 10M. Kahlweit and G. Busse, J. Phys. Chem. B 104, 4939共2000兲. 11L.-J. Chen, J.-F. Jeng, M. Robert, and K. P. Shukla, Phys. Rev. A 42,
4716共1990兲.
12L.-J. Chen and W.-J. Yan, J. Chem. Phys. 98, 4830共1993兲.
13L.-J. Chen, W.-J. Yan, M.-C. Hsu, and D.-L. Tyan, J. Phys. Chem. 98, 1910共1994兲.
14L.-J. Chen, S.-Y. Lin, and J.-W. Xyu, J. Chem. Phys. 104, 225共1996兲. 15L.-J. Chen, C.-D. Chiu, F.-S. Shau, W.-J. Cheng, and J.-G. Wu, J. Phys.
Chem. B 106, 12782共2002兲.
16M.-C. Yeh and L.-J. Chen, J. Chem. Phys. 115, 8575共2001兲.
17L.-J. Chen and M.-C. Hsu, J. Chem. Phys. 97, 690共1992兲.
18L.-J. Chen, M.-C. Hsu, S.-T. Lin, and S.-Y. Yang, J. Phys. Chem. 99, 4687共1995兲.
19J. W. Cahn, J. Chem. Phys. 66, 3667共1977兲.
20C. Ebner and W. F. Saam, Phys. Rev. Lett. 38, 1486共1977兲.
21M.-C. Yeh, P.-C. Lin, and L.-J. Chen, J. Phys. Chem. B 108, 9955 共2004兲.
22C.-K. Wu and L.-J. Chen, Langmuir 21, 6883共2005兲.
23H. L. Cox and L. H. Cretcher, J. Am. Chem. Soc. 48, 451共1926兲. 24S. P. Christensen, F. A. Donate, T. C. Frank, R. J. LaTulip, and L. C.
Wilson, J. Chem. Eng. Data 50, 869共2005兲.
25K. Y. Kim and K.-H. Lim, J. Chem. Eng. Data 46, 967共2001兲. 26M.-C. Yeh, L.-J. Chen, S.-Y. Lin, and C.-T. Hsu, J. Chin. Inst. Chem.
Eng. 32, 109共2001兲.
27S.-Y. Lin, L.-J. Chen, J.-W. Xyu, and W.-J. Wang, Langmuir 11, 4159 共1995兲.
28S.-Y. Lin, L.-J. Chen, W.-J. Wang, and L.-W. Lin, Colloids Surf., A 114, 31共1996兲.
29M. Kahlweit and R. Strey, Angew. Chem., Int. Ed. Engl. 24, 654共1985兲. 30J. J. Bikerman, Physical Surfaces共Academic, New York, 1970兲, p. 118. 31D. J. Donahue and F. E. Bartell, J. Phys. Chem. 56, 480共1952兲. 32A. Hirtz, K. Bonkhoff, and G. H. Findenegg, Adv. Colloid Interface Sci.
44, 241共1993兲.
33J. W. Schmidt and M. R. Moldover, J. Chem. Phys. 79, 379共1983兲. 34D. Bonn, H. Hellay, and G. H. Wegdam, Phys. Rev. Lett. 69, 1975
共1992兲.
35M.-C. Yeh and L.-J. Chen, J. Chem. Phys. 118, 8331共2003兲.
36M.-C. Yeh, C.-M. Chen, and L.-J. Chen, J. Phys. Chem. B 108, 7271 共2004兲.