Design of an Integrated and Effective Platform
for Gene Expression Data Mining
Vincent Shin-Mu Tseng, Lien-Chin Chen and Jian-Jie Liu
Institute of Computer Science and Information Engineering, National Cheng Kung University, Tainan, Taiwan, R.O.C.E-mail:[email protected]; {cljimmy, kyrill}@dblab.csie.edu.tw
【Abstract】
Gene expression data mining is an important issue in bioinformatics research and applications since it can effectively help discover the functions of genes in high throughput way. Although there exists some software for gene expression analysis, they are insufficient in terms of efficiency, automation, flexibility and degree of integration. In this research, we design an integrated platform, namely GeneFilter, which carries the merits of high efficiency, high degree of automation, web-based anywhere flexibility and seamless integration. A standard and automated analysis flow is designed, which includes data normalization, genes filtering, genes clustering, and genes scoring so that users can easily discover the list of interesting genes, interesting expression patterns or gene clusters across different chip-array experiments. Rich kinds of visualization modules are also provided in web-based manner such that users can visualize the analysis results flexibly at anywhere. Meanwhile, useful biological knowledge like Gene Ontology and pathway information can also be retrieved easily in the same integrated platform. Hence, the GeneFilter platform serves as a highly effective platform for gene expression data mining and has been applied to different kinds of disease analysis successfully.
INTRODUCTION
High throughput techniques are becoming more and more important in many areas of basic and applied biomedical researches. Using this technology, the relative expression levels in two or more mRNA populations derived from tissue samples can be assayed for thousands of genes simultaneously [4, 15]. Microarray techniques using cDNAs or oligonucleotides are such high throughput approaches for large-scale gene expression analysis and enable the investigation of mechanisms of fundamental processes and the molecular basis of diseases on a genomic scale [10, 12, 18]. The method proved its enormous potential to elucidate the nature of various biological processes within the cell and between cells at different states. Hence, the gene expression analysis techniques have been deployed for analyzing the markers of various kinds of diseases like lung cancer, breast cancer and bladder cancer.
Some software tools, like the commercial ones and those in [13] exist for biologists to analyze microarray datasets. Basically, these software are designed as a general microarray analysis platform, and they normally contain statistical and analysis methods like clustering, classification, etc. In addition, some statistical tools like the R language (http://www.r-project.org/) are an alternative for biologists to analyze microarray datasets. However, it is difficult for biologists to learn this kind of programming language in a short period. In overall, there exist some insufficiency for the
above kinds of software tools in terms of efficiency, automation, flexibility and degree of integration when used for gene expression mining.
In this research, we designed an integrated platform, namely GeneFilter, which has the following merits: 1) High degree of integration, 2) High degree of automation, 3) High flexibility. An analysis flow is designed based on that in [20], including preprocessing, data mining, visualization, ranking and feedback. The specific merits of the proposed platform for the biomedical researchers are as follows. First, in terms of the integration property, we integrated all analysis components such as normalization, data mining, scoring methods [8, 9], and visualization modules into the one platform such that biologists can analyze the microarray datasets and related biological knowledge in effective manner. Second, in terms of the automation property, the complex analysis processes are automated such that the biologists may just follow the simple analysis flow and the analysis reports from single chip or cross-chips experimental designs are generated automatically in form of web pages. Third, in terms of flexibility property, the whole GeneFilter platform is web-bas ed and many analysis functions can be achieved in just simple click actions. Hence, the platform provides anywhere and user-friendly flexibility for the users. Moreover, in order to further investigate the relevant biological knowledge after microarray analysis, we also incorporate the Gene Ontology (www.geneontology.org.) and pathways (http://cgap.nci.nih.gov/) information in the GeneFilter platform and automatically attach them onto the analysis results.
In real applications, the GeneFilter platform was applied to various kinds of disease analysis. One novel example is in identifying the putative and novel biomarkers that are highly related to bladder cancer progression. We applied the standard analysis flow in GeneFilter on different sets of microarray data and obtain the interesting genes effectively. Furthermore, these selected genes verified through high-throughput real-time PCR. We will describe the details in section 4.
The rest of this paper is organized as follow: In section 2, the whole system framework and analysis flow are discussed step by step. In section 3, we describe each kernel methodology of various modules in the platform. The real application on bladder cancer analysis is given in section 4. Finally, section 5 gives the conclusions and the future research directions of this research.
SYSTEM FRAMEWORK
The goal of our research is to develop a web-based framework with a complete gene expression analysis flow that includes preprocessing, gene expressions analysis and visualization modules. In our implementation, we developed an on-line system to analyze gene expression profiles so as to provide biologists the accurate analysis results in easy way.
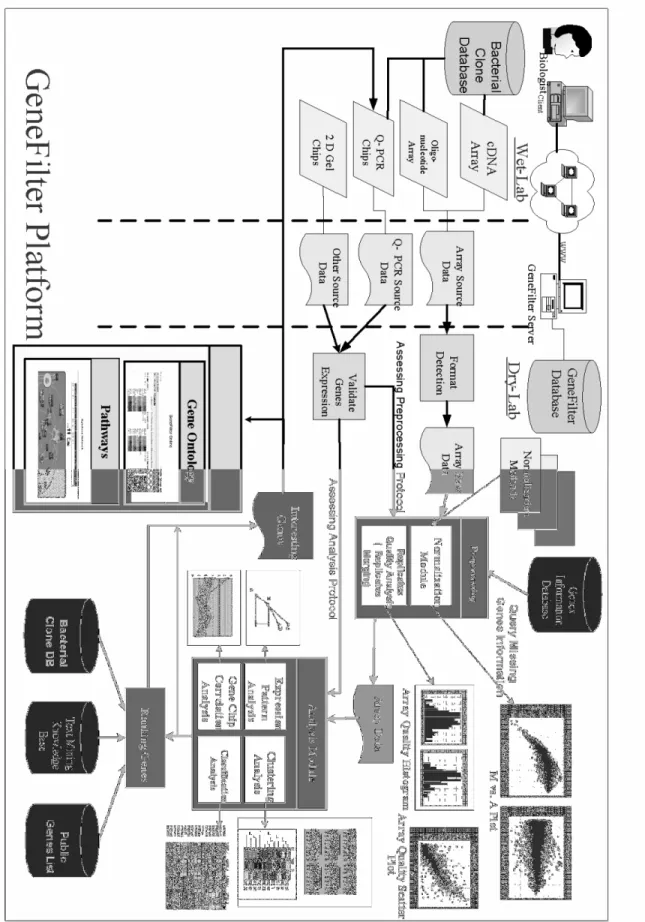
The system architecture is as shown in Fig. 1. The steps of analysis flow are described below: Step1: In wet-lab, biologists can link to the
bacterial clone database for searching the required materials to design the experiments. They may perform different kinds of experiments such as cDNA microarray, oligonucleotide microarray, Q-PCR, or 2D electrophoresis gel. Then, the microarray experimental results can be submitted to GeneFilter server and the results are stored in the server.
Step2: Next, the analysis enters into the dry-lab part. First, we have to define the data formats. Basically, GeneFilter (in Fig. 2) can automatically deal with the data format of scanned microarray images, and the scanned result files are produced by GenePix series software. However, in order to accept various data formats from different client users, users can also define the format manually on the on-line web pages. In GeneFilter, we also reference a famous standard definition of a minimum set of data known as the MIAME (Minimum Information About a Microarray Experiment) initiated by Brazma [3]. In other words, the analysis
results were conformed to MIAME standard. Moreover, in order to parse the same format datasets, users can save templates of the data format. Then we can start the preprocessing step.
Step3: There are four parts in the preprocessing module:
(i) Checking the completeness of gene information.
(ii) Analyzing and merging replicates of gene expressions.
(iii) Basic statistical analysis and diagrams. (iv) Gene expression datasets normalization.
[11, 22, 23]
Next, we can enter the analysis module. Step4: The analysis module can be divided into
four parts
(i) Gene expression patterns analysis (ii) Gene chips correlation analysis (iii) Clustering analysis.
(iv) Classification analysis
Step5: After finding some interesting genes in analyses, these genes can be ranked according to their importance relating to certain diseases.
Step6: Furthermore, we can also search the Gene Ontology (GO) term, Biocarta and KEGG pathways of the interesting genes so as to provide more information to biologists.
Step7: Finally, GeneFilter provides as well the analysis report for each microarray chip uploaded. The report includes the analysis results and information that users will be interested in.
METHODOLOGY
In this Section, we will go into details of the designed methodologies for the critical modules in GeneFilter platform.
Data Preprocessing and Basic Statistic Analysis
There are four major parts in this step:
(1) Checking the completeness of gene information: As we know that one gene may have different annotations in various laboratories or centers, so different users may submit datasets of different formats to GeneFilter platform. We handle preprocessing step that contains missing gene information handling by the database based on CGAP database. If the uploaded raw datasets contain the missing gene information, then we can fill the missing items by querying the CGAP database that we mirrored by UGLink ID. Furthermore, we design an interface (as shown in Fig. 3) in GeneFilter to query gene information on a database server for keeping the consistency and completeness of genes information.
(2) Analyzing and merging replicates of gene expressions:
Since there are two or more replicates for one gene in a microarray chip, we can check the gene expression quality by analysis. For this reason, GeneFilter provides the mean, median, and standard deviation (SD) of replicates in one gene, and also generates an analysis report to users. (3) Basic statistical analysis and diagrams:
By using some basic statistical methods and diagrams, it is easy for users to check the quality of the microarray datasets. There are some basic statistic methods and diagrams in GeneFilter for users to observe the distribution of the gene expression values in the chip. For example, we display single-slide data by the log-intensity log2R of the red dye versus the log-intensity log2G of the green dye, as well as the log intensity ratio M= log2R/G versus the log-intensity A= log2 RG (in Fig. 4(a)). An M-versus-A plot is another representation of the (Red, Green) data in terms of the log-intensity ratios M, which are the quantities of interest to most investigators. By using the Cy5 features versus Cy3 features scatter plots, we can observe how large the fluorescence effect is (in Fig. 4(b)). (4) Gene expression data normalization:
The goal of normalization is to identify and remove systematic variations and allow between-slide comparisons. The normalization is
done separately, using only the Cy5 and Cy3 intensities for this slide. The approaches are described below.
A. Within-slide normalization:
(i) Global normalization: Global methods assume that the red and green intensities are related by a constant factor k.
) /( log / log / log2R G−> 2R G−c= 2R kG
A common choice for the location parameter c= log2 k is the median or mean of the log-intensity ratios for a particular gene set.
(ii) Intensity dependent normalization: In [23], the authors described that the Cy5 intensities tend to be lower than the green intensities and magnitude of the difference may depend on overall intensity A. The Lowess normalization is a scatter-plot smoother that performs robust locally linear fits. In general, we use Global Lowess normalization in GeneFilter. (iii)Winthin -print -tip -group normalization:
Some systematic differences may exist between the print-tips, such as slight differences in the length or in the opening of the tips, and deformation after many hours of printing. We can simply use Lowess fit for each grid of one print-tip-group.
B. Within-slide normalization: Scale
All the normalized log-ratios from the different print-tip groups will be centered to zero. However, it is possible that the log-ratios from the various print-tip groups have different spread and some scale adjustment is required. One approach is to assume that all log-ratios from the ith print-tip group follow a normal distribution. C. Paired-slides normalization
Paired-slides normalization was applied to dye-swap experiments: two hybridizations for two mRNA samples, with dye assignment reversed in the second hybridization. The main assumption is that chip effects are equal and this method can be applied to all genes. The validity of this
assumption may be checked using a set of genes expected to have constant expression levels (e.g. housekeeping genes or genomic DNA).
D. Multiple slides normalization
Multiple slide normalization methods, which aim to allow experiment to experiment comparisons, may also need to be adjusted for scale when the different slides have substantially different spreads in their log-ratios.
Analysis Module
(1) Gene Expression Profiling Patterns
To analyze the microarry data and obtain the gene expression patterns effectively, an automatic and efficient approach is designed for filtering gene expressions profile patterns from multi-conditions microarray data. The main advantage of the method is the automized analysis provided for users. In most analysis tools, the users must manually set up some criteria for finding the expression profile patterns. In GeneFilter, it takes only one click to find different kinds of patterns automatically. For example, as shown in Fig. 5, the nine main patterns of gene expressions (e.g., up-up-regulated or up-down-regulated) are extracted automatically from the microarray datasets containing bladder cancer expressions of stages one to three.
(2) Gene Chips Correlation Analysis
In order to verify the experiment results in gene expression, researchers may compare different gene expression values between various chip resources, for instance, commercial or laboratory chips. In GeneFilter, users can compare the common gene expressions between two chips and visualized graphs are provided for checking the consistency between two experiments for each common gene (as shown in Fig. 6).
(3) Clustering Analysis
The problem of gene expressio n clustering can be described briefly as follows. Given a set of genes with unique identifiers, a vector Ei = {Ei1, Ei2, … , Ein} is associated with each gene i,
where Eij is a numerical data that represents the response of gene i under condition j. The goal of gene expression clustering is to group genes together with similar expressions over all conditions. That is, genes with similar corresponding vectors should be classified into the same cluster. Three clustering methods are included in GeneFilter, which are two traditional clustering methods named hierarchical clustering (Fig. 7) and k-means, and a novel method named CAST-FI [19].
CAST-FI was shown to be more effective than other traditional clustering methods with validation measures [19]. There are three steps in CAST-FI approach. The first step is to calculate a similarity matrix S in which the entry Sij represents the similarity of the expression patterns for genes i and j. The Pearson’s correlation coefficient [14] is used here to calculate similarity between two vectors. In the second step, a density-and-affinity based algorithm – CAST [2], is applied as the base clustering algorithm. In the third step, a validation test is performed to evaluate the quality of the clustering result produced in step two. Here, the Hubert’s statistic [2] is adopted for measuring the quality of produced clustering. (4) Classification Analysis and Prediction
The main goal of gene expression classification analysis is to build up models for describing properties of imp ortant data classes so as to predict disease types based on gene expression. We have implemented two types of classification methods in GeneFilter. One is the TNoM (Threshold Number of Misclassification) method [1] that scores the given gene by searching a simple decision rule corresponding to a given expression level so as to predict the class label of an unknown instance. The other one is SVM (Support Vector Machine) method [21] that is a machine learning algorithm based on the structural risk minimization principle from statistical learning theory. In our implementation, we adopted the SVM software named LIBSVM developed by C.C. Chang et al. [6].
Gene Expression Ranking Method
When we find some interesting genes that are related to certain targeted diseas e, GeneFilter will rank these genes by the following criteria: (1) Ranking by the significant amount of gene expression ratio as of Cy5 intensity value to Cy3 one. (2) We also integrate text mining results on medical documents that provide useful information on relations between genes and diseases. Here, we adopt the text mining results produced by systems like MeKE [7], which is an intelligent text -mining system capable of extracting information from biomedical documents about the functions relations of gene products. Thus, the genes can be ranked according to the text mining results with weights. For example, if our target disease is bladder cancer, the genes that have been reported as relevant to bladder cancer in medical literature more times will be given higher scores and higher rank.
(3) Real-Time quantitative polymerase chain reaction (Q-PCR) technique is more precise in gene expression status than cDNA microarray. Moreover, Q-PCR can validate differentially expressed genes identified by DNA arrays [16, 17]. So, the degree of consistency between the microarray data and Q-PCR result for a gene is also taken into account in performing scoring. Gene Ontology Analysis
In GeneFilter platform, we downloaded the latest Gene Ontology from (http://www.geneontology.org/) web site to our database, and implement a querying interface (in Fig. 8) for users to search interesting genes locations in the Gene Ontology. The goal of the Gene Ontology (GO) is to produce a controlled vocabulary that can be applied to all organisms even as knowledge of gene and protein roles in cells is accumulating and changing. There are three structured networks of defined terms in Gene Ontology to describe gene product attributes: molecular function, biological process and cellular component. A gene product may have one or more molecular functions and is used in one or more biological processes, and it might be associated with one or more cellular components.
Pathways Analysis
In order to investigate and find out the gene-gene interactions, a gene pathway querying interface is also provided in GeneFilter (Fig. 9). The pathway information was primarily downloaded from the CGAP, which is connected from BioCarta ( http://www.biocarta.com/ ) and KEGG (Kyoto Encyclopedia of Genes and Genomes) ( http://www.genome.jp/kegg/ ).
REAL APPLICATIONS
In this section, we describe the real applications of GeneFilter on analysis of marker genes for bladder cancer. The goal of the analysis is to identify potential and novel biomarkers that are highly associated with bladder cancer progression. In recent bladder cancer researches, we get advanced understanding about the pathogenic reasons to the carcinogenesis about bladder cancer according to the efforts of molecular biology and cell genetics in recent twenty years. For instance, chromosome arrangement in bladder cancer cells is distinct from that in normal cells. There are often some variations like breakage, translocation, deletion and circular linkage in chromosome 1,5,9,11,17, X and Y. In addition, there are some deletions or damages in the p arm of the 9th, q arm of the 11th, and p arm of the 17th chromosome in more than sixty percent patients of bladder cancer, but this phenomenon is not seen in their normal cells. Hence it is suggested that there are tumor suppressor genes on these chromosomes. The tumor suppressor genes can inhibit tumor cells growing once these tumor suppressor genes are well functioned. However, when they are exposed to carcinogens or gene mutations occur, cell division can not be controlled efficiently and will lead to cell proliferate abnormally and turn as tumor cells. The bladder cancer development can be divided into four stages. In first stage, cancer cells are limited to the inner membrane; in second stage, cancer cells invade the muscle layer. In third stage, cancer cells invade to the lipid outlayer, and cancer cells metastasize in the forth stage.
The major strategy for the analysis is to investigate the expression profiles of various genes from stage one to stage three of bladder cancer cells. The cDNA chips and the microarray data are produced by two corporations (noted as A company and G company), each of which consists of 7684 and 12814 unique human cDNA clones, respectively. The tumor cell lines are as the in vitro model of bladder cancer, including RT4, TSGH8301, J82 cell lines, which represent stage one, stage two, and stage three bladder cancer cell lines. And E6, a normal stage cell line, was used as the reference sample among those three experimental samples. All of these microarray raw datasets are uploaded to the GeneFilter system and analyzed according to the standard analysis flow. We have identified 431 and 656 significant genes from the microarray data produced by A company and G company, respectively. After cross-comparison, we group these genes into five classes as shown below:
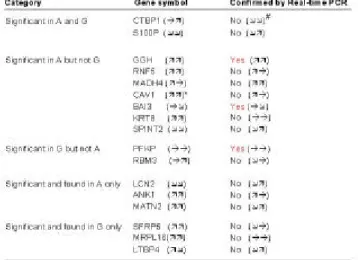
These classes consist of 1) significant genes that are found in A company only (124); 2) significant genes that are found in G company only (323); 3) genes that are significant in A but not in G (290); 4) genes that are significant in G but not in A (315); 5) genes that are significant in both A and G (17). Through analytical discussions with collaborative biologists and statisticians [5], several genes are selected for further real-time PCR confirmation. The results are summarized in Table 1. Among the 17 genes, as we have seen, three genes (GGH, BAI3, and PFKP) can be reconfirmed by real-time PCR in terms of both statistical significance and the expression pattern (Fig. 10).
We have also found some controversial phenomena in comparing the microarray expression patterns with real-time PCR results. Taking CAV1 as an example, its expression is significant in A company’s data but not in G company’s one. However, real-time PCR result reveals that the expression pattern of CAV1 is consistent only with that in G company. Besides, some genes (CTBP1 and S100P) are found to be significant in both companies’ results although they are not reconfirmed by real-time PCR yet. Some genes are reconfirmed only in one stage (S100P, RNF5, MADH4, SPINT2, LCN2 and ANK1), while others are completely discrepant. Hence, some genes can be identified as potential marker for bladder cancer. The above analysis results show the effectiveness of GeneFilter in mining gene e xpression data for analyzing complex diseases.
CONCLUDING REMARKS
In this research, we designed an integrated, web-based and user-friendly analysis platform with high degree of automation for biologists to analysis microarray datasets. A standard analysis flow is provided through integrated modules including data normalization, gene filtering, gene clustering and genes scoring, which can lead
users to find out the interesting genes expression patterns across complex experiments. Meanwhile, the Gene Ontology and pathways information are also provided in the system in integrated way for users to retrieve related biological knowledge.
In real applications, the GeneFilter system has been used to analyze different kinds of diseases like bladder cancer, liver cancer and colon cancer, etc. We have illustrated the application case for analysis of marker genes on bladder cancer. We have successfully found some potential genes related to bladder cancer under different stages, and the high-throughput real-time PCR was also used to validate the analysis results.
In the future, we will keep developing more kinds of data mining modules that can discover more advanced gene expression patterns. Meanwhile, we will develop automatic mechanisms that can re-evaluate and readjust the analysis parameters automatically for obtaining best analysis results. Moreover, we will also develop new validation techniques for validating the mining results by utilizing the real-time PCR results and related biological information so that the analysis results produced by GeneFilter will be more reliable.
ACKNOWLEDGEMENT
This research was partially supported by National Science Council, Taiwan, R.O.C., under grant number NSC92-2321-B006-003. The authors would like to thank the following collaborators in National Cheng Kung University, Taiwan, R.O.C. for their contributions in this research: Dr. Hsiao-Sheng Liu, Dr. Nan-Haw Chow, Dr. Jung-Hsien Chiang, Dr. Chung-Liang Ho, Dr. Shih-Huang Chan, Dr. Jyh-Wei Shin, Dr. Yow-Ling Shiue, Ya -Ping Lin.
REFERENCE
[1] A. Ben-Dor, L. Bruhn, N. Friedman, I. Nachman, M. Schummer, and Z. Yakhini, “Tissue Classification with Gene Expression Profiles,” in J Comput Biol, 7:559--584, 2000.
[2]Amir Ben-Dor and Zohar Yakhini, “Clustering gene expression patterns, ” in Proc. of the 3rd Annual Int’l Conf. on Computational Molecular Biology (RECOMB),1999.
[3] A. Brazma, P. Hingamp, J. Quackenbush, et al., “Minimum information about a microarray experiment (MIAME)— toward standards for microarray data,” in Nature Genetics, 29:365 – 371, 2001.
[4] A.J. Carlisle, V.V. Prabhu, A. Elkahloun, J. Hudson , J.M. Trent, W.M. Linehan, E.D. Williams, M.R. Emmert-Buck, L.A. Liotta, P.J. Munson, and D.B. Krizman, “Development of a prostate cDNA microarray and statistical gene expression analysis package,” in Molecular Carcinogenesis, 27:1-11, 2000.
[5] Shin -Huang Chan and Li-Ju Chen, "An ANCOVA APPROACH TO NORMALIZE MICROARRAY DATA, AND ITS PERFORMANCE TO EXISTING METHODS," in Journal of Bioinformatics and Computaional Biology (JBCB), 2005.
[6] C.C. Chang and C.J. Lin, “LIBSVM: a library for support vector machines,” September 14, 2002. Available on-line: http://www.csie.ntu.edu.tw/ ~cjlin/libsvm.
[7] Jung-Hsien Chiang and Hsu-Chun Yu, “MeKE: discovering the functions of gene products from biomedical literature via sentence alignment,” in Bioinformatics, 19: 1417-1422, 2003.
[8] H.Y. Chuang, H. Liu, S. Brown, C. McMunn-Coffran, C. Kao and D. F. Hsu, “Identifying Significant Genes from Microarray Data,” in Proceedings of BIBE, 2004.
[9] H. Y. Chuang, H.K. Tsai, Y.F. Tsai and C.Y. Kao, “Ranking genes for discriminability on microarray data, ” in Journal of Information Science and Engineering, 19:953-966, 2003.
[10] L. DeRisi, V.R. Iyer, and P.O. Brown, “Exploring the metabolic and genetic control of gene expression on a genomic scale,” in Science, 278:680-685, 1997.
[11] S. Dudoit, Y. H. Yang, T. P. Speed, and M. J. Callow, “Statistical methods for identifying differentially expressed genes in replicated cDNA microarray experiments,” in Statistica Sinica, 12(1):111-139, 2002.
[12] M.B. Eisen, P.T. Spellman, P.O. Brown, and D. Bostein, “Clustering analysis and display of genome-wide expression patterns,” in PNAS, 95:14863-14686, 1998.
[13] A. Grewal and A. Conway, “Tools for Analyzing Microarray Expression Data,” in Journal of Lab Automation, 5(5): 62-64, 2000.
[14] Anil K. Jain and Richard C. Dubes, “Algorithms for Clustering Data,” in Prentice Hall, 1988.
[15] S. Kim, E. R. Dougherty, Y. Chen, K Sivakumar, P. Meltzer, J. M. Trent, and M. Bittner, “Multivariate Measurement of Gene Expression Relationships,” in Genomics, 67(2):201-9, 2000.
[16] M.S. Rajeevan, D.G. Ranamukhaarachchi, S.D. Vernon, E.R. Unger, “Use of real-time quantitative PCR to validate the results of cDNA array and differential display PCR technologies,” in Methods, 25:443-451, 2001
[17] M.S. Rajeevan, S.D. Vernon, N. Taysavang, and E.R. Unger, “Validation of Array-Based Gene Expression Profiles by Real-time (Kinetic) RT -PCR,” in J. Mol. Diagnostics, 3(1):26-30, 2001.
[18] M. Scena, D. Shalon, R.W. Davis, and P.O. Brown, “Quantitative monitoring of gene expression patterns with a complementary DNA microarrays,” Science, 270:467-470, 1995.
[19] Vincent S. M. Tseng and Ching-Ping Kao, “Mining and Validation Gene Expression Patterns: An integrated approach and applications,” in Informatica, 27(1):21-27, 2003.
[20] Vincent S. M. Tseng, L. C. Chen and S. C. Yang, “A Framework for Effective Gene Expression Analysis and Biological Knowledge Discovery,” in Proc. 2003 BISC FLINT-CIBI Int’l Joint Workshop on Soft Computing for Internet and Bioinformatics, Berkeley, USA, 2003.
[21] V.G. Tusher, R. Tibshirani, and G. Chu, “Significance analysis of microarrays applied to the ionizing radiation response,” in Proc Natl Acad Sci USA, 98(9):5116-5121, 2001.
[22] X. Wang, M. J. Hessner, Y. Wu, N. Pati, and S. Ghosh, “Quantitative quality control in microarray experiments and the application in data filtering, normalization and false positive rate prediction,” in Bioinformatics, 19(0): 1-7, 2003.
[23]Yee Hwa Yang, Sandrine Dudoit, Percy Luu and Terry Speed, “Normalization for cDNA Microarray Data,” in SPIE BiOS, San Jose, California, January, 2001.
Fig. 1. The GeneFilter Platform.
Fig. 1
Fig.2 The screenshot of GeneFilter
Fig.3 The querying interface of Gene Query System that are based on CGAP database
(a)
(b)
Fig.5 The nine kinds of gene expression profiling patterns in three stages of bladder cancer
Fig.6 Correlation analysis of gene chips. In this example, the three red curves are three replicates in one chip and the blue curve is the same gene in another one. So, we can find the gene ANK1
has similar patterns in two chips, while ARHE incurs different patterns
(a)
(b)
Fig.8 (a) The querying interface of Gene Ontology (b) The querying result of Gene Ontology in GeneFilter
GGH 0 0.5 1 1.5 2 2.5
RT4/E6 TSGH8301/E6 J82/E6 Sample
Expression Ratio
A comapny G company QPCR
Fig.9 The querying result of some gene’s related pathways
Fig.10 Three genes (BAI3, GGH, and PFKP) are found to be related to progression of bladder cancer and they have similar expression patterns in two different microarray datasets with
Q-PCR validation BAI3 0 2 4 6 8 10 12
RT4/E6 TSGH8301/E6 J82/E6 Sample Expression Ratio A comapny G company QPCR PFKP 0 0.5 1 1.5 2
RT4/E6 TSGH8301/E6 J82/E6 Sample
Expression Ratio
A comapny G company QPCR