Interacting-boson-fermion-approximation
description
of
negative-parity
states
in even-odd
Yb isotopes
S.
T.
HsiehDepartment ofPhysics, National Tsing Hua University, Hsinchu, Taiwan, Republic
of
ChinaD.
S.
ChuuDepartment
of
Electrophysics, National Chiao Tung University, Hsinchu, Taiwan, Republic ofChina (Received 6 March 1991)The negative-parity energy levels ofthe even-odd Yb isotopes, ' Yb, ' 'Yb, ' Yb, ' 'Yb, and ' Yb, are studied systematically within the framework of the extended interacting-boson-fermion-approximation (IBFA)model inwhich one odd fermion iscouplied with a boson core. The boson coreis
described with the IBAmodel but allowing one boson tobreak into a quasifermion pair. The odd fer-mion is assumed to be in one ofthe f7/2 and p3/2 single-particle orbitals while the fermion pair is al-lowed to occupy the single-particle orbit i&3/2 It was found that the negative-parity energy levels of
these even-odd Yb isotopes and the values oftransition quadrupole moments for the ground-state rota-tional band of' Ybcan be reproduced infairly good agreement with the observed data.
I.
INTRODUCTIONRecently, experimental information on even- and odd-mass Yb isotopes has become more abundant [1—
17].
These nuclei fall in the transitional region and have several interesting properties.
For
example, they can as-sume a varietyof
shapes [8]ranging from oblate to super-deformed prolate, and thus the coexistenceof
different nuclear shapes, collective and noncollective rotational modes, is expected. Second, the ytterbium nuclei in this mass region can bear higher angular momentum [1—3,8,11,12].
Furthermore, the energy spacings between the negative-parity levels in some even-odd-mass Yb iso-topes have been observed several anomalous phenomena such as the abrupt shrinking[14,
15]between some adja-cent energy levels and backbendings [3,4]as one plots the momentof
inertia versus the squareof
the angular veloci-ty for yrast bandof
a nucleus. These phenomena might be a resultof
the complicated interplay between the col-lective and single-particle degreesof
freedom induced by the Coriolis decoupling[18].
A generalized calculation within the frameworkof
the two-quasiparticle plus rotor band-mixing model[19]
predicted that the high-spin states are produced by the alignmentsof
the angular mo-mentaof
the decoupled quasiparticles along the collective rotation. Mostof
the high-spin data can be understood, at least qualitatively, in termsof
the cranked shell model [20—22] which assumes aligned high-j nucleons weakly coupled to deformed cores with rather constant deforma-tion parameters. However, the neglectof
variations in deformation from state to state is dangerous in theN=88
—90
transition region between rotational and vari-ational nuclei[9].
Recently, the interacting-boson-approximation (IBA) and interacting-boson-fermion-approximation(IBFA)
models including fermion pair de-greesof
freedom [23—
29] were employed to analyze the positive- and negative-parity high-spin anomalies.It
was found that high-spin states and the back-bendphenome-na could be reproduced quite well.
The negative-parity bands
of
even-odd-mass Yb iso-topes, ' Yb ' Yb,'
Yb, '~'Yb, and ' Yb, are seldom studied in recent years becauseof
their complicated band-crossing patterns. In this work we shall employ the extendedIBFA
modelto
study the energy levelsof
the odd-mass Yb isotopes. These odd-mass nuclei are as-sumed to be described by an odd fermion weakly coupled to a boson core. The boson core is studied with the ex-tendedIBA
by allowing oneof
the bosons tobreak into a fermion quasiparticle pair, usually assigned to a unique-parity intruder orbital with spinj.
In the regionof
well-deformed nuclei, the unique-parity intruder orbital suchas h&&/2 or i]3/2 is the most important because both the
Coriolis antipairing and rotation alignment effects in-crease with increasing angular momentum
[18,29].
How-ever, a recent study on the negative-parity high-spin statesof
N=88
isotones [30]manifested that the orbiti&3/2 is the most important one forthe first back bending.
As a consequence, in this work we restrict the quasiparti-cle pair to be in the i/3/2 single-particle orbit only. The odd nucleon forour even-odd-mass isotopes isassumed to distribute in the f7/2 or p3/2 single-particle orbital. In the present work, the
IBA-1
basis states are used in the boson core. This is because the IBA-1 has been proven[31]
to be a valid approximation in transitional regions far from the closed shell.II.
MODELIn the calculation
of
the negative-parity energy levelsof
the even-odd-mass Yb isotopes,Z
=X=
82 is taken as the core. The pureIBFA
model assumes a valence boson number Nz=
11,
12,14, 15,and 16and a fermion quasi-particle distributed in the single-particle orbitals f7/2 or p3/p for the five nuclides ' Yb, ' Yb, ' 9Yb, ' 'Yb, andYb, respectively. In addition to the pure
IBFA
configuration, we admix the N~
—
1 boson plus 1fermionpair configuration into the model space.
To
be more specific, the model space is spanned by two typesof
basis states, ln,ndpyL j'~TMT& and l[n,'ndp'y'L
',j
' (J)
]L
',j;
JT
MT&,
where n,+nd=N&,
n,'+nd=N~
—
1,j=f7/2
or p3/2,j'=
—",,andJ~4.
TheJ
=0
and 2fermion pair states areexcluded to avoid double counting
of
the states. The Hamiltonian consistsof
four parts,H=H~+HF+
V~F+
Vwhere the
IBA
boson Hamiltonian H~ can be expressed asH~=aond+a,
P
P+a2L L+a3Q
Q .The octupole term T3T3 and hexadecapole term T4T4 have been omitted inHz since they are generally believed tobe less important. The fermion Hamiltonian HF is
HF=QEJa
a~+
—,' V (a~:a.) (a~a )where c.. is the fermion single-particle energy, the V 's are the fermion-fermion interactions, and a~
(a
) is thenucleon creation (annihilation) operator.
The boson-fermion Hamiltonian V~Fthat describes the interaction between the odd quasinucleon and even-even core nucleus contains, in general, many different terms [32] and is rather complicated. However, it has been shown that V~F may very well be approximated by the following three terms
[33,34]:
V~F=aQ&
QF+
g
A~~':[(ajXd)'
'X(d
Xaj')'"']o
':
J,J,
kwhere Q~ isthe boson quadrupole operator;
Qz
=(stXd+dtXd)"'+y(dt
Xd)'
',
and QF isthe fermion quadrupole operator,
and
(::)
indicates that the commutationof
a.
and a is neglected. The SU(3) valueof
y=
—
&7/2
is adopted in this work. The first term in V~F is a quadrupole-quadrupole interaction, while the second term represents an exchange interaction. The originof
the exchange term is due to the interchangeof
the odd quasinucleon with oneof
the nucleons that make up the d boson. The 1ast term in V~F is a monopole interaction, which gives rise to arenormalizationof
the boson energy c.=
cd—
4.
The mixing Hamiltonian V between the sd boson and quasifermion pair is assumed
V
=aQ~ (ata
)''+PQ~
[(atat)'
'd—
dt(a.
a )'']
The radial dependenceof
the fermion potential is taken as the Yukawa type with a Rosenfeld mixture. An oscil-lation constantv=0. 963
' fm with3
=160
is as-sumed. The interaction strengthof
the V 's is adjusted by requiring(
jjl
Vljj
& 2—
(
jj
Vljj
&J0=2
MeV. Thewhole Hamiltonian is then diagonalized in the selected model space.
The odd-mass Yb isotopes ' Yb, ' Yb, ' Yb, '
'Yb,
and ' Yb are assumed as the system with an odd fermion weakly coupled to the even-even boson cores: ' Yb,
Yb, ' Yb, ' Yb,and '
Yb.
To
describe the even-even boson core, the fermion pair degreesof
freedom are taken into account in the traditionalIBA
model by allowing a boson to break into one fermion pair which is assumed to distribute in the single-particle orbit i&3/2 In thepracti-cal practi-calculation, the single-particle energy e(i&3/p) and in-teraction parameters contained in the Hamiltonians H& and
H
are first chosen to reproduce the positive-parity energy spectraof
these five even-even Yb nuclei. After obtaining these parameters, the interaction strengths con-tained in V~F and the single-fermion energy E(p3/2 f7/p)-[the single-particle energy s(f7/2) is set to be zero] were then fitted to the negative-parity energy spectraof
the even-odd Yb nuclei using the following constrains: (1) The single-particle energyof
i,
3/2 and interactionparam-eters contained in H~ and
H
are kept at the same value as those obtained from the fittingof
the positive-parity statesof
even-even Yb nuclei. (2)The parameters a and A are assumed as smooth functionsof
neutron number. (3) The boson energy sd is renormalized as Ed=ed—
6
due to the strengthof
the monopole interaction. (4)The fermion single-particle energies for each isotope are al-lowed to be mass number dependent and are obtained as aresultof
fitting.III.
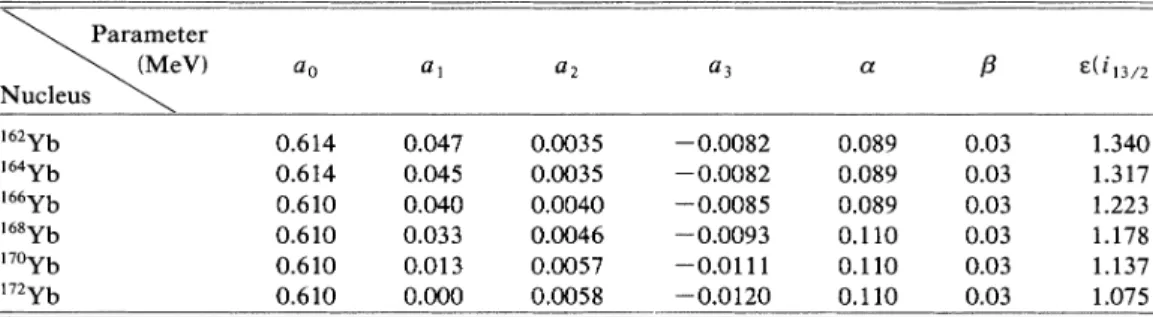
RESULTSThe searched interaction strengths for the even-even Ybnuclei are listed in Table
I.
Note that the mixing pa-rameterP
is kept constant for all Yb isotopes. The major effectof
the mixing parametera
is to mix the boson-configuration-dominated low-lying states with the fer-mion pair states. Since the energy-level spacingsof
the low-lying satesof
these five isotopes are different, conse-quently, the valueof
the mixing parametera
for each iso-topes has to varyto
obtain better agreement between the calculated and observed data. The smallnessof
the mix-ing parametersa
andP
manifest in the mixings between theXz
pure boson configurations and N~—
1 boson plus 2 fermion configurations are small, in general, and seem to be consistent with the general analysisof
the previous work[19].
The other parameters are all varied monoton-ically with the mass number. The decreasingof
single-boson energy Ed(ao) and the increasingof
the strengthof
col-TABLE
I.
Interaction parameters (in MeV) ofthe Hamiltonian for even-even Ybnuclei adopted in this work. ter eV) aoa,
a2 a3 ~~~13/2) 162Yb 164Yb 166Yb 168Yb »OYb 172Yb 0.614 0.614 0.610 0.610 0.610 0.610 0.047 0.045 0.040 0.033 0.013 0.000 0.0035 0.0035 0.0040 0.0046 0.0057 0.0058—
0.0082—
0.0082—
0.0085—
0.0093—
0.0111—
0.0120 0.089 0.089 0.089 0.110 0.110 0.110 0.03 0.03 0.03 0.03 0.03 0.03 1.340 1.317 1.223 1.178 1.137 1.075lective as the boson number increases. This is consistent with the tendency
of
deviating away from U(5) symmetry to SU(3)symmetry. TableII
lists the interaction parame-tersof
the total Hamiltonian for the even-odd Yb iso-topes. The single-particle energye(i,
3/p) and strengthsof
theP"
P
term(a,
),L L
term (a2), andQ.
Qterm (a3)are not shown in TableII
because these values are the same as those used in the corresponding even-even cores. The parameter ao (Ed) varied slightly from thoseof
the corre-sponding even-even core. The variationof
ao comes from the renormalization dueto
the monopole-monopole in-teractions A.The calculated and observed energy spectra for the even-even nuclei ' Yb, ' Yb, ' Yb, ' Yb, and ' Yb are shown in Figs. 1—5. The observed levels with asterisks in Figs. 1 and 2are not included in the g-squares fitting be-cause their spin
or
parity assignments are not quite cer-tain. One can see from the figures that the agreement be-tween the theoretical values and observed data is quite reasonable in general. Recently, the high-spin statesof
Yb have been studied
[1]
using a ' Sn( Ca,4n) reac-tion with a beamof
Caions delivered by the tandem ac-celerator. Positive-parity states with spin up to 30 are as-signed tentatively. Our calculated energy levels shown inFig.
1 for ' Yb agree fairly well with the observed data and are all in correct order except the 122+state, which is obtained too low.For
' Yb high-spin states have been populated in the ' Sm('0,
4n) and ' Sm('0,
4n) reac-tions. The ground-state (g.s.
) band and sideband havebeen established to
I
=22+
and26+.
One can note fromFig.
2 that the calculated values are, in general, able to reproduce the observed data fairly well. Figure 3showsthe calculated and experimental energy spectra
of
'Yb.
The g.s. band can be reproduced quite satisfactorily. However, the shrinking
of
the adjacent levels in the y band cannot obtained reasonably. Especially, the 13&+state is obtained too low and thus causes reversed order with its neighboring states. Figures 4 and 5 show the comparisons between the theoretical energy spectra and their experimental counterparts for nuclei ' Yb and
Yb.
The fittingsof
these two nuclei are very similar to thatof
' Yb. TheirP
and y bands cannot be reproduced as good as their ground-state bands.We also analyze the wave function for each state
of
these even-even Yb isotopes to study the relative intensi-ties
of
the Nz-pure boson configuration and theXz
—
1boson plus 1 fermion pair configuration. The analysis
of
the wave functions shows that the states with
I
~
8+
in the g.s.
bandof
the nucleus ' Yb are dominated by the pure boson configuration. The states withI
)
16+
in the g.s.band are dominated by the configurationof
N—
1bo-son plus 2
i,
3/2 fermions. The mixingof
these twoconfigurations is only observed in the states 10,+ (85.
2%
—14.8%),
12~ (78.4%
—21.6%),
and 142+(55.
1%
—44.9%).
For
' Yb the states withI
(6+
are all dominated()
94%)
with the pure boson configuration, while the levels withI
~
16+
in the g.s.band all states in the sideband are pureXz
—
1 boson plus 1 fermion pair configuration exceptI=142+
(8%
—92%)
and 162+ states(19%
—81%).
For
the g.sband the mixings between these two configurations are only exhibited in the states 8&+(90%
—10%),
10&+(85%
—15%),
12~+(78%
—22%),
and14&+
(68%
—32%).
For
' Yb the pure boson configuration is only dominant in the states withI
(6+
TABLEII.
Interaction parameters (inMeV) ofthe total Hamiltonian foreven-even Ybnucleiadopt-ed inthis work. V) ao &lp3yz
f
7x2 ) 163Yb 165Yb 169Yb 171Yb 173Yb 0.4738 0.4338 0.4425 0.4101 0.3542—
0.1401—
0.1401—
0.1645—
0.200—
0.2558 0.0311 0.0311 0.0252 0.0199 0.0199 0.2431 0.250 0.531 0.576 0.7556—
0.5014—
0.4141 2.00 2.00 3.10IO— 162 38 168 + 28 26
7
24 28+ 26 24' 1210—
36 $4 32'— CD 20-w 5 1812—
2—10— +8—
4 + 2 0 Expt. g.s.
band Theo. 22' 20—— 18 16' 14 12 10+ 8 6+ Expt. Theo. v' band 26++-5
— 22+ 20 18 16 14 2 12lp—
8+ 64 4+0
p+ g.s. band Expt, Theo. 14 13 9~~ yS T6~c 4t 5 2+ Expt. y bond Theo.FIG.
1. Calculated and observed energy spectra for the ' Yb nucleus. The experimental data are taken from Ref.[l].
Thelevels with asterisks are not included inthe y-squares fitting.
FIG.
3. Calculated and observed energy spectra for the ' Yb nucleus. The experimental data are taken from Ref. [5]. Thelevels with asterisks are not included in the y-squares fitting.
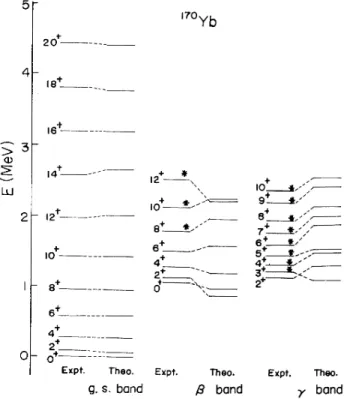
5
r-170 164 204—
186
—
~4 22' 20 16' 14 12 8 6 4+ 2' pV' Expt. Theo g.S. 22g20'
18 16 14 12 + 4 2 0 +5 4Expt. Theo. Fxpt. Theo. Expt. Theo.
s band
p
bond y band14 2 12- 8'-4 2'.
0
—0+ Expt. Theo. g, s. band + lp 6+ 4 2+ 0 Expt. Theo.P
band + 10 9e'
7'
6 5 4f 2+ Expt. Theo. bandFIG.
2. Calculated and observed energy spectra for the ' Yb nucleus. The experimental data are taken from Ref. [2]. Thelevels with asterisks are not included in the g-squares fitting.
FIG.
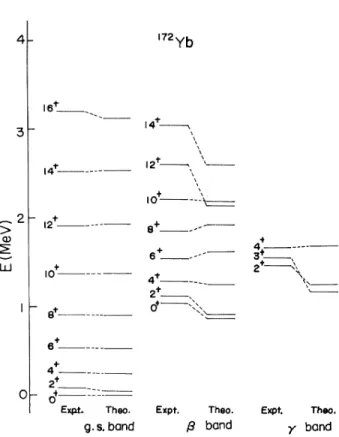
4. Calcu1ated and observed energy spectra for the ' Yb nucleus. The experimental data are taken from Ref. [6]. The levels with asterisks are not included in the y-squares fitting.172
b
TABLE
III.
Relative intensities ofwave functions for energy levels ofthe ' Yband ' Ybnuclei.Nucleus states 17'Yb ~2 I 13/2 172Yb I 13/2 14 14 12
O
CD QJ + IO I — + 8 4 0E~
Theo. g. s.band Expt. Theo.P
band fxpt. Tho. y bQAdFIG.
5. Calculated and observed energy spectra for the"
Yb nucleus. The experimental data are taken from Ref.[7].in the g.s. band
I
~7+
in the y band. The states withI~16+
in the g.s. bandI
~ 11+
in the y band are alldominated with the configuration
of
N—
1 boson plus 2i]3/2 fermion. The mixing
of
these two configurations is prominent only in the states 8&+ (86.7%
—13.
3%),
8q+(71.
3%
—28.
7%),
10t+ (78.9%
—21.
1%),
12~+(68%
—32%),
and 14,+
(53%
—47%).
For
the nuclei ' Yb and ' Yb, the relative intensitiesof
the pure boson and one-fermion pair excitation configurationsof
the wave function for each state are listed in the TablesIII
andIV.
One can note from the tables that in termsof
the relative intensity these states are more dispersive.The calculated and observed negative-parity energy spectra for odd-mass ' Yb, &6s
Yb &69Yb, '
'Yb,
and Yb isotopes are shown in Figs. 6—
11.
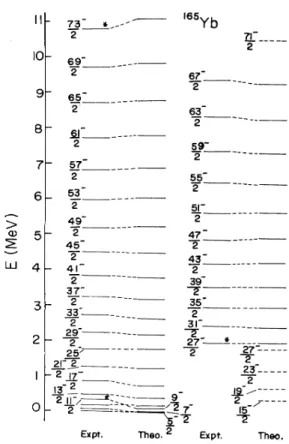
The levels marked with asterisks are not included in the fitting. The dashed levels are the predictions for those yet unobserved levels. There are abundant experimental data observed [6—17]in recent years.For
example, Becketal. [3]
used the adventof
Compton-suppressed multidetector arrays to analyze the triple y-ray coincidence spectra. The negative-parity level schemeof
' Yb up to—
", was as-signed. In Figs. 6—9 the different quasibands are displayed in different columns for clear comparison.For
the nucleus ' Yb,only the yrast band is presented due to scarce and uncertain observed data. One can see from the figures that the calculated energy levels including in the y-squares fitting for odd-mass Yb isotopes agree in general reasonably well with the observed data especially
01 21 41 61 81 101 121 141 161 181 201 02 22 42 62 82 102 122 142 23 31 43 51 63 71 83 91 103 123 143 0.979 0.958 0.944 0.914 0.862 0.782 0.666 0.452 0.001 0.000 0.000 0.959 0.962 0.936 0.862 0.361 0.098 0.000 0.075 0.954 0.942 0.843 0.939 0.194 0.894 0.551 0.007 0.019 0.070 0.064 0.021 0.042 0.056 0.086 0.138 0.218 0.334 0.548 0.999 1.000 1.000 0.041 0.038 0.064 0.138 0.639 0.902 1.000 0.925 0.046 0.058 0.157 0.061 0.806 0.106 0.449 0.993 0.981 0.930 0.936 0.977 0.935 0.936 0.904 0.849 0.768 0.656 0.509 0.006 0.959 0.957 0.918 0.745 0.220 0.099 0.000 0.009 0.952 0.928 0.651 0.921 0.302 0.797 0.122 0.005 0.000 0.000 0.000 0.023 0.047 0.064 0.096 0.151 0.232 0.344 0.491 0.994 0.041 0.043 0.082 0.255 0.780 0.901 1.000 0.991 0.048 0.072 0.349 0.079 0.698 0.203 0.878 0.995 1.000 1.000 1.000
for the g.sband. Figures 6 and 7 show the calculated and observed energy spectra
of
' Yb and 'Yb.
One can note that the calculated levels for these two isotopes are all in correct order and agree reasonably with their exper-imental counterparts, except for very few levels,e.
g.,theand —"
,
states in ' Yb and the —",
state in 'Yb.
For
these states the theoretical level energies obtained are too low. We also present some experimental unobserved states such as the —", ,—
",
and—
", states in ' Yb andthe —", , —", ,
—
", ,—
", ,and—
", states in ' Yb for futureexperimental reference. Figures 8 and 9 present the theoretical and experimental energy levels for ' Yb and '
'Yb.
One can note from the figures that the calculatedstate in ' Yb and '
'Yb
obtained is too high. We need a rather strong exchange interaction in order to lower the calculated excitation energyof
the —,' state,which isthe bandhead
of
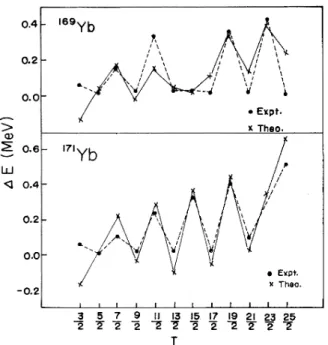
the ground-state band. Howev-er, the strong exchange interaction will make the agree-ment between the calculated and observed energy spectra become worse. From Figs. 8and 9one can also note that anomalous phenomena such as the abrupt shrinkingof
the energy spacings between two adjacent energy levels (signature properties) observed in the —,
'[521]
bandof
Fig-ure 10 shows the calculated and observed energy
differences between two adjacent levels,
EE(I)
=E(I)
E—
(I
—
1), of
the ground-state band —,'[521]
for isotopes ' Yb and '
'Yb.
One can note from the figure that the observed zigzag lines (signature depen-dence) can be fairly well reproduced. Figure 11 shows the calculated and observed energy spectraof
'Yb.
Yoshida et
al.
[26]studied the signature dependenceof
the energy levels and
M1
andE2
transitions in ' Yb in termsof
the interacting boson-fermion model. This nu-cleus was considered as a systemof
an odd fermion cou-pled with the boson core ' Yb described byIBA.
In the workof
Yoshida et al; the fermion pair degreesof
free-dom are not taken into account for the boson core; hence the high-spin states can only be reproduced qualitatively. On the contrary, one can see fromFig.
11 that thehigh-spin levels can be reproduced reasonably well. In order to investigate the contributions
of
the interaction param-eters Ir (Qz Qz term) and A (the exchange term), we set these two parameters to be zero alternatively. The ener-gy spectra obtained by setting~=0
or A,=O
are presentedalso in the
Fig.
11. It
can be seen that a zero A lowers the energy levels significantly, while a zero valueof
rccanmake only aslight deviation from the original result. We also calculate the relative intensities
of
the wave functions for each energy level corresponding tof
7/2 and p3/2 single-fermion orbitals for the odd-mass Yb isotopes.It
is found that all statesof
' Yb, ' 'Yb, and ' Yb are dominated by thef
7i2 single-particle orbital with intensi-ty greater than 96%%uo. However, the intensitiesof
thewave functions for the energy level in the nuclei ' Yb and ' Yb are rather dispersive. Table
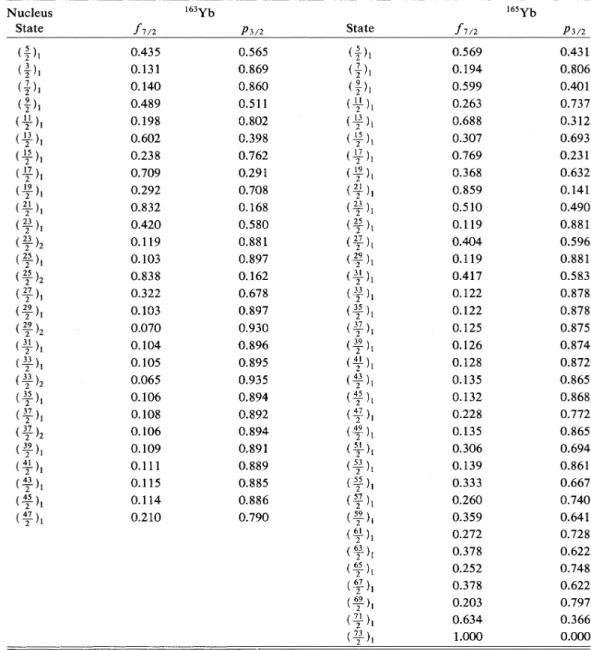
III
lists therela-TABLE IV. Relative intensities ofwave functions forenergy levels ofthe ' Yband ' Yb nuclei. Nucleus State (—,
')I
(-,')(
(—,')I
( & )I 0.435 0.131 0.140 0.489 0.198 0.602 0.238 0.709 0.292 0.832 0.420 0.119 0.103 0.838 0.322 0.103 0.070 0.104 0.105 0.065 0.106 0.108 0.106 0.109 0.111 0.115 0.114 0.210 Yb 0.565 0.869 0.860 0.511 0.802 0.398 0.762 0.291 0.708 0.168 0.580 0.881 0.897 0.162 0.678 0.897 0.930 0.896 0.895 0.935 0.894 0.892 0.894 0.891 0.889 0.885 0.886 0.790 State (—,')I
(—)I (2)& 0.569 0.194 0.599 0.263 0.688 0.307 0.769 0.368 0.859 0.510 0.119 0.404 0.119 0.417 0.122 0.122 0.125 0.126 0.128 0.135 0.132 0.228 0.135 0.306 0.139 0.333 0.260 0.359 0.272 0.378 0.252 0.378 0.203 0.634 1.000 165Yb 0.431 0.806 0.401 0.737 0.312 0.693 0.231 0.632 0.141 0.490 0.881 0.596 0.881 0.583 0.878 0.878 0.875 0.874 0.872 0.865 0.868 0.772 0.865 0.694 0.861 0.667 0.740 0.641 0.728 0.622 0.748 0.622 0.797 0.366 0.0005-
47 45 2 43 24-
41 2 IB3II-2 69 2 65-t65Y 67 2 63 2 39 2 37 2 25 M3 2 3l 2 29
2-2
~
2 25 2 21 2 I —17 219:
2 37 2 29 2 25r
Expt. Theo. 22:
O 2~25
2~'
i Expt. TheoFIG.
6. Calculated and observed energy spectra for the ' 'Yb nucleus. The experimental data are taken from Ref.[11].
Thelevels in dashed lines are the predicted energy levels. The levels with asterisks are not included inthe g-squares fitting.
59 2
7
57 2 55 2 53 2 51 2 49 Q)5
— 2 45 24—
2 37 332-
'2 25 21 I —2~1 13 2IIy0
2 = 47 2 43 2 39 r= 35 2 31—r
27= 2 27r
--
—--
23:----2 ~l 2 15 9 Theo. 2Expt. Expt. Theo.
FICx.7. Calculated and observed energy spectra for the ' Yb nucleus. The experimental data are taken from Refs. [12]and [13].The levels in dashed lines are the predicted energy levels.
The levels with asterisks are not included in the y-squares fitting.
tive intensities
of
the wave functions for these two nuclei. One can see from the table that the mixingof
f7/z and p3/p single-particle orbitals is prominent in mostof
thestates in these two nuclei.
For
' Yb there is experimental information on the transition quadrupole moment[17].
The studyof
these values provides us a good testof
the model wave func-tions. The electric quadrupole operator can be written asT(E2)=e
Qs+e
a(a Xa
)' '+Pe [(a
Xat)'
'Xd
—
dtX(a
Xa.
)'4']''.
J J J J kO 2 23 2 21 2 19 CD / / I / / I I I 17 2 IB9
For
the fermion effective chargee,
an average value0.
37eof
the proton and neutron obtained by Alonso, Arias, and Lozano [28] is adopted. The boson efFective charge in theT(E2)
operator is assumed to be0.
22e, which isclose to the value used in the previous work[35].
The
EI=1
and 2 transition quadrupole moments for the ground-state rotational bandof
' Yb are defined asQ'a
=
[B(E2;I
~I
—
KI
)l[(5/16m )(I2KO~I
am
)']]'",
-where
IC=
—,'
was assumed. The parametersa
andP
areassumed the same values as used in the mixing
Hamil-17 2-15 2 15 2 II 2 2 2 9 7 2 2
5'
f523) -27p
O— 2 a'2 (512) 2 I//2 (52f)Expt. Theo. Expt. Theo. Kxpt Theo
FICi. 8. Calculated and observed energy spectra for the ' Yb nucleus. The experimental data are taken from Ref.[15].
25 2 2I 2 / / / / / / / / / / 25 2 l73YI 2l 2 lgr 2 I3 2 II 2 23 2 2f 2 f9 2 l7 2 l5 2 II 2 l7 2 l5 l3 2 II 2 II/2 {,
505)
23 2 2I 2 l9 I 2 17 2 25 2 27r
2IT
972
2 5 O g-2 2 2 I/2(52I]
Theo. 9 2 7 2 5//2 (5I2) Expt. Expt. Theo,FIG.
9. Calculated and observed energy spectra for the ' 'Yb nucleus. The experimental data are taken from Ref. [16].Thelevels in dashed lines are the predicted energy levels.
II 2 9
7:
o
2 Theo.I KsA 23 ~IT IB ~19Expt. Theo.2 Theo.3
+
II-K=O
2
FIG.
11~ Calculated and observed energy spectra for the' 'Ybnucleus. The experimental data are taken from Ref.[17].
l2-
~Expt. opresent work xRef.[l2]04
169 0.2— ~( 7 /. -/ tl / II / / 0.0 (D&
06-
I7I xTh8o. l2-UJ & o~-0.2— 0.0--0.
2 I I I I I I I I I I eo. 8 CP OJ C3 ~Expt. o Preset cwork x Ref.[Ipj 3 5 7 9 l I I3 I5 l7 l9 2I P$ 25FIG.
10. Calculated and observed energy difterences AE(I)=E(I)
—E(I —
1)for the nuclei ' Yband ' 'Yb. The ex-perimental data are taken from Refs. [15]and [16],respectively. The dashed lines represent the observed values, while the solidlines represent the calculated values inthis work.
I I I I
7 9 II 13 l5 I7 l9 2l 23 25
2 2 2 2 2 2 2
FIG.
12. Calculated and observed transition quadrupole mo-ments for the ' 'Yb nucleus. The experimental data are takenfrom Ref. [18] and references therein. The dashed curves represent the results obtained in this work, and the solid curve
tonian. Since the structure
of
Ybiscloseto
SU(3) sym-metry, the valueof
y
is chosen to be—
&7/2,
which is the value forthe SU(3)group generator. Figure 12 shows the calculated and observed transition quadrupole mo-ments versus the spinsof
the depopulating states. From the figure it can be seen that the parabolic formlike featureof
Q'"
from spin —",
to —",
and the fine vari-ation featureof
Q' ' can be reproducedqualitatively, especially when the dip occurs at
I=
—", , although ourcalculated values exaggerate the dip at
I=
—",
and yield a somewhat larger Q'"
value atI
= —
", . On the con-trary, the previous worksof
Oshima et al.[17]
with the rotating shell model and Yoshida etal.
[26] with theIBFA
model can only obtain nearly Aat curves. IV. SUMMARY AND DISCUSSIONIn summary, we have investigated the negative-parity states
of
the odd-mass ytterbium nuclei in the frameworkof
the extended interacting boson-fermion model. These nuclei are described by coupling an odd fermion to the even-even core. The core is described by theIBA
Hamil-tonian with the fermion pair degreesof
freedom beingtaken into account. That is, one
of
the bosons is allowedto
break into a fermion pair which can occupy the i&3/2single-fermion orbit. The odd quasinucleon is allowed to occupy the 2p3&2 or If7/2 single-particle orbitals. The parameters contained in the core Hamiltonian are chosen to reproduce the positive-energy spectra
of
the corre-sponding even-even Yb isotopes. %'ith this setof
param-eters, the strengthsof
odd fermion single-particle ener-gies and the parameters contained in the fermion Hamil-tonian are then chosen to reproduce the energy spectraof
the even-odd Yb isotopes. The calculated energy levels for the even-even nuclei and even-odd Ybnuclei are all in reasonable agreement with the observed values. Al-though the observed transition quadrupole moments in the odd-mass Yb region are not abundant, our calcula-tion yields good agreement with the observed values. We also analyzed the intensities
of
the wave functions corre-sponding to each single-nucleon orbital for each state.It
is found that the intensities
of
the wave functions for statesof
' Yband ' Ybisotopes are rather dispersive.This work is supported by the National Science Coun-cil
of ROC
under the Grant No. NSC80-0208-M009-13.[1]
J.
N. Mo, S.Sergiwa,R.
Chapman,J.
C.Lisle,E.
Paul,J.
C. Willmott,J.
Hattula, M. Jaaskelainen,J.
Simpson, P. M. Walkert,J.
D.Garrett, G.B.
Hagemann,B.
Herskind, M. A.Riley, and G.Sletten, Nucl. Phys. A472, 295(1987). [2]S.Jonsson, N. Roy, H.Ryde, W.Walus,J.
Kownaccki,J.
D.
Garrett, G.B.
Hagemann,B.
Hersind,R.
Bengtsson, and S.Aberg, Nucl. Phys. A449, 537(1986).[3]E.M. Beck,
J.
C.Bacelar, M. A.Deleplanque,R.
M. Dia-mond,F.
S.Stephens,J.
E.
Draper,B.
Herskind, A.Holm,and P.O.Tjdm, Nucl. Phys. A464, 472(1987).
[4]A.
E.
Ignatochkin, E.N. Shurshikov, and Yu.F.
Jaborov, Nucl. Data Sheets 52, 365(1987).[5] V. S.Shirley, Nucl. Data Sheets 53,223(1988). [6]C.Zhou, Nucl. Data Sheets 50,351(1987). [7]G.Wang, Nucl. Data Sheets 51,577(1987).
[8]T.Byrski,
F.
A. Beck,J.
C.Merdinger, A. Nourreddine, H. W.Cranmer-Gordon, D.V.Elenkov, P. D.Forsyth, D. Howe, M. A. Riley,J.
F.
Sharpey-Schafer,J.
Simpson,J.
Dudek, and W.Nazarewicz, Nucl. Phys. A474, 193(1987). [9] M.P.Fewell, N.R.
Johnson,F.
K.
Mcgowan,J.
S.Hattu-la,
I.
Y. Lee, C.Baktash,Y.
Schutz,J.
C. Wells, L. L. Riedinger, M. W. Guidry, and S. C.Pancholi, Phys. Rev. C 37,101(1988).[10]
R. G.
Helmer, Nucl. Data Sheets 43,1(1984).[11]T.W.Burrows, Nucl. Data Sheets 56, 313 (1989). [12]L.
K.
Peker, Nucl. Data Sheets 50,137(1987). [13]B.
Harmatz, Nucl. Data Sheets 17,143(1976). [14] V. S.Shirley, Nucl. Data Sheets 36,443(1982). [15]V.S.Shirley, Nucl. Data Sheets 43,127(1984). [16]V. S.Shirley, Nucl. Data Sheets 54, 589(1988).[17] M. Oshima, M. Matsuzaki, S.Ichikawa, H. Iimura, H. Kusakari,
T.
Inamura, A. Hashizume, and M. Sugawara, Phys. Rev. C40, 2084(1989).[18]
F.
S. Stephens andR.
S.Simon, Nucl. Phys. A183, 257 (1972).[19]C.Flaum and D.Cline, Phys. Rev.C 14,1224(1976). [20]
R.
Bengtsson and S. Frauendorf, Nucl. Phys. A314, 27(1979);A327, 139(1979).
[21]Y. S. Chen, S. Frauendorf, and L. L. Riedinger, Phys. Lett. B171,7(1986).
[22]M. W.Guidry, C-L.Wu, Z.-P. Li, D.H. Feng, and
J.
N. Ginocchio, Phys. Lett.B187, 210 (1987).[23]A. Arima and
F.
Iachello, Phys. Rev. Lett. 35, 1069 (1975);40, 385 (1978);Ann. Phys. (N.Y.
) 99, 253 (1976); 111,201(1978);121,468(1979).[24]A.Gelberg and A.Zemel, Phys. Rev. C22,937 (1980). [25]
I.
Morrison, A.Faessler, and C.Lima, Nucl. Phys. A372,13(1981).
[26]N. Yoshida, H. Sagawa, T.Otsuka, and A. Arima, Nucl. Phys. A503,90 (1989).
[27]N.Yoshida and A.Arima, Phys. Lett. 164B,231(1985). [28] C.
E.
Alonso,J.
M. Arias, and M. Lozano, Phys. Lett. B177, 130 (1986).
[29]D.S.Chuu and S.
T.
Hsieh, Phys. Rev. C38, 960 (1988). [30]D.
S.Chuu, S.T.Hsieh, and M. M.K.
Yen, Prog. Theor.Phys. 85,271(1991).
[31]H. Harter, A. Gelberg, and P.Von Brentano, Phys. Lett. B157,1(1988).
[32] A.Arima and
F.
Iachello, in Aduances in Nuclear Physics,edited by
J.
W.Negele andE.
Vogt (Plenum, New York, 1984),Vol. 13,p. 139.[33]
F.
Iachello and O. Scholten, Phys. Rev. Lett. 43, 679 (1979).[34]