Kinetics and Mechanism of the NCN + NO
2Reaction Studied by Experiment and Theory
Tsung-Ju Yang,† Niann S. Wang,*,†L. C. Lee,‡Z. F. Xu,§and M. C. Lin*,†,§
Department of Applied Chemistry and Center for Interdisciplinary Molecular Science, Chiao Tung UniVersity, Taiwan 30010, Taiwan, Department of Electrical and Computer Engineering, San Diego State UniVersity, San Diego, California 92182, and Department of Chemistry, Emory UniVersity, Atlanta, Georgia 30322 ReceiVed: June 16, 2008; ReVised Manuscript ReceiVed: August 19, 2008
The rate constant for the NCN + NO2 reaction has been measured by a laser photolysis/laser-induced
fluorescence technique in the temperature range of 260-296 K at pressures between 100 and 500 Torr with He and N2as buffer gases. The NCN radical was produced from the photolysis of NCN3 at 193 nm and
monitored by laser-induced fluorescence with a dye laser at 329.01 nm. The rate constant was found to increase with pressure but decrease with temperature, indicating that the reaction occurs via a long-lived intermediate stabilized by collisions with buffer gas. The reaction mechanism and rate constant are also theoretically predicted for the temperature range of 200-2000 K and the He and N2pressure range of 10-4Torr to 1000 atm based
on dual-channel Rice-Ramsperger-Kassel-Marcus (RRKM) theory with the potential energy surface evaluated at the G2M//B3LYP/6-311+G(d) level. In the low-temperature range (<700 K), the most favorable reaction is the barrierless association channel that leads to the intermediate complex (NCN-NO2). At high
temperature, the direct O-abstraction reaction with a barrier of 9.8 kcal/mol becomes the dominant channel. The rate constant calculated by RRKM theory agrees reasonably well with experimental data.
1. Introduction
The cyanonitrene (NCN) radical has been observed by optical emission and presumed as an intermediate in active-nitrogen hydrocarbon flames long ago by Jennings and Linnett.1 This radical was detected in a microwave discharge of a CF4/N2/He mixture by laser-induced fluorescence (LIF) by Smith et al.,2 who further suggested that this radical could play a significant role in the combustion of nitramine propellants. The LIF technique is a sensitive method to detect this radical in combustion media, and it is applied to kinetic measurement. The importance of how this radical plays in hydrocarbon combustion is well recognized only after Moskaleva et al.3,4 revealed by a computational study that it can be produced by the spin-conserved reaction
CH + N2fcyclic -C(H)NN- f HNCN f H + NCN
This reaction suggests that NCN is the primary product leading to prompt NO formation in the hydrocarbon flame zone.3,4This suggestion was shortly confirmed by Smith,5who observed the presence of NCN in a methane/air flame. The production of NCN from the above reaction has recently been confirmed by Vasudevan et al.,6who detected NCN by optical absorption in heating mixtures of diketene/N2and ethane/N2 behind reflected shock waves. Their experimental data conclude that H + NCN is the dominant (and possibly the only) path for the CH + N2reaction. Recently, Harding et al.7revisited the kinetics of CH + N2with multireference ab initio calculations. They found that the rates of this reaction at varied temperatures are higher than those calculated by Moskaleva and Lin.4The higher reaction rate, resulting from the predicted lower heat of formation of NCN, agrees better with recent experimental data.6,7
This result, in turn, proves that NCN is indeed an important intermediate in hydrocarbon/air combustion media.
Because NCN is a dominant prompt NO formation intermedi-ate, knowledge of its reaction mechanism and kinetics is needed for understanding NO formation in the combustion process. For instance, El bakali et al.8and Lamoureux et al.9have demon-strated that the NO fractions observed in natural gas (a methane/ ethane/propane mixture) flames agree better with the prediction if NCN is included in kinetic modeling. The kinetic data of NCN were almost not known prior to the new prompt NO formation mechanism put forth by Lin and co-workers3,4 in 2000, and the database continues to build up since then. Extensive theoretical calculations for reactions with various combustion species, such as C, H, CHx (x ) 1-3), CN, etc., have been reported by Moskaleva10in her Ph.D. dissertation. Baren and Hershberger11measured the reaction rates of NCN with NO, O2, C2H4, and NO2 in a He buffer gas by the photolysis/LIF technique. The rate constant for the reaction with NO was measured more extensively over the temperature range of 298-573 K at varied He pressures, but for the other reactions, only the upper limits were estimated at 298 K at a low He pressure (<3 Torr). The reaction mechanisms of NCN with NO and NS were investigated by Chen and Ho.12Zhu and Lin have recently investigated the oxidation rates of NCN by O213and O(3P)14 by ab initio calculations with molecular orbital and transition state (TS) theory.
Recently, Huang et al.15have extensively measured the rate constants for the NCN + NO reaction in the presence of He (40-600 Torr) and N2 (30-528 Torr) buffer gases in the temperature range of 254-353 K using the photolysis/LIF technique. The NCN radical was produced from the photodis-sociation of NCN3at 193 nm and monitored by LIF with a dye laser at 329.01 nm. They also calculated the rate constants by dual-channel Rice-Ramsperger-Kassel-Marcus (RRKM) theory based on the potential energy surface (PES) derived by the G2M
* To whom correspondence should be addressed. †Chiao Tung University.
‡San Diego State University. §Emory University.
10.1021/jp805311u CCC: $40.75 2008 American Chemical Society Published on Web 09/25/2008
measured under varied pressures of He and N2(100-500 Torr) in the temperature range of 260-296 K using the experimental setup and the photolysis/LIF technique that we used for measuring the NCN + NO rate constants.15We also calculated the reaction rate constants using the PES evaluated at the G2M// B3LYP/6-311+G(d) level of theory for the reaction of both NCN (3Σ
g-) and NO2(2A1) in the ground state. The results of our calculations are compared with measured experimental data. 2. Experimental Section
2.1. Experimental Setup. The experimental setup for the measurement of reaction rate constants has been described previously.15,18In brief, the reaction cell is a double-walled pyrex flask of volume of about 250 mL. Photolysis and LIF laser beams entered and exited the cell through two pairs of mutually perpendicular baffled side arms and intersected at the center of the cell. The LIF signal was projected through appropriate lenses and an interference filter into a photomultiplier tube (Hamamatsu R1136) mounted at a side window perpendicular to both laser beams. The LIF signal was amplified (Hamamatsu C1053, 5 MHz) and averaged with a gated integrator (Stanford Research System, SR250). The data were stored and analyzed by a computer.
The NCN radical was produced by photolysis of NCN3with an ArF excimer laser at 193 nm (Lambda Physik LEXTRA 50). NCN3 was prepared19 by the reaction of NaN3 + BrCN overnight and then degassed under vacuum before dilution in He or N2. The absorption band for NCN3in the range 160-200 nm is very broad;20 optical excitation at this band mainly dissociates into NCN + N2.20-22 The concentration of NCN3 was determined via absorption of a 184.9 nm Hg line with a 9.8 cm cell in the upstream of the reaction cell. The absorption cross section of 5.7× 10⁻¹⁸cm2at this wavelength20is used to determine the NCN3concentration.
The NCN radical was excited from the ground state, X3Σ
g-(0,01,0), to the excited state, A3Πu(0,20,0), at 329.01 nm by a dye laser (Continuum ND60) that was pumped by a doubled-output Nd:YAG laser (Continuum Surelite). The LIF signal was isolated by an interference filter centered at 330 nm (fwhm ) 10 nm, 15% transmission). A delay/pulse generator (Stanford Research System, DG535) was used to control the firing of photolysis and LIF laser beams and to initiate the boxcar integrator as well. Typically, 30-100 laser shots at a repetition rate of 5-10 Hz were averaged to obtain a single LIF data point.
A radical precursor (NCN3), reactant (NO2), and buffer gas (He or N2) were mixed in a flexible tube (30 cm long) before entering the reactor. The flow velocity (10-20 cm/s) of the gas mixture was adjusted so that the reaction zone was replenished
mixture, respectively.
The initial concentration of NCN radicals is estimated by
[NCN]0) σΦF[NCN3]
whereσ is the absorption cross section (3.6× 10⁻¹⁸cm2)20of NCN3 at 193 nm, Φ is the quantum yield of NCN from photolysis (assumed to be ∼1), and F is the photon flux (photons/cm2) of the ArF laser.
He (99.999%) and N2(99.999%) were used without further purification. NO2 was prepared by slowly reacting NO with excessive O2and stored in 3 atm of O2for 2 days before use. NO2was purified in freeze-pump-thaw cycles and diluted in He to a 2% mixture by a standard gas handling technique before it was used in experiments. Fourier transform infrared (FTIR) spectrometry was used to examine the impurities, mainly NO, in NO2.
2.2. Rate Coefficient Measurement. All kinetic measure-ments were made under pseudo-first-order conditions, with [NO2] more than 200 times greater than [NCN]. The initial concentrations for NCN were kept small, [NCN]0e1× 1012 molecules/cm3, to avoid possible radical-radical reactions and to ensure pseudo-first-order conditions. The rate equation is expressed as
-d ln [NCN] ⁄ dt ) k′) kd+ k′′[NO2]
where k′(in s-1) is the first-order decay coefficient, kdis the radical loss rate coefficient mainly due to diffusion from the detection region, and k′′ is the second-order reaction-rate coefficient of interest.
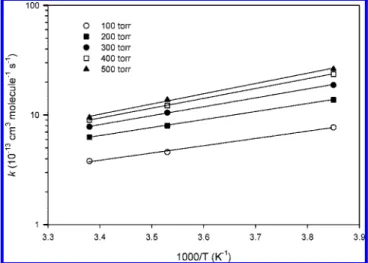
The rate coefficients of the NCN + NO2 reaction were measured in the temperature range of 260-296 K at 100-500 Torr of He or N2pressure. The plots of the pseudo-first-order rate coefficients for k′vs [NO2] at 296 K and He pressures of 100, 200, 300, 400, and 500 Torr are shown in Figure 1. The line slopes give the second-order bimolecular rate coefficients,
k′′, which depend on the third-body pressure. The k′′ values measured at temperatures of 260, 283, and 296 K with He and N2pressures of 100-500 Torr are summarized in Table 1. The k′′ values at 283 K at varied He and N2pressures are further illustrated in Figure 2. As shown in the figure, the k′′ values for N2 are generally larger than those of He, indicating expectedly that N2is more efficient as a third body.
To examine the temperature effect, the k′′ values at three temperatures at varied pressures of He are plotted in Figure 3. The log(k′′) values depend very linearly on T-1 with varying negative slopes at different pressures; thus, they can be fitted by the Arrhenius equation, k′′) A exp(Ea/T).
The Arrhenius parameters derived from fitting the data at He and N2pressures of 100-500 Torr are summarized in Table 2,
where A is in units of cm3/(molecule s) and both E
aand T are in K. The uncertainty shown in Table 2 represents 1 standard deviation in a linear least-squares fit. Both Figure 3 and Table 2 show that the k′′values have negative-temperature dependence, indicating that the NCN + NO2reaction in this low-temperature range is a typical associative one.
2.3. Discussion on Rate Measurements. The presence of NO molecules in the system, as either an impurity or a product
of 193-nm photolysis of NO2or both, might introduce errors in our measurements due to the rapid NCN + NO reaction.15 Efforts to minimize this effect were needed. As stated in the Experimental Section, NO2was stored under a high pressure of O2to ensure that all NO was converted to NO2before use. The impurities, especially NO, were examined by FTIR spectrometry, and the results showed no detectable NO in our NO2samples.
Because the ArF laser is powerful, its photodissociation of NO2may produce substantial photofragments, NO and O, to distort reaction rate measurements. The absorption cross sec-tion23of NO
2at 193 nm is about 7× 10-19cm2, which may totally dissociate into NO and O (i.e.,Φ∼ 1). This cross section is about a factor of 5 smaller than that of NCN3.20However, [NO2] is about 200 times [NCN3], and the [NO] and [O] produced by photodissociation could initially be 40 times as high as [NCN], which may significantly distort the reaction rate measured. However, the laser energy (6.4 eV) is much higher than the dissociation energy of NO2(3.11 eV24), and NO and O may carry initial kinetic energies of about 1.1 and 2.2 eV, which make the initial velocities about 8× 10³and 1.6× 10⁴ m/s, respectively. The photofragments will thus fly fast away from the laser zone (less than 0.2µs), and their concentrations
are quickly diluted to far less than the initial value. Because the dilution time (approximately microseconds) is very short compared to the time frame of kinetic measurement (on the order of milliseconds), the distortion of measured rate constants by photofragments is negligible. This assertion is corroborated by a previous kinetic modeling,25 in which [O] produced from photodissociation of NO2at 193 nm is less than 1% of [NO2]. Under our experimental conditions, [NO]/[NO2] was estimated to be less than 0.004. At 260 K and 400 Torr of N2, the reaction rate constant15 for NCN + NO is 9.75 × 10⁻¹² cm3 /(mole-Figure 1. Plots of the pseudo-first-order decay rates of NCN, k′vs
[NO2] at 296 K, in He pressures of (9) 100, (b) 200, (2) 300, (1) 400, and (() 500 Torr.
Figure 2. Plots of the reaction rate constants of NCN + NO2, k′′vs pressure at 283 K for He (9) and N2(O).
TABLE 1: Experimental Conditions and Bimolecular Rate Coefficients, k′′, of the NCN + NO2Reaction
P (Torr) k′′[10-12cm3/(molecule s)]a T (K) He N2 He N2 296 100 100 0.38 ( 0.03 0.42 ( 0.06 200 200 0.63 ( 0.02 0.73 ( 0.04 300 300 0.78 ( 0.06 0.88 ( 0.11 400 400 0.90 ( 0.09 1.21 ( 0.06 500 500 0.95 ( 0.09 1.44 ( 0.12 283 100 100 0.46 ( 0.04 0.49 ( 0.03 200 200 0.80 ( 0.02 0.90 ( 0.04 300 300 1.05 ( 0.04 1.14 ( 0.03 400 400 1.22 ( 0.03 1.52 ( 0.06 500 500 1.38 ( 0.04 1.89 ( 0.10 260 100 100 0.77 ( 0.05 0.86 ( 0.07 200 200 1.38 ( 0.07 1.55 ( 0.12 300 300 1.88 ( 0.05 1.98 ( 0.15 400 400 2.36 ( 0.07 2.89 ( 0.10 500 500 2.63 ( 0.09 3.74 ( 0.14 aError limits are 1σ.
Figure 3. Arrhenius plots of k′′for He pressures of (O) 100, (9) 200, (b) 300, (0) 400, and (2) 500 Torr.
TABLE 2: Arrhenius Parameters of the NCN + NO2 Reaction at Various Pressures of He and N2[k′′) A exp(Ea/T)]a He N2 P (Torr) A [10-15 cm3/(molecule s)] Ea (K) A [10-15 cm3/(molecule s)] Ea (K) 100 2.12 ( 0.80 1530 ( 103 2.01 ( 1.56 1570 ( 199 200 2.10 ( 0.38 1686 ( 51 2.93 ( 1.04 1628 ( 96 300 1.37 ( 0.07 1878 ( 13 2.47 ( 0.22 1738 ( 24 400 0.83 ( 0.11 2068 ( 37 1.99 ( 1.08 1889 ( 145 500 0.65 ( 0.20 2166 ( 85 1.34 ( 0.53 2061 ( 106 aError limits are 1σ.
cule s), which is 3.4 times faster than that of NCN + NO2. A 0.4% NO impurity in NO2would introduce an error of 1.4% in our measurements, which is within the quoted error limits. No further correction would be necessary. Another possible NO source in the system was an impurity in NO2. Our FTIR measurements showed that they were less than those from photodissociation of NO2and hence would introduce a negligible error in the measured rate constants.
The bond energy of NCN-N2 is quite low (0.3 eV).20 However, this molecule is so complex that it may mainly dissociate into electronically and/or vibrationally exicited species;20,21thus, NCN may not move as fast as NO and O, so it can stay in the laser zone for kinetic measurement. The excited species should be quickly quenched to the ground state by a buffer gas. This assertion is corroborated by the fact that [NCN] in the ground state was observed to decay by pseudo-first-order kinetics in all of our measurements.
The NCN + NO2reaction has been investigated only once by Baren and Hershberger.11NCN was produced by photolysis of CH2N2+ C2N2 with a ArF excimer laser at 193 nm and detected by the LIF technique. They found that the reaction rate constant at 298 K and 3 Torr of He was very small; the upper limit of 1.5× 10⁻¹⁴ cm3/(molecule s) was given.11We did not do the measurement at such a low pressure, but the data in Figure 2 show that the k′′value at low pressure is indeed very low. Our data are compared with theoretical calculations as described below.
3. Computational Section
3.1. Computational Methods. The geometric parameters of the reactants, products, TSs, and molecular complexes of the NCN + NO2 reaction system are optimized at the spin-unrestricted B3LYP/6-311+G(d) level of theory.26-29All of the stationary points were identified for local minima and TSs by vibrational analysis. Intrinsic reaction-coordinate analyses30,31 were performed to confirm the connections of TSs with designated reactants, products, and intermediates. On the basis of the optimized geometries, higher level single-point energy calculations with the stationary points were performed by the
G2M(CC5) method,32which calculated the base energy at the MP4/6-311G(d, p) level of theory and improved with the expanded basis set and the coupled cluster method as well as “higher level corrections (HLC)”. All electronic structure calculations were performed with the GAUSSIAN 03 program.33 The rate constant for the barrierless association reaction that produces the NCNNO2complex was calculated by the VARI-FLEX program34based on the microcanonical RRKM theory.35-38 The component rates were evaluated at the E/J-resolved level, and the pressure dependence was treated by one-dimensional master equation calculations using the Boltzmann probability of the complex for the J distribution. For the barrierless association/decomposition process, the fitted Morse function was used to approximate the minimum potential energy path. The Lennard-Jones parameters (ε/k ) 304 K and σ ) 4.44 Å)
required for the collisional stabilization of the excited NCNNO2 complex were computed from the NCNNO2-He molecular interaction potential predicted at the B3LYP/6-311+G(d,p) level similar to the analogous NCN + NO reaction.15The Lennard-Jones parameters for He and N2were taken from the literature.39 The averaged step sizes for energy transfer per collision, 〈∆E〉down, for He and N2were taken to be 150 and 250 cm-1, respectively.
3.2. Reaction Potential Surface. The geometric parameters of the reactants, intermediates, and TSs optimized at the B3LYP/ 6-311+G(d) level of theory are shown in Figure 4. The relative potential energy diagram obtained at the G2M level based on the optimized structures is drawn in Figure 5. The intermediate complex LM0 is readily formed barrierlessly from the reactants NCN (3Σ
g-) and NO2(2A1) as shown Figure 5, where the NCN in the ground state,3Σ
g-, is designated as3NCN. The barrierless association minimum energy path is presented by the Morse function, V(R) ) 22.7{1 - exp[-5.015(R - 1.595)]}2, as shown in Figure 6. LM0 is in a planar symmetry of2A′′, and it is 19.4 kcal/mol below the reactants. It can isomerize into the complex LM1 (2A′) of 3.1 kcal/mol energy below the reactants via a rotational TS0 with a potential barrier of 18.5 kcal/mol. NCO + NNO can be produced from LM1 via TS3, LM2, and TS4, which are four-membered ring structures. The energies of TS3, Figure 4. Geometric parameters of reactants, intermediates, and TSs optimized at the B3LYP/6-311+G(d) level of theory (in units of angstroms
LM2, and TS4 relative to the reactants are 8.2, -4.5, and 4.4 kcal/mol, respectively, and the formation of NCO + NNO is an exothermal process of 69.6 kcal/mol. Another reaction product, CNO + NNO, can be formed with higher barriers of five-membered ring structures from LM1 via TS5, LM3, and TS6, which have the relative energies of 25.2, 15.1, and 36.8 kcal/mol, respectively. The formation of CNO + NNO is an exothermal process of 7 kcal/mol. In addition to the association/isomerization decomposition channels, Figure 5 also shows two direct O-abstraction processes that produce the NCNO + NO products via TS1 and TS2, which are isomers with barriers of 9.8 and 22.1 kcal/mol, respectively. The energy level for the products, NCNO + NO, is lower than that of the reactants by 22.9 kcal/mol. The reaction channel for NCN (1∆
g) in the first excited state (designated as 1NCN) is also shown in Figure 5.
3.3. Rate Constant Prediction. The rate constants are calculated based on the above PES using the VARIFLEX program34in the temperature range from 200 to 2000 K and in the pressure range from 10-4 Torr to 1000 atm. Overall, the most favorable reaction channels are
3
NCN + NO2fLM0 f LM1 f LM2 f NCO + NNO
(1)
3
NCN + NO2fNCNO + NO (2)
In channel (1), the decomposition of LM0 into the products NCO + NNO is controlled by TS3; thus, TS0 and LM1 can be ignored in the rate constant calculations. The k(LM0) and
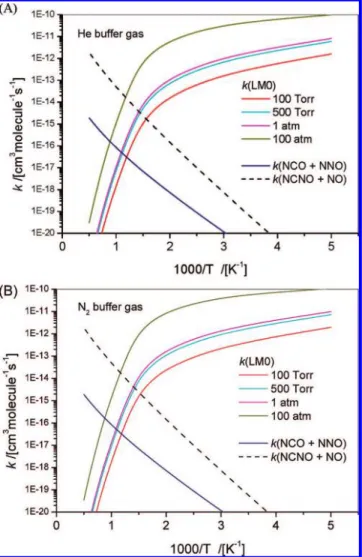
k(NCO+NNO) values calculated at the He and N2buffer-gas pressures of 100 Torr to 100 atm are plotted as a function of the temperature in Figure 7. The k(LM0) values increase with pressure but decrease with temperature. This positive-pressure and negative-temperature dependence effect is typical for an associative reaction. The k(NCO+NNO) values are independent of pressure but increase more than 5 orders of magnitude when the temperature increases from 300 to 2000 K. This is consistent with the calculated PES that the NCO + NNO products produced in channel (11) go through a potential barrier. As shown in Figure 7, the k(NCO+NNO) value is much less than those of k(LM0) at low temperature (<1000 K), but it increases systematically at high temperature.
The rate constant for NCNO + NO production by channel (2) is also shown in Figure 7 by the long-dashed curve. This direct O-abstraction reaction does not depend on buffer gas pressure, but it increases more than 12 orders of magnitude when the temperature increases from 200 to 2000 K. This positive-Figure 5. PES of3NCN + NO
2at the G2M//B3LYP/6-311+G(d) level of theory (in units of kilocalories per mole). Those of1NCN + NO
2 are also included.
Figure 6. Morse function, V(R), for the minimum energy path of the
association process,3NCN + NO
2fLM0, at the B3LYP/6-311+G(d) level of theory.
Figure 7. Calculated rate constants for the formation of LM0 and NCO
+ NNO via LM0 and NCNO + NO by direct abstraction: (A) He buffer gas and (B) N2buffer gas at varied pressures as indicated.
k0(He) ) 7.58×10²⁰T-18.22exp(-4354 ⁄ T)
cm6⁄ (molecule2s) (200-2000 K)
k0(N2) ) 2.09×10²²T-18.63exp(-4532 ⁄ T)
cm6⁄ (molecule2s) (200-2000 K)
The rate constant for the direct abstraction channel (2) can be represented by
k(NCNO+NO) ) 1.22×10⁻¹¹exp(-5463 ⁄ T)
cm3⁄ (molecule s) (200-2000 K)
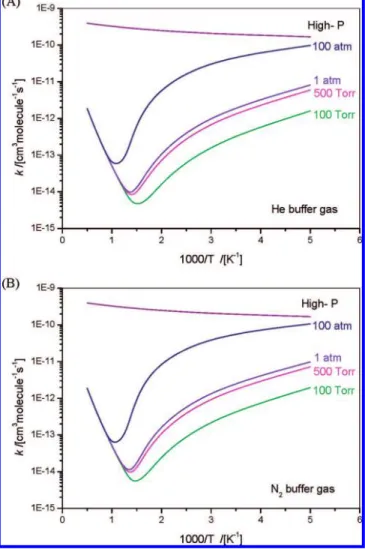
The total rate constants (kt) calculated at indicated buffer pressures, including the high-pressure limit, are shown in Figure 8. As shown in the figure for the P and T effects, the ktcurve for every pressure shows a minimum, resulting effectively from a combination of redissociation and stabilization of the excited NCN-NO2 intermediate and the direct abstraction reaction giving NCNO + NO. The minimum shifts to higher temperature when the pressure increases. The ktvalues at low temperature increase with pressure because they are mainly contributed from
k(LM0). On the other hand, the ktvalues at high temperature do not depend on the pressure because they are mainly due to contribution from the abstraction rate constant k(NCNO+NO). As shown in Figure 8, at the high-pressure limit, the rate constant increases moderately with temperature in the whole range because the partition function of the loose association TS increases more rapidly with temperature than those of the reactants.
This product relation is further illustrated by the branching ratios calculated for producing LM0 and NCNO + NO at He buffer gas pressures of 10 Torr, 1 atm, and 10 atm, as shown in Figure 9. The branching ratio is almost equal to 1 for k(LM0) at low temperature and equal to 1 for k(NCNO+NO) at high temperature. The crossing points at the branching ratio of 0.5 are about 560, 700, and 780 K, when the He pressures are at 10 Torr, 1 atm, and 10 atm, respectively. This shift of the branching ratio to higher temperature can be explained again by the competition between stabilization and NCNO abstraction product formation.
4. Discussion
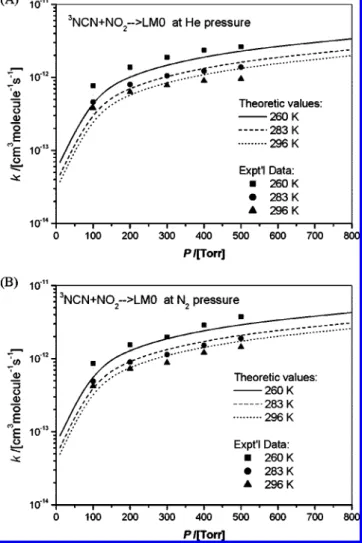
The measured rate constants and calculated values are compared in Figures 10 and 11 as functions of pressure and temperature, respectively. Because our measurements were performed in the low-temperature range of 260-296 K, the major product is LM0 (NCNNO2) as alluded to above. Because of the high barriers for the formation of decomposition products NCO + N2O via NCNNO2and the direct abstraction products,
NCNO + NO, their appearance can occur only at T > 700 K; at such high temperature, the radical precursor NCN3 is too unstable for kinetic studies. Both Figures 10 and 11 indicate that the observed P and T effects on ktcan be quite reasonably accounted for by the ab initio molecular orbital statistical RRKM theory calculations, similar to the NCN + NO case.15
It is of interest to compare the current rate constants with those of other reactants available in the literature. At 2000 K Figure 8. Calculated total rate constants of the NCN + NO2reaction at varied pressures as indicated: (A) He buffer gas; (B) N2buffer gas.
Figure 9. Calculated branching ratios for the production of LM0 and
and∼ 1 atm pressure, the total rate constant, kt, for the NCN + NO2reaction is predicted to be 1.9× 10⁻¹²cm3/(molecule s). This is much larger than the ktvalue of 7.2× 10⁻¹⁶ cm3/ (molecule s) predicted for the NCN + O2reaction13under the same temperature and pressure conditions, but it is much smaller than that of the NCN + O reaction, 1.3× 10⁻¹⁰cm3/(molecule s).14These results show that NO
2is much more reactive than O2but much less than O, as one would expect.
At 296 K and 300 Torr of He pressure, the association rate constant for NCN + NO2is 7.8× 10⁻¹³cm3/(molecule s), as shown in Table 1. Interestingly, this value is smaller than that of the NCN + NO reaction, 6.7× 10⁻¹²cm3/(molecule s), under the same temperature and pressure conditions.11Similarly, at 296 K and 400 Torr of N2pressure, the association rate constant for NCN + NO2is 1.2× 10⁻¹² cm3 /(molecule s), which is smaller than that of 7.4× 10⁻¹²cm3/(molecule s) for the NCN + NO reaction under the same temperature and pressure conditions.15Because both reactions take place by the barrierless association mechanism, the apparent higher reactivity of NCN toward NO than NO2actually reflects the higher stability of the NCNNO intermediate (31 kcal/mol for trans-NCNNO and 22 kcal/mol for cis-NCNNO)15than NCNNO
2(19 kcal/mol as shown in Figure 5). The higher stability of NCNNO is expected to have a smaller redissociation rate, which, in turn, gives rise to a higher stabilization and overall rate constant.
5. Conclusion
The kinetics and mechanism for the NCN + NO2reaction have been investigated experimentally and computationally. In our measured temperature range of 260-296 K, the reaction was found to be strongly and positively dependent on the pressure and negatively dependent on the temperature. The observed pressure and temperature effects can be reasonably accounted for by the results of a dual-channel RRKM calcula-tion, with the predicted mechanism initially taking place via a moderately strongly bonded NCNNO2intermediate in the2A′′ state. The reaction rate constant for the NCNO + NO products by direct abstraction is calculated to be about 3 orders of magnitude higher than that for NCO + N2O formation via NCNNO2in the temperature range of 200-2000 K. Although the constant for the production of NCNO + NO is smaller than of the association reaction at low temperatures (<700 K), this O-abstraction channel is predicted to be dominant at high temperatures, for example, under nitramine propellant combus-tion condicombus-tions.
Acknowledgment. L.C.L. and M.C.L. acknowledge the National Science Council of Taiwan for support of their visiting professorships at Taiwan National Chiao Tung University. Z.F.X. is grateful for partial support from the U.S. Office of Naval Research under Grant N00014-02-1-0133. T.-J.Y. and N.S.W. thank the National Science Council of Taiwan (Contract NSC 95-2113-M-009-028) for support.
Figure 10. Comparison of the calculated rate constants with
experi-mental data at 260, 283, and 296 K for (A) He buffer gas and (B) N2 buffer gas.
Figure 11. Comparison of calculated rate constants with experimental
data at 100, 300, and 500 Torr for (A) He buffer gas and (B) N2buffer gas.
(12) Chen, H. T.; Ho, J. J. J. Phys. Chem. A 2005, 109, 2564. (13) Zhu, R. S.; Lin, M. C. Int. J. Chem. Kinet. 2005, 37, 593. (14) Zhu, R. S.; Lin, M. C. J. Phys. Chem. A 2007, 111, 6766. (15) Huang, C. L.; Tseng, S. Y.; Wang, T. Y.; Wang, N. S.; Xu, Z. F.; Lin, M. C. J. Chem. Phys. 2005, 122, 184321.
(16) Odell, C. R.; Miller, C. O.; Cochran, A. L.; Cochran, W. D.; Opal, C. B.; Barker, R. S. Astrophys. J. 1991, 368, 616.
(17) Bernard, D. J.; Linnen, C.; Harker, A.; Michels, H. H.; Addison, J. B.; Ondercin, R. J. Phys. Chem. B 1998, 102, 6010.
(18) You, Y. Y.; Wang, N. S. J. Chin. Chem. Soc. 1993, 40, 337. (19) Milligan, D. E.; Jacox, M. E.; Bass, A. M. J. Chem. Phys. 1965, 43, 3149.
(20) Okabe, H.; Mele, A. J. Chem. Phys. 1969, 51, 2100. (21) Kroto, H. W. J. Chem. Phys. 1966, 44, 831.
(22) Pontrelli, G. J.; Anastassiou, A. G. J. Chem. Phys. 1965, 42, 3735.
J. V.; Baboul, A. G.; Stefanov, B. B.; Liu, G.; Liashenko, A.; Piskorz, P.; Komaromi, I.; Gomperts, R.; Martin, R. L.; Fox, D. J.; Keith, T.; AlLaham, M. A.; Peng, C. Y.; Nanayakkara, A.; Gonzalez, C.; Challacombe, M.; Gill, P. M. W.; Johnson, B. G.; Chen, W.; Wong, M. W.; Andres, J. L.; HeadGordon, M.; Replogle, E. S.; Pople, J. A. GAUSSIAN 03, revision A.9; Gaussian, Inc.: Pittsburgh, PA, 1998.
(34) Klippenstein, S. J.; Wagner, A. F.; Dunbar, R. C.; Wardlaw, D. M.; Robertson, S. H. VARIFLEX, version 1.00; 1999.
(35) Wardlaw, D. M.; Marcus, R. A. Chem. Phys. Lett. 1984, 110, 230. (36) Wardlaw, D. M.; Marcus, R. A. J. Chem. Phys. 1985, 83, 3462. (37) Klippenstein, S. J. J. Chem. Phys. 1992, 96, 367.
(38) Klippenstein, S. J.; Marcus, R. A. J. Chem. Phys. 1987, 87, 3410. (39) Mourits, F. M.; Rummens, F. H. A. Can. J. Chem. 1977, 55, 3007. JP805311U