How much can we trust test scores?
Kay Cheng SOH
Singapore
Abstract
Assessment plays a critical role in students’ lives. Due to the relative nature of educational measures, test results may be highly fallible and cannot be treated as if they are error-free. This paper illustrates several ways in which test scores can be misinterpreted thus leading to no small consequences on students, and how to get around them.
Keywords
assessment, examination, interpretation of test scores, score transformation, score reliability
“The reliability of our national assessments is simply not good enough to warrant the trust that is placed in them. And one day, people are going to find this out.”
The above quote from Dylan Wiliam (2000) comments on the British examination systems. Hong Kong and Singapore, both being ex-colonies, have inherited some elements of the British education system with much emphasis on examinations. Added to this is the historical influence of the Chinese imperial selection examination and the culture of valuing education as a mean to social upward mobility. A question that can be asked is whether Wiliam’s comment applies to Hong Kong and Singapore, or even East Asian nations like Japan, Korea, and Taiwan where much emphasis and a lot of premium have been placed on test scores, especially for administrative purposes such as selection, channeling, and certification. Naturally, test scores are taken very seriously by school administrators, teachers, and parents alike because employers and the public are doing the same. The questions arising from this situation are: Are we too serious about test scores? Should we not take them with a pinch of salt?
current context of teaching and assessment. It also suggests six axioms following which teachers can more appropriately interpret test scores and use them more cautiously to help in guiding students’ learning.
Assessment of and for learning
In recent years, there has been much discussion on assessment of learning versus
assessment for learning. The two approaches to assessment have different purposes, function, and procedures (Australian Education Services, n.d.). The emphasis on assessment for learning is a fairly new phenomenon in education as compared with the traditional focus on assessment of learning.
Assessments often yield results test scores or grades which are supposed to indicate students’ learning – both achievement and difficulties. Information encoded in test scores tells about students’ learning after instruction is summative in nature. When scores are used for making decisions which have long-ranging effects on the students’ future educational opportunities, they are said to be high-stakes in nature. In this sense, this is
assessment of learning which is by tradition almost the only purpose of examinations. Assessment is summative and retrospective, and is a measure of the product of learning. It can also provide information about the students’ learning as a process. When looked at this way, the information tells where learning has taken place and where corrective instruction by teachers and further efforts by students are needed. Through this latter practice of
assessment for learning, assessment outcomes are used diagnostically and dynamically to guide further instruction and learning. Its nature is therefore formative and forward-looking.
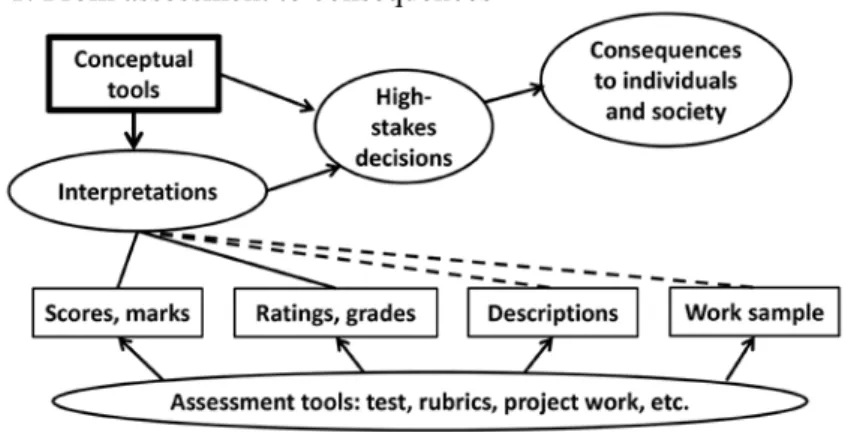
Although distinction can be made between summative assessment (of learning) and formative assessment (for learning), the fact is that from gathering assessment data to using the data is a long process and its impact can take a long time to actualize (Figure 1). Take for example, students are assessed by teachers using assessment tools such as tests, rubrics, projects, etc. Assessment outcomes are encoded and recorded as scores, marks, ratings, grades, descriptions, and work samples and labeled with descriptors such as excellenct, good, etc. by teachers using some conceptual tools (e.g., average, passing marks, acceptable grades). Some of the decisions are formative and useful for guiding further instruction and learning. Others are summative and associated with high-stakes “standards” for channeling, streaming, or tracking – basically, grouping pupils for further instruction.
This long process (Figure 1) may happen within a year, as in school-based examinations for re-organizing students at the next higher class level. It may continue for a few years, as in the cases of the Primary School Leaving Examination (PSLE) in Singapore or Diploma in Secondary Education (DSE) examination in Hong Kong. It does
not really matter whether one or more years are needed, as the process and its effects on pupils are similar or even the same.
Figure 1: From assessment to consequences
Test scores are used for decision-making. First, assessment of learning is high-stakes in nature and has long-term, irreversible consequences. Secondly, assessment for learning is for facilitating learning. In between the gathering of assessment outcomes and decision-making, there are several intervening steps. If the conceptual tools are not available to test score users (i.e. teachers, school administrators, curriculum developers) and the interpretation is improper, decisions will be irrelevant or even misleading. These mean a waste of resources in terms of time and efforts of both teachers and students. Test scores therefore should be cautiously interpreted, and statistical concepts are important assessment tools for this purpose.
If learning is seen as a continuous, long journey through the educational highway from primary school to university, then end-of-year school examinations and end-of-stage examinations (such as the PSLE or the DSE examination) are used not only retrospectively to sum up what has taken place but can also act predictors and guides for further learning. In a broader sense, the dual function of assessment can break down the distinction between formative and summative assessments. One can go even further to doubt whether assessment at the end of each school year and each schooling stage is really summative or formative. With these concerns in mind, the six axioms are proposed below for enhancing the proper interpretation and use of assessment outcomes:
1. A score standing alone has no meaning. 2. Same scores may have different meanings. 3. A small difference makes no difference. 4. Weights may be non-functioning. 5. Assessors may be unreliable.
Axiom no. 1: A score standing alone has no meaning
When Albert scores 75 for his English assessment, what does this mean? Several interpretations readily come to mind:
1. He is far above the passing mark of 50; he has done well. 2. He is far below the perfect mark of 100; he has done poorly.
The same mark leads to two different views because of two different expectations. If more information is available, interpretations will change:
3. The class mean is 75; Albert is average.
4. Albert’s score is 30 marks higher than the class’s lowest score of 45; well done. 5. Albert’s score is 5 marks lower than the class’s highest score of 80; could have
done better.
If the teacher has set a criterion score of, say, 70 (based on some reasonable grounds or past experience), then:
6. Albert has passed the test.
What can we conclude from the above? A score standing alone has no fixed meanings; its meaning is dependent on reference to other relevant information. The first two interpretations made with reference to subjective expectations (of the teacher, Albert himself or his parents) are arbitrary in nature and hence should be avoided. The next three interpretations are made with reference to how his classmates performed in the same test. This is known as norm-referenced interpretation. The sixth interpretation is made with reference to a pre-set cut-score (which preferably has an empirical basis); it is a
criterion-referenced interpretation and is the basis for the development of a very large number of standardized tests, especially in the USA.
Standardized tests
A standardized test (say, of Mathematics) has to go through many steps to develop such as: (1) identifying the instructional objectives, that is, mathematical knowledge and competencies to be assessed; (2) writing items for the identified objectives; (3) trialling the items with a large group of students for whom the test is meant; (4) conducting item-analysis to assess the efficacies of the trialed items; (4) selecting items which have been found to work well; (5) collecting data from another large group of students for whom the test is meant; (6) using the data to compile test norms (tables showing scores and the numbers of students getting each score); (7) releasing the finalised version; and (8) revising the test after, say, five years. These steps are not only time-consuming and labour-intensive but also require the collaboration of content specialists and assessment
experts, and of course teachers and students. No wonder test development has become a gigantic business in the USA dominated by a few organizations (e.g., the Educational Testing Service in Princeton). For a discussion on the advantages and disadvantages of standardized testing, see Is the use of standardized tests improving education in America? (ProCon.org, n.d.).
If Albert has taken a standardized test of Mathematics, his score is compared with the very large group of students whose scores were used to compile the test norm. Then, his score may get him an equivalent T-score (a kind of standard score). And, what does this T-score mean? Why should we use it?
Standard scores
A T-score is a kind of standardized score peculiar to educational assessment. It is peculiar because of the relative nature of scores obtained by using educational measures as contrasted with physical measures (e.g., weight, height). Take Albert’s score of 75 for example. It is not a fixed quantity of a fixed quality like his weight and height for which there are standard instruments such as a weighing machine or a standard ruler. Albert’s score is relative (to the normation group) although such scores are always mistakenly seen as absolute. For a fuller explanation of what standard scores are, see Transformed scores –
Standard scores (Mypage, n.d.).
Let’s say the test taken by Albert is a 100-word spelling test. He gets 75 because he can spell three-quarters of the words correctly. This looks fine until he takes another spelling test consisting of 100 easier words. In this case, he may get 85, 95, or even 100. The converse is also true if the words are more difficult. In short, Albert’s score will vary with the tests (words) used to assess his spelling ability. Because of this, a different way of indexing Albert’s spelling ability is to compare him with other students who have taken the same test and interpret his score according to where he stands among the peers. Thus, instead of just saying how good he is in terms of the number of words he spells correctly, we can know how much better or worse his performance is when compared with the norm (documented as the norm table). This is where the T-score becomes helpful.
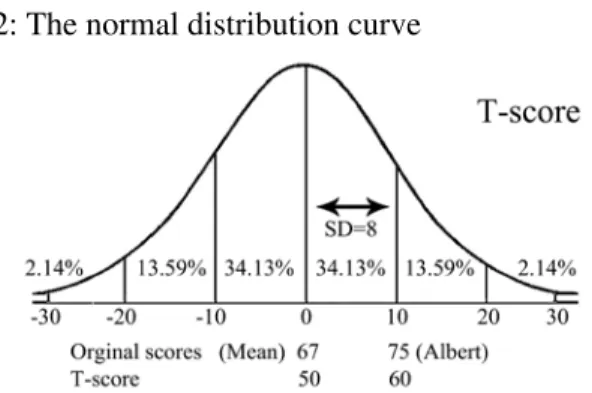
When a standardized test is developed, the norm group of students has different scores, some very low, others very high, and most somewhere in between. For these scores, a mean (average) can be calculated as the “centre”. Since not all students get the same score, there is a need to describe how widely spread from the mean the scores are. For this, standard deviation (SD) is calculated. If the group mean is 67, then, Albert deviates from the mean by +8 and the SD of the scores happens to be 8, then, his score is one SD above the mean. This gives him a z-score of 1.00; z-score is another kind of standard score that will be explained later.
recording purposes. How to explain to parents that their children get negative scores (owing the teacher some marks?) is a major challenge. Besides, for different sets of test scores, standard deviations (SDs) are not the same. To overcome these problems, measurement experts come up with the bright idea of T-scores.
From z-scores to T-scores
The T-scores form a scale with a mean of 50 and a SD of 10. This is a scale universally agreed upon and used by measurement experts and so all tests can then have their original scores converted to it. An added advantage of using T-scores is that all scores from different tests can be considered “comparable”. If the set of English Language scores (including Albert’s 75) has a mean of 67 and a SD of 8, then Albert’s 75 is now converted according to the formula to a T-score of 60 (i.e., T-score = 50+10*(Score - Mean)/SD = 50+10*(75 - 60)/8) = 60).
Aha! Have we not short-changed Albert by giving him a T-score of 60 which looks lower than his original raw score of 75? No. The conversion of original scores (those given by the test) to T-scores is like converting SGD or HKD to USD, using the appropriate currency exchange rate. The face value has changed but the buying power remains the same. So, Albert has not been short-changed. In this case, his T-score of 60 has placed him one SD above the mean of 50 and, according to the normal distribution (Figure 2), he is better than 84% of students in his class (i.e., 50% below the mean and 34% between the mean and one SD above it). Another way is to say that he stands at the 84th percentile and belongs to the top 16% of the students. So, by comparing with his peers, Albert has done pretty well (Figure 2).
Figure 2: The normal distribution curve
Thus, as you must have suspected by now, converting original scores to T-scores in actuality can change the basis of comparison and hence the interpretation of test results. As pointed out above, if Albert’s score of 75 for spelling test represents correctly spelling three-quarters of the 100 words, his score will be different when the words in the test change. But then, we argue. The idea is that Albert’s spelling ability at the time of testing is a fixed quality and should not vary with the test used and the same should go for his
peers – their ability should not change with different tests. However, we know that this is not true when different tests are used. By using T-scores, we can assess Albert in terms of his relative position (percentile) among his peers. When a more difficult spelling list is used, all pupils should get lower scores than previously, but their positions relative to one another should logically remain unchanged. This is an assumed advantage of using T-scores instead of the original raw scores.
Axiom no. 2: Same scores may have different meanings
The above examples show clearly that the use of raw scores can lead to misunderstanding and misinterpretations for the simple reason that the same raw scores from different tests may not have the same meanings when they are interpreted with different references. A few more fictitious but realistic cases should interest you.Performance comparison
Albert has scored 75 in both Social Studies and Science. In which test has he done better? Since the marks are the same for the two subjects, Albert has done equally well in both subjects. Hold on! As pointed out earlier, this will be true if and only if both tests have the same mean and the same SD – a most unlikely situation. Thus, unless the scores are converted to the T-scale, we cannot be so sure; 75 for Social Studies may turn out to be a better score because it has placed Albert on a higher percentile, and the converse is also possible. In short, two scores from two different tests do not necessarily mean the same performance level; they need to be standardized (scaled) before comparison can be made valid. Are you puzzled?
Dollars, cents and scores
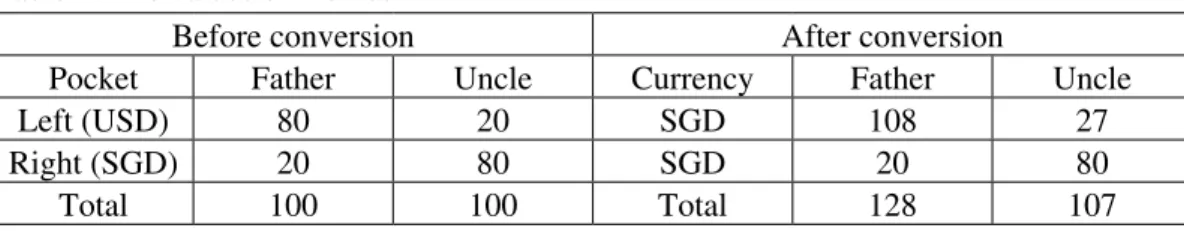
A money example will help to make this clear. The first three columns in Table 1 show the numbers of “dollars” that Albert’s father and uncle have. When we say they are equally rich (or poor) with 100 dollars, we are assuming that the monies in the four pockets are in the same currency. However, if monies in the left pockets are USD and they are converted to SGD (at a rate of 1.35), adding these to the SGD’s in the right pockets shows that Albert’s father is richer than his uncle. The same principle goes for the comparison of scores.
Table 1: The values of monies
Before conversion After conversion
Pocket Father Uncle Currency Father Uncle
Left (USD) 80 20 SGD 108 27
Right (SGD) 20 80 SGD 20 80
This is a reminder that two scores for two different tests cannot be directly compared because they represent different performance levels. Before comparing them, they have to be converted to the same scale (e.g., the T-scale) first.
Axiom no. 3: A small difference makes no difference
Sometimes (or rather often) we see people insisting that a small difference is a difference. For example, a teacher marking a composition with the mark range of 30 insists that an essay is worth 22.5, not 22 or 23! Another example can be about a student who has failed because he could only get 48, two marks short of the passing mark 50. Yet another example, one school celebrates because it scores half a percent more passes and gets one rank higher than its rival school. Are all these small differences real?
All scores have error!
We need to realize and keep reminding ourselves that all assessment scores have errors. Such errors are not what we normally called mistakes but are fluctuations due to sampling. They are, technically, measurement errors (Johnson, Dulaney & Banks, 2005).
When we set test questions in any subject or any topic within a chosen subject, we are taking a sample of many theoretically possible ones (the universal of possible items). We then use these sampled items to test the students’ knowledge or competencies. If we set another test, students’ scores will change (remember Albert’s spelling test). If we test a group of students using even the same test on different days, their scores will also change. And, if we ask different teachers to mark the same set of compositions, even using the same marking scheme, the scores will also be different.
Errors (fluctuation) in assessment are inevitable because of the sampling processes in constructing test questions and marking students’ responses to open-ended questions. There are basically two types of such errors: the random and the systematic (Changing Minds, 2012). Random errors have to do with chance. For example, a set of compositions are marked by one teacher on two days. Because she is in good health on the first and is ill on the second, she is likely to give higher scores to those compositions marked on the first day and lower scores to those on the second day (or, possibly, the other way round). If the teacher is aware of this inconsistency, she can double-mark the compositions a second time. If she then take the average of the two marks for each paper, the inconsistency is likely to cancel out. There are other conditions that lead to fluctuations which will cancel out in the long run. (Unfortunately, she may never do this and so students whose compositions are marked more strictly can only blame themselves for bad luck.). The common practice of double or triple marking and taking the average in large-scale examinations is to minimize such fluctuations which may affect score reliability. It is more appropriate for the marking of open-ended questions which involve students writing
their own answers, such as composition for Languages or essay-type questions in Social Studies, Literature, and even Science.
Individual teachers have different expectations and marking habits influenced by their experience and personality. A teacher who has been teaching high-ability students naturally uses her experience with such students as a yardstick when marking compositions. She may also be, at the same time, a strict marker habitually giving lower marks. Thus, when marking a set of compositions, with her experience and personality combined, she will consistently (though unconsciously) give lower marks than what the compositions should deserve. This may give rise to systematic errors. Some of the teachers were so confident about their marking that they awarded half-a-mark! And, how important is the half-mark? Read this:
“Do you know what is the importance of half a mark? It determines whether you pass or fail. It determines whether your report book is going to have all blue or a “one” or “two” red marks among the blues. This is called “pass” or “fail”, and how many subjects you pass or fail, it is going to determine whether you get promoted to the next level. This is all the olden days...”
(Peace, 2008) For a set of answer sheets to be marked with a computer, one or more errors may occur such as in the coding of answer keys. If “c” is coded for the correct answer when it should be “b”, all students who have answered the miscoded items correctly will earn fewer marks than they deserve. Conversely, those answering wrongly may get a mark higher if they (lucky them) happen to choose “c” (the wrongly coded option). Such errors are also systematic because they do not cancel out in the long run. This type of errors adversely affects the score validity in that the scores do not accurately reflect students’ true ability.
Due to such errors, measurement experts consider an observed score (the score a student gets after assessment) as consisting of two parts: the true score (which can truly represent student’s ability which the test is trying to estimate) and error score (the part of the observed score due to random errors as described above). It is not possible to measure students’ true scores directly. Knowing that there are fluctuations contributing to random errors, test developers take pains to minimize them through careful and multiple marking as well as by controlling the testing conditions. The argument is that by minimizing the errors, observed scores will reflect true scores more accurately (Trochim, 2006).
There are several ways of evaluating score reliability. American experience shows that teacher-made tests generally have score reliability values of around 0.7 meaning that tests constructed by teachers yield scores which are about 70% trustworthy. This suggests
that teachers should not be dogmatic about the marks they give and definitely not about small differences!
A score is not a point!
In view of the errors which cannot be totally eliminated, measurement experts advise that a score should not be seen as a fixed point on a scale but as one possible point or a number of points within a specified range on the scale. This takes us to the concept of
standard error of measurement (SEM).
Let us say that the Chinese Language test has a SD=3 (which is rather small) and its score reliability in terms of Cronbach’s alpha is 0.7. The SEM should be 1.6 according to the formula SEM=SD*√(1 – r), where r is the reliability coefficient, alpha. Then, we ask ourselves how much confidence we want to have when reporting a score for this test. Let us be not too ambitious but choose to be 95% confident in making a statement about a student’s performance. Now, according to the normal curve, a 95% confidence level requires that we allow for an error (fluctuation) of 1.96 SEM (or rounded to 2 in SEM). Then, a score on this test will fluctuate with an error of ±2*SEM or ±3.2 (or rounded as 3). In Albert’s case, instead of seeing his score as a fixed point of 75, we should think of his score (for whatever subject) as falling between 72 (=75-3) and 78 (=75+3) in 95% of the times. This so-called band-interpretation of test scores is in contrast with the point-interpretation. Of course, band-interpretation makes administrative decisions (pass/fail, select/reject) more complicated and inconvenient. However, it is desirable for two reasons. First, it takes due cognizance of the fact that tests scores are fallible and hence should not be taken dogmatically. Secondly, when making important decisions on students, test scores should not be the only criterion; other information needs be considered, too.
Misplaced confidence of spurious precision
In view of the measurement errors (fluctuation) due to the sampling of subject content, student’s testing behaviour, and teacher’s marking habits, a small difference between two scores should not be taken too seriously. For example, a difference between 48 and 50 can well be due to measurement error. In other words, if 48 comes from the same English Language test taken by Albert with a SEM of 3, at the 95% confidence level this score will fall with the range from 45 to 51. Had the student taken the same test again and again, he will get between 45 to 51 marks. Since this mark range includes the passing mark 50, he should be passed.
This example shows how confidence may be misplaced in small mark difference leading to erroneous decisions. The emphasis on a small, immaterial mark difference is called spurious precision, that is, a precision which is not really important or meaningful. Spurious precision may seem to be a spurious issue, but the consequences of basing important decisions on spurious difference may have long-lasting undesirable
consequences for students and the nation (in terms of manpower loss). As the author of
How to lie with statistics, Huff (1954), says, “A difference is a difference only if it makes a
difference.” As a corollary, it is a conceptual sin to make a spurious difference a difference in order to make it a difference.
Is banding the solution?
Perhaps it is the awareness of such problems of measurement error and spurious precision that has led to the use of banding, that is, grouping students within a specified mark range and giving them the same label (band). This is a partial solution but not a perfect medicine.
Table 2 show the bands obtained by two pupils. Combining the bands, Albert has performed better than Bob has. After all, canceling out A-A and B-B, Albert is left with an A but Bob a B. Let’s assume that band B is for scores ranging from 60 to 84, and band A is for score 85 and above. It may just happen that the A’s Albert gets are the beginning scores of band A and his B is from the low end of band B. And, Bob gets the beginning score of band A just like Albert, but his B is from the top end of band B. Then, in terms of actual scores, Bob scores better than Albert and not the other way round. This example is given here only for illustration, but it does not mean this cannot happen.
Table 2: Scores and bands of two students
Subject Bands Scores
Albert Bob Albert Bob
EL A A 85 (A) 85(A)
MT A B 85 (A) 84(B)
Math B B 70 (B) 84(B)
Overall (2A+1B) > (1A+2B) 240 < 253
So, is banding the solution? As the assessment expert Wiliam (2000) says, “A cure
that is probably worse than the disease.” What can we do, then? Not much. One partial solution is to have more bands each with a shorter mark range. The logical extreme extension of this is to have too many bands and then we are back to square one. So, be cautious.
Axiom no. 4: Weights may be non-functioning
Every examination paper will consist of more than one part for assessing one specific item of knowledge or competency. A simple example is the case of a Language paper which has a written component and an oral component. Of course, the written component always comprises several different sub-sections such as vocabulary, grammar,
comprehension, etc. For the sake of illustration, just say it has only the written and oral parts.
Usually, different parts of an examination are given different predetermined weights, for example, 80% for the written components and 20% for the oral component, to reflect their relative importance. The hidden message is, for this example, to let students (and their teachers and parents) know that oral language is important though not as important as the written part; the implication is not to neglect oral language since it is also to be assessed. The message is loud and clear. What is the effect in terms of final results?
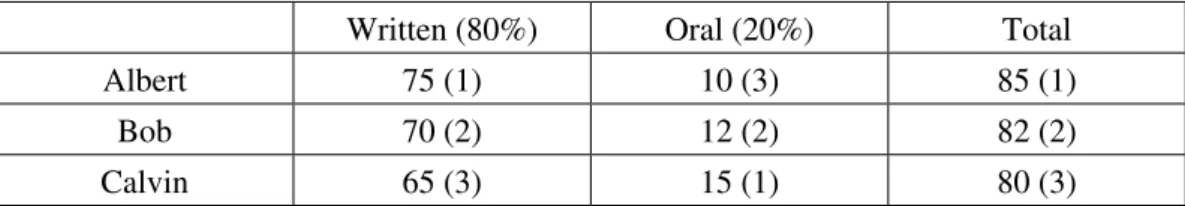
It is a well-known fact that test scores with a wider spread (SD) have more influence if they are summed for an indication of overall performance. Table 3 is a typical example taken from a Language examination.
Table 3: Weights of components and scores in a Language examination
Written (80%) Oral (20%) Total
Albert 75 (1) 10 (3) 85 (1)
Bob 70 (2) 12 (2) 82 (2)
Calvin 65 (3) 15 (1) 80 (3)
As can be seen, for the writing component, Albert is the best and Calvin is the worst, with Bob in between them. For the oral component, the orders are just the reversed. When the scores for the two components are added, the totals will rank Albert first, Bob second, and Calvin third. Thus, the final ranks are the same as the ranks for the writing component, and the oral component has no influence. This happens because the written component has a much wider range (a larger SD if calculated) than the oral component has. This will happen also when scores for different tests are added.
Table 4 shows the performance levels in English and Mathematics of a class and the scores obtained by three pupils. The scores for the two tests are added and the totals are used to rank the students, Albert ranked first and so is better than Bob ranked second who in turn is better than third-ranking Calvin. The rank-orders are the same as those for English. Note that the SD of scores in English is double that of Mathematics. In this case, Mathematics (with a much smaller SD) plays no role in deciding who is better.
Table 4: Weights for different subjects
Subject Mean (SD) Albert Bob Calvin
English 70.0 (4.00) 75 (1) 65 (2) 60 (3)
Mathematics 65.0 (2.00) 59 (3) 62 (2) 61 (1)
More complex situations
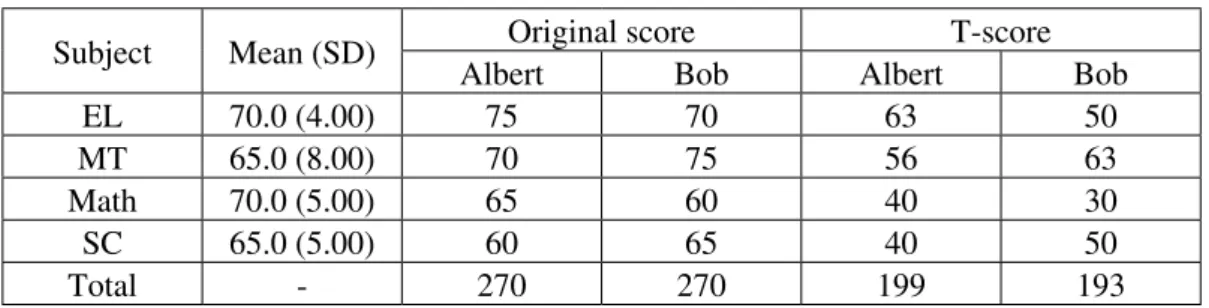
So far, for simple illustration, we have been using examples involving two tests or two components. Things are more complex in reality. In Table 5, the raw scores obtained by Albert and Bob for four subjects suggest that they are equally good, both having a total of 270. If there is a scholarship or other award, they are equally qualified. However, as subjects have different means and SDs, simple summated scores are misleading. The totals for T-scores are different. Now, it is clear that Albert (with Total=199) is a more deserving candidate than Bob (with Total=193), if the difference of four T-scores is considered important enough.
Table 5: Raw and T-scores of two students
Subject Mean (SD) Original score T-score
Albert Bob Albert Bob
EL 70.0 (4.00) 75 70 63 50
MT 65.0 (8.00) 70 75 56 63
Math 70.0 (5.00) 65 60 40 30
SC 65.0 (5.00) 60 65 40 50
Total - 270 270 199 193
T-score transformation is employed for the PSLE in Singapore to solve the problem of unequal means and SDs among subject tests. The same problem exists when raw scores for school-based examinations are summed as indicators of the overall performance level. With computing facilities readily available, this problem can be solved by adopting the same approach what is done for the PSLE.
Does summing up scores make sense?
It is a common practice that different assessments taken throughout a year are given different weights to indicate their relative importance. A typical situation is that shown in the Table 6 where the two term assessments are given a weight of 15% each, the mid-year assessment 30%, and the end-of-year assessment 40%.
Table 6: Weights for different assessments
Term 1 Mid-year Term 2 End-year Average
Marks 72 68 74 78 73.5
Weight 15% 30% 15% 40% 100%
The problem of different means and SDs when original scores are summed for an overall performance indicator (total) will still happen. This means, in spite of the different intended weights, components having larger SDs will be more powerful in the final total,
rending those with small SDs non-functioning. Besides this persistent problem, there is also a conceptual issue. In this example, the four assessments are not mutually exclusive since some content tested earlier in Term 1 will be tested again later. Those tested for the mid-year may also be tested in year-end examination paper again. Such over-lap means that some content are over-tested or double-counted and getting double weight or more. Is this desirable? Furthermore, the four assessments are conducted at different points of the year and at different points a student has different achievement levels. When scores are added (even after weighting) and an average is derived at, does the average really show where the student is at the end of a year’s learning? If not, where is the more accurate indicator?
Imagine that you are driving from Singapore to Penang (or from Hong Kong to Shanghai) and have to stop at three different places. Every time you stop, you record the distance covered. When you reach the destination, you calculate the average of the distances and say “on average, I have driven xyz kilometres from X to Y.” How will this sound to your friend? The message is that average does not always make sense. Stopping at different cities to record the distance covered is analogous to formative assessment, while recording the total distance traveled is analogous to summative assessment. It appears that the practice described above for finding end-of-year averages is a mix-up of these two different approaches to assessment.
Things are a little bit more complicated than this. It is readily appreciated that some subjects are developmental in nature while others are cumulative. For cumulative subjects (perhaps, science subjects for which topics are discrete), adding marks obtain from different tests for an overall indication may make sense. On the other hand, for developmental subjects (such as the languages), what a student is able to do at the end of a year indicates the cumulative effect of learning; and, therefore, adding and averaging marks obtain from assessments taken over a year may not make sense. This is obviously a topic worthy of further discussion and future research.
Axiom no. 5: Assessors may be unreliable
So far, our discussion has focused on scores and students, as if these are the only sources of misinterpretation. The fact is, teachers who mark the papers can also be a source of error, especially where open-ended questions are concerned. This is a century-old problem and is still around. If you think that this will only occur in the marking of compositions, you will be surprised that it can happen in the marking of Mathematics paper as well, as early research shows.
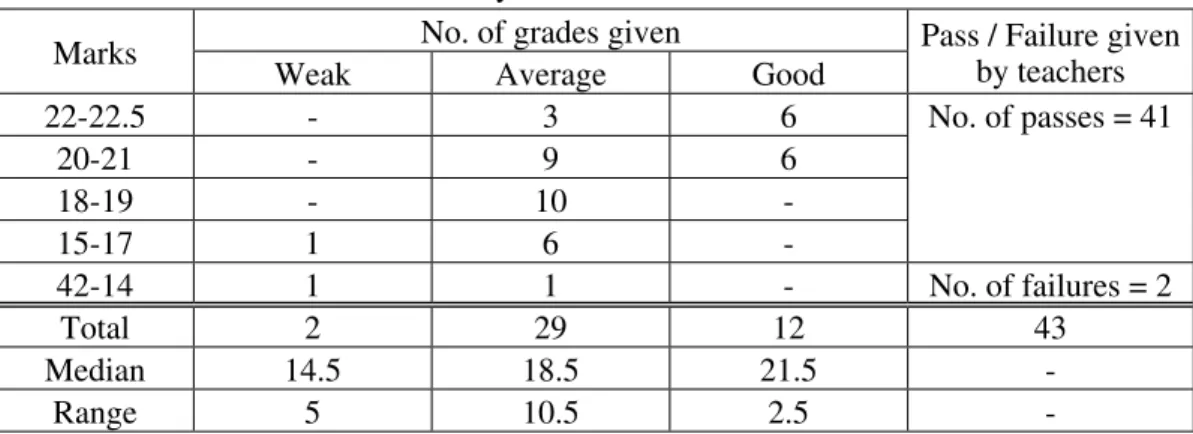
A concrete example of this problem is how a group of experienced teachers marked one and the same answer to a question on vitamins (Science!). The question asks candidates to name four vitamins and their common sources and to tell for each whether it can be stored in the body and whether it can be destroyed by heat. An answer to this question was photo-copied and 43 experienced teachers marked this one answer independently. They were to indicate whether it was a poor, weak, average, good or excellent answer. Also, they were to award a mark within the range of zero to 30 with the passing mark of 15 (By Singapore convention, 50% is a passing mark. What about Hong Kong?). The marks and grades given by the teachers are shown in Table 7.
Table 7: Grades and marks awarded by teachers to the same answer
Marks No. of grades given Pass / Failure given by teachers
Weak Average Good
22-22.5 - 3 6 No. of passes = 41 20-21 - 9 6 18-19 - 10 -15-17 1 6 -42-14 1 1 - No. of failures = 2 Total 2 29 12 43 Median 14.5 18.5 21.5 -Range 5 10.5 2.5
-No teachers considered the answer as poor or excellent. Two teachers considered it as weak, 29 as average, and 12 as good – all for the one and the same answer to an essay-type question on a factual topic! Even within each grade, for instance “average”, the marks given varied as much as 10.5, again for the one and the same answer. Of the 43 teachers, two teachers failed it and 41 passed it. If this happens with just one answer, imagine what may happen when a paper consists of several open-ended questions. In this case, it may not be an exaggeration that whether a student passes or fails depends more on his luck or rather on who marks his answers.
Earlier on, it was suggested that the teacher’s experience, marking habit, and personality play a role in inconsistency in marking. The 43 teachers were asked which schools they came from. There seems to be a relation (correlation) between the school type and the marks awarded. Teachers who came from the so-called good schools tended to give lower marks, and vice versa. This is perfectly understandable since teachers will (unconsciously or subconsciously) use the kind of answers they have been marking as a reference for marking this particular answer. In this example, the teachers’ personalities were not studied. Teachers’ idiosyncrasy in marking is obviously a topic worthy of further discussion and research.
Perhaps, the awareness of such a problem has led to assessment experts to come up with suggestions such as the use of model answers, marking schemes (the old fashion name for assessment rubrics), product sample scale, post-marking moderation, statistical scaling, etc. These may help to reduce the size of the problem but none is a perfect solution, and one wonders if there ever will be one. Again, the best advice is to be cautious.
Axiom no. 6: When interpreting test scores, be humble
and flexible
At this point, it is good to take stock of what has been discussed so far. Traditionally, assessment results in terms of scores and grades are used to sum up student’s learning up to a point in time. This is assessment of learning. In recent years, assessment for
learning gets a lot of attention. This is using assessment results to guide and direct further learning of the students. The two approaches have different purposes and different data are required. However, the reality is that, the same assessment results are used for both purposes, retrospectively as well as prospectively. Whichever approach is emphasized, the same process is involved: from collecting data by testing, through analyzing data to gain information about learning, and then to making decisions on instruction and on the students’ future development. Irrespective of the time span, such decisions have long-lasting consequences to the students and all around them – their teachers, school administrators, parents, and even the nation. Hence, assessment is a very serious business and deserves to be done well.
Nonetheless, problems arise because of the relative nature of educational assessment which yields data that can be interpreted in a variety of ways, as contrasted with the case physical measurements such as weight and height that fixedly quantify fixed quality. Therefore, assessment results need contexts for them to be meaningfully interpreted. This peculiar nature of educational measurement gives rise to the problems relating to the following conditions:
1. Educational measures are relative and highly fallible.
2. Educational measures are samples which have measurement errors (fluctuations). 3. Weighting to reflect relative importance of sub-tests may or may not work. 4. Summing up scores of subtests or a few tests may be misleading.
5. Marking of open-ended responses are always unreliable.
6. Spurious precision of small difference is more often imagined rather than real. Each of these causes conceptual and technical problems that need be solved but perfect solutions are not available. All that can be done is to minimize the severity of misinterpretation as much as the teachers’ assessment competence allows. Conceptual
and technical problems are separate issues though always related. Technical problems are easier to handle. They can be solved to a large extent by learning relevant statistical techniques to treat the assessment data properly, if there is the will.
Conceptual problems are more difficult. They not only call for a will to change but also require re-orientation through the melting of long-held erroneous ideas and crystallization of new shapes. This has been found to be difficult in education. Before the time comes, the only advice that can be given is for assessment data consumers (teachers, counselors, and school administrators) to be flexible and humble when interpreting them and using them.
Conclusion
There is no denial that test scores play a very important role in teaching and learning. For this one reason, they should be appropriately interpreted and used for the benefits of the teachers and their students. Misinterpretation leads to misinformation which in turn leads to misdirection and wrong actions. Valid interpretation of test scores requires some understanding of the basic statistical concepts involved as illustrated in this paper. Uncertainty in interpretations and the uses of test scores are not totally inherent in scores but, to a large part, in ours. Seen in this light, perhaps the title of this article should have been “How much can we trust our interpretations of test scores?”. As teachers, we assess
students and thereby create test scores (and grades), but then as little Alice says in the Wonderland,
“An author doesn’t necessarily understand the meaning of his own story better than anyone else.”
Notes
This paper is application oriented and written for practising teachers in this connection. Instead of following the traditional style of citing articles to support the arguments, readable and interesting websites are listed in the Reference list for those who wish to pursue the issues further in-depth.
References
Australian Education Services. (n.d.). Key questions: What is assessment for learning? Retrieved August 15, 2012, from: http://www.assessmentforlearning.edu.au/professional_ learning/intro_to_afl/introduction_key_questions.html
Changing Minds. (2012). Measurement error. Retrieved August 15, 2012, from: http:// changing minds.org/explanations/research/measurement/measurement_error.htm
Huff, D. (1954). How to lie with statistics. London: Norton.
Johnson, S., Dulaney, C., & Banks, K. (February 2005). Measurement error. For good
measure. Retrieved August 15, 2012, from: http://www.wcpss.net/evaluation-research/ reports/2000/mment_error.pdf
Mypage. (n.d.). Transformed scores – Standard scores. Retrieved August 15, 2012, from: http://mypages.valdosta.edu/mwhatley/3900/standardized.pdf
Peace. (2008). Science exam paper. In Kids World. Retrieved August 15, 2012, from: http:// totallykidsworld.blogspot.sg/search/label/how reliable is the school teacher
ProCon.org. (n.d.). Is the use of standardized tests improving education in America? Retrieved August 15, 2012, from: http://standardizedtests.procon.org/
Trochim, W. M. K. (2006). True score theory. In Research Methods Knowledge Base. Retrieved August 15, 2012, from: http://www.socialresearchmethods.net/kb/truescor.php Wiliam, D. (2000). The meanings and consequences of educational assessments. Critical