This article was downloaded by: [National Chiao Tung University 國立交通大學] On: 28 April 2014, At: 04:07
Publisher: Taylor & Francis
Informa Ltd Registered in England and Wales Registered Number: 1072954 Registered office: Mortimer House, 37-41 Mortimer Street, London W1T 3JH, UK
Aerosol Science and Technology
Publication details, including instructions for authors and subscription information:http://www.tandfonline.com/loi/uast20
A Pilot-Scale Study of the Design
and Operation Parameters of a
Pulse-Jet Baghouse
Hsin-Chung Lu a & Chuen-Jinn Tsai a a
INSTITUTE OF ENVIRONMENTAL ENGINEERING,
NATIONAL CHIAO TUNG UNIVERSITY , HSIN CHU, TAIWAN Published online: 13 Jun 2007.
To cite this article: Hsin-Chung Lu & Chuen-Jinn Tsai (1998) A Pilot-Scale Study of the Design and Operation Parameters of a Pulse-Jet Baghouse, Aerosol Science and Technology, 29:6, 510-524, DOI: 10.1080/02786829808965587
To link to this article: http://dx.doi.org/10.1080/02786829808965587
PLEASE SCROLL DOWN FOR ARTICLE
Taylor & Francis makes every effort to ensure the accuracy of all the information (the “Content”) contained in the publications on our platform. However, Taylor & Francis, our agents, and our licensors make no representations or warranties whatsoever as to the accuracy, completeness, or suitability for any purpose of the Content. Any opinions and views expressed in this publication are the opinions and views of the authors, and are not the views of or endorsed by Taylor & Francis. The accuracy of the Content should not be relied upon and should be independently verified with primary sources of information. Taylor and Francis shall not be liable for any losses, actions, claims, proceedings, demands, costs, expenses, damages, and other liabilities whatsoever or howsoever caused arising directly or indirectly in connection with, in relation to or arising out of the use of the Content.
This article may be used for research, teaching, and private study purposes. Any substantial or systematic reproduction, redistribution, reselling, loan, sub-licensing, systematic supply, or distribution in any form to anyone is expressly forbidden. Terms & Conditions of access and use can be found at http:// www.tandfonline.com/page/terms-and-conditions
ELSEVIER
A
Pilot-Scale Study of the Design and Operation
Parameters of a Pulse-Jet Baghouse
Hsin-Chung LU? and Chuen-Jinn Tsai*
INSTITUTE OF ENVIRONMENTAL ENGINEERING, NATIONAL CHIAO TUNG UNIVERSITY. HSIN CHU, TAIWAN
ABSTRACT. Filtration curves and pulse-jet cleaning performance of different de- sign and operating conditions of a pilot-scale pulse-jet baghouse are investigated. The effective residual pressure loss is used as an index of bag cleaning effect, while the average pulse overpressure inside the bag is used as an index of bag cleaning intensity. It is found that filtration curves vary with the initial tank pressure and the nozzle diameter of the bag cleaning system. The filtration time increases with increasing initial tank pressure or nozzle diameter. However, a critical value of the tank pressure exists for an effective bag cleaning. I t is also found that a critical effective residual pressure loss value exists for the pulse-jet cleaning system. Too large an initial tank pressure and nozzle diameter result in a waste of cleaning energy. The addition of a venturi increases the average pulse overpressure appre- ciably, hence increasing the cleaning effect. A venturi is suggested to be installed to increase the bag cleaning effect and maximize cleaning energy in this study.
AEROSOL SCIENCE AND TECHNOLOGY 29:510-524 (1998) @ 1998 American Asso- ciation for Aerosol Research
INTRODUCTION
The basic researches for fabric filtration and bag cleaning performance of the baghouse have been reported by many previous inves- tigators (Dennis and Klemm, 1980; Ellen- becker and Leith, 1979; Humhpries and Madden, 1983; Koehler and Leith, 1983). Many design and operating parameters in- fluences the performance of pulse-jet bag- house, including tank size, tank pressure, blow tube diameter, discharge characteris- tics of diaphragm valve, nozzle diameter,
*Corresponding author.
+Current Address: Department of Environmental Engi- neering and Health, HungKuang Institute of Technology, Taichung, Taiwan.
venturi type, pulse duration, and dust prop- erties etc.
The filtration time that increases with an increasing bag cleaning efficiency is corre- lated with the cleaning intensity. From the economic point of view, the bag cleaning performance of a baghouse is more effective for a longer filtration time. Many previous investigators (Humphries and Madden, 1983; Morris, 1984; Ravin et al., 1988; Siev- ert and Loffler, 1989) pointed out that a critical cleaning efficiency exists for different indices of cleaning intensity, such as the peak pulse overpressure, the average pulse overpressure inside the bag, and the fabric acceleration. If the index of cleaning inten- sity exceeds the critical value, the cleaning efficiency improves only slightly. Thus, the
Aerosol Science and Technology 29510-524 (1998) O 1998 American Association for Aerosol Research Published by Elsevier Science Inc.
Aerosol Science and Technology Design and Operation of Pulse-Jet Baghouse 511
29:6 December 1998
amount of the cleaning energy that exceeds the critical value is an energy waste.
In this study, a pilot-scale pulse-jet bag- house was tested for investigating the per- formances of bag filtration and bag cleaning. The objective of the pilot-scale pulse-jet bag- house test is to determine the filtration curves under different operating conditions and obtain the critical cleaning indices. The influence of various nozzle-venturi assem- blies, i.e., jet pump (Bakke, 1974), on the index of cleaning intensity was also investi- gated.
PREVIOUS WORK
The Influence of Cleaning Intensity on the Bag Cleaning Effect
Many different indices of bag cleaning inten- sity such as pulse pressure, initial pressure rise rate, fabric acceleration, and pressure impulse in the fabric bag have been claimed to be responsible for dust cake release by different investigators (Dennis et al., 1981; Ellenbecker and Leith, 1981; Humphries and Madden, 1983). Dennis et al. (1981) demonstrated that significant cake release only occurs when the pressure pulse has an initial pressure rise rate greater than 600 Palms. Rothwell (1988, 1990) used the same criteria in the study of the pulse-jet fabric filtration systems. Other authors (Ellen- becker and Leith, 1981; Humphries and Madden, 1983) claimed that the fabric ac- celeration is the main cleaning mechanism and reverse airflow plays only a minor role. Many investigators studied the relation- ship of the bag cleaning effect with the fabric acceleration. Dennis et al. (1981) predicted that an acceleration of 200 g is required to achieve a complete dust dislodgment during pulse-jet cleaning. Howcver, Morris's exper- iment (1984) demonstrated that the pulse jet fabric system can operate steadily when the acceleration ranges from only 30 g to 60 g. From Bustard's observation (1992), the ac- celeration of 100-200 g is necessary to dis- lodge the dust effectively. The magnitude of acceleration required to remove the dust ef- fectively was found to be related to the fabric
material (Sievert and Loffler, 1987). It was found that the dust removal efficiency in- creases with fabric acceleration and only an acceleration exceeding 30 g was needed to dislodge dust effectively when the flexible polyester fabric was used. However, if an inflexible fabric was tested, the fabric accel- eration must reach 200-500 g to dislodge the dust effectively (Sievert and Loffler, 1987).
Klingel and Loffler (1983) pointed out when air pressure impulse (PI) in the fabric bag was greater than 50 P a . sec, dust re- moval efficiency would not increase further. Air pressure impulse PI is defined as the integral of pressure versus time over a pulse duration, or PI =
J,T.d
p ( t ) dt where T is pulse duration. Humphries and ~ a & e n (1983) found that there is a minimum pulse pressure of about 0.3 kPa in the fabric bag that removed about 60% of the dust cake from the fabric. Increasing the pulse pres- sure beyond this minimum value results in only a slight increase in the amount of dust dislodged. Sievert and Loffler (1989) also showed that it is necessary to reach a critical static overpressure of 400-500 Pa at all lo- cations along the length of a bag in order to achieve a good fabric cleaning efficiency. The overpressure is defined as pulse pres- sure minus the bag pressure drop. Along the fabric bag, cleaning mechanisms responsible for dust release may be different. The strong acceleration/deceleration in the upper bag regions was found to be responsible for cake dislodgment, while in the lower bag regions the dust removal was due to the reverse airflow (Sievert and Loffler, 1987, 1989).In this study, the peak pulse overpressure, average pulse overpressure, and accelera- tion of bag were used as indices of cleaning intensity to evaluate the pulse-jet cleaning effect.
Filtration Performance
In filtration process, the dust accumulates on the fabric to from a dust cake. The pressure drop is a common measure for evaluating filtration performance. When the dust accu- mulated on the fabric bag, the filter drag is
512 C.-J. Tsai and H.-C. Lu Aerosol Science and Technology 29:6 December 1998
described by the following basic filtration equation (Donovan, 1985).
@ = S f = S E + K , ( w w , ) =S,+K,w, vf
(1)
Ap = (S,
+
K,w ,) vf = Rfvf (2)Where Ap is the pressure drop across the filter bag, v, is the filtration velocity, K, is the specific resistance coefficient of dust cake, Sf
is the filter drag, S, is the effective drag, w is
mass areal density of the dust cake, w, is the residual dust areal mass density, w, is just the dust mass areal density added during the filtration cycle rather than the total mass areal density, and R, is filter's final resistance coefficient.
Dennis and Klemm (1 980) have proposed that the filter drag for a single pulse jet unit can be described by the relationship:
Sf = SE
+
(KJcw,+
K2w0 (3The new term added in Eq. (3) is (K,),w,, which represents the drag contribution of the cycling portion of the dust mass areal density on the fabric. In Eq. (3), (K,), is the specific resistance coefficient for the cycling fraction of the total dust mass areal density that is alternately dislodged and redeposited on the fabric, w, is the cycling portion of the dislodgeable dust mass areal density.
Dennis et al. (1981) rewritten Eq. (3) as: AP = (p,4aw
+
Kzwovj=(pE)hw + CKz$At = Rpf (4)
Where the fresh added dust areal density, w,, during the filtration interval, At, is ex- pressed as Cv,At, with C the dust inlet con- centration. The variable, (p,),,, herein is defined as the effective residual pressure loss. The (p,), can be obtained from the intercept of the linear extrapolation of the pressure-time curve with the vertical axis at the resumption of filtration. The slope of the pressure-time curve equals CK,$, where K, is easily obtained from the slope when the inlet dust concentration and filtration veloc- ity are constant. The similarity between Eq.
(4) and the basic filtration equation (Eq. [2]) is obvious and, in limit of negligible w,, Eq. (4) becomes identical to the basic filtration equation. However, Eq. (4) can be applied to the on-line pulse-jet filtration.
When the filtration process reaches steady state, the effective residual pressure loss and the specific resistance coefficient of dust cake will keep constant (Dennis and Hovis, 1984). For a constant filtration velocity and inlet dust concentration, lower effective re- sidual pressure loss represents a longer fil- tration time and a better cleaning effect. The magnitude of (p,),, is related to the clean- ing energy. In this study, the effective resid- ual pressure loss is used as an index to eval- uate the bag cleaning effect.
Jet Pump Performance
When the pressure drop across the fabric bag is greater than a designated value, a short burst of compressed air is discharged from a nozzle and usually directed through a venturi into the filter bag to increase the pulse pressure within the bag. The nozzle- venturi assembly system converts the veloc- ity energy into pressure energy. Therefore, the sudden increase of the air pressure in the bag leads to the acceleration of the bag cloth and creation of reverse air through the bag, resulting in the removal of dust cake. This nozzle-venturi system is so-called jet pump (Bakke, 1974; Morris et al., 1991; Ravin et al., 1988).
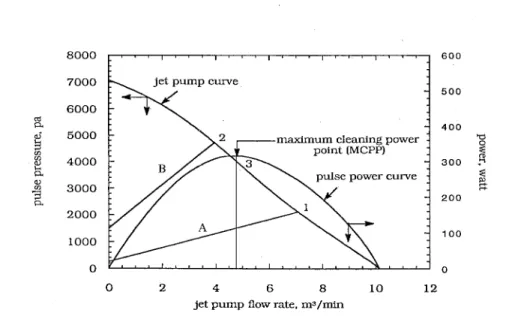
Figure 1 shows a typical jet pump curve, pulsing power curve, and bag operating lines of a pulse-jet fabric filter (after Bakke, 1974). A jet pump characteristic curve varies with the initial tank pressure, nozzle size, venturi configuration, and the distance be- tween the nozzle and venturi. The maximum pulse pressure developed in the bag by the jet pump is obtained at zero flow rate. Con- versely, the maximum flow rate through the venturi is obtained at zero pulse pressure, or when the bag has zero resistance. The jet pump curve can be obtained easily by mea- suring the pulse pressure developed in the bag by the jet pump at various airflow rates using bags of different resistance.
Aerosol Science and Technology 29:6 December 1998
Design and Operation of Pulse-Jet Baghouse 513
jet pump curve
k
-
maximum cleaning power -
point (MCPP)
-
pulse power curve
-
0 2 4 6 8 10 12
jet pump flow rate, ms/min
FIGURE 1. Typical jet pump and pulse power curves.
When the dust accumulated on the fabric bag, the relationship between the pressure drop and filtration velocity is described by Eq. (4). If the effect of the airflow to pres- sure drop is the same in both the forward filtration and reverse bag cleaning processes, and the filter's final resistance coefficient keep constant during cleaning, then the bag operating line will be linear and its slope equals the ratio of filter's final resistance to filter area, R,/A,, as described by Eq. (4).
In Fig. 1, different bag operating lines are shown as solid straight lines A and B. The intercept of bag operating line with the ver- tical coordinate is the filtration pressure drop. When the bag is cleaned on-line, the pulse pressure of the bag cleaning process must exceed the filtration pressure drop in order to remove the dust cake. If the bag is cleaned off-line, the pulse pressure must be zero at zero flow rate, hence the line passes through the origin. It is possible to predict the average pulse pressure inside the bag from the operating point, which is the inter- section of a bag operating line and the jet pump curve during pulse-jet cleaning.
Also shown in Fig. 1 is the pulsing power curve, which is calculated from the product of the jet pump flow rate and the developed pulse pressure. The pulsing power curve is
located between the maximum pressure at zero flow and zero pressure at the maximum flow rate. A maximum cleaning power point (MCPP) exists between the two zero values. The point can be seen in the Fig. 1.
The shape of jet pump curve depends on the venturi configuration, nozzle size, and initial tank pressure, which are the most im- portant parameters influencing the jet pump performance. There are three commonly used pulse-cleaning designs, classified by the tank pressure including low pressure (LP), intermediate pressure (IP), and high pres- sure (HP) baghouses (Bustard et al., 1992). In the LP configuration, the tank pressure reaches approximately 12 psi, and no venturi is installed at the bag top. In the HP config- uration, a venturi is installed at the bag top to induce the secondary airflow. The EPRI report (Lanois and Wiktorsson, 1982) com- pared the performance of the "advanced" and "traditional" fabric filter designs. The "advanced" system utilizes 15-30 psi com- pressed air to clean the filter bag and no venturi is used, while the "traditional" sys- tem utilizes 70-90 psi compressed air and a venturi is installed at the bag top. It was found that the "advanced system design re- quires a lower cleaning energy for an equiv- alent cleaning efficiency. However, Morris
514 C.-J. Tsai and H.-C. Lu Aerosol Science and Technology 29:6 December 1998 pressure transducer baghouse .-+ control valve
t
I fan orifice I I I I I I I I I I3
L - - + dust conc. I I sampling I I I I dust inlet I I I I I I I I I I,t/
L -!+
fresh air\
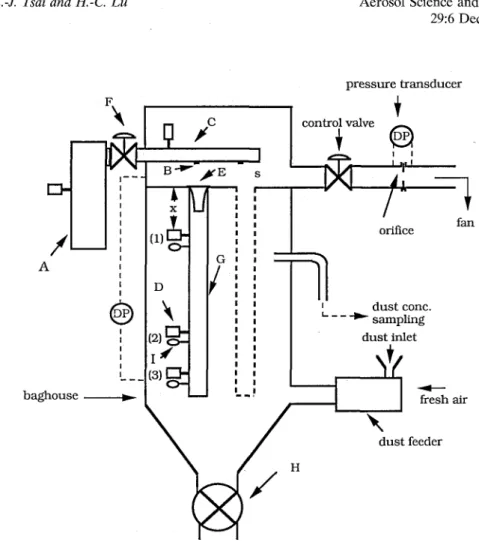
dust feederFIGURE 2. Schematic diagram of the pilot-scale pulse-jet baghouse. A, pressure tank; B, nozzle; C', blow tube; D, pressure transducer; E, venturi; F, diaphragm valve; G, fabric bag; H, rotary valve; I, accelerometer; x, distance of measured point away from bag opening; and, s, distance between nozzle and bag opening.
(1984) pointed out that the energy needed for the stable operation of a pulse-jet bag- house was reduced by about 30% on averagc by the addition of venturis. Whether a ven- turi is required at the bag entrance can't be decided by the previous experimental data in the literature. There are situations where venturis are required to increase pressure pulse inside the bag, and there are also sit- uations where venturis are not necessary.
The jet pump curve can demonstrate the potential cleaning performance of a nozzle- venturi assembly system. An appropriate nozzle-venturi system not only reduces the consumption of pulse energy but also in- crease the bag cleaning effect. In this study,
a pilot-scale pulse-jet baghouse is tested for determining whether a venturi is required under various operating conditions.
EXPERDIENTAI, METHOD
The schematic diagram of the pilot-scale pulse-jet bag filter for testing the perfor- mance of dust filtration and bag cleaning is shown in Fig. 2. The equipment consists of a compressed air reservoir, diaphragm valve, air blow tube, nozzles with or without ven- turi, fan, dust feeder, and a baghouse com- partment. The compressed air tank volume was 0.08 m3; blow tube diameter was 8.3 cm. The venturi configurations used in the ex-
Aerosol Science and Technology 29:6 December 1998
type 1, commercial venturi
type2, specially designed venturi
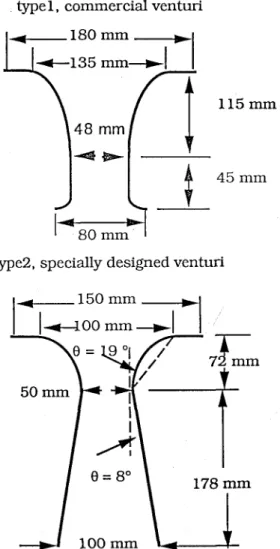
FIGURE 3. Configuration of type 1 and type 2 venturi.
periment are shown as Fig. 3. Type 1 venturi is a conventional design and type 2 venturi is a better design, which minimizes the flow separation in the divergent section. Inside the baghouse compartment, two 1.5 meter long and 127 mm diameter fabric bags made by polyester with acrylic coating were in- stalled. A cylindrical cage supported the bags. A flow rate control device including an orifice, a pressure transducer, and a control valve was set downstream of the baghouse to measure the airflow rate dur- ing filtration and maintain a constant filtra-
Design and Operation of Pulse-Jet Baghouse 515
tion velocity at 2 cmlsec for each test. The test dust was fly ash, which was obtained from a local coal fire power station. The MMAD (mass median aerodynamic diame- ter) and a, (geometric standard deviation) of the test dust was measured in the bag- house by a MOUDI (Model 100, MSP Inc., St. Paul) to be 6.0 pm and 2.1, respectively. The dust was fed into the baghouse from a homemade screw-type dust feeder located before the gas inlet duct and dispersed by a 40 psi compressed air. There was a speed control device to control the output dust concentration of the dust feeder. Dust mass concentration inside the compartment was determined by gravimetric method for each test during filtration.
Conditioned bags were used. The bags were conditioned by running the baghouse using the test dust for many filtration cycles until the filtration time and residual pressure drop became nearly constant. For the cur- rent experiment, this conditioning process lasted for over 50 hours. During filtration, the pressure drop Ap across the bag and the volume flow rate Q, were measured contin- uously. The pressure drop vs. time curve can be used to decide the effective residual pres- sure loss, (p,),,, and the specific resistance coefficient, K,, of dust cake. After attaining a pressure drop of 6 in. of H,O, the dia- phragm valve opened and the compressed air was discharged into the bag from the nozzle to remove the dust accumulated on the bag. The dislodged dust fell down to the hopper and was removed by the rotary valve. The tank pressure, the nozzle diameter, and the venturi were varied for the pulse-jet cleaning system to obtain different operating conditions. In order to determine the clean- ing conditions inside the bag when the com- pressed air was released, the pulse pressure and the fabric acceleration/deceleration at various positions along the bag had to be measured simultaneously. For this purpose, high-frequency pressure transducers (Model R22-01505, MODUS instruments Inc., USA) and piezoelectric accelerometers (Type 4393, Bruel & Kiaer Inc., Sweden) were installed on the bag. Both, pulse pres- sure and fabric acceleration were measured
516 C.-J. Tsai and H.-C. Lu Aerosol Science and Technology 29:6 December 1998
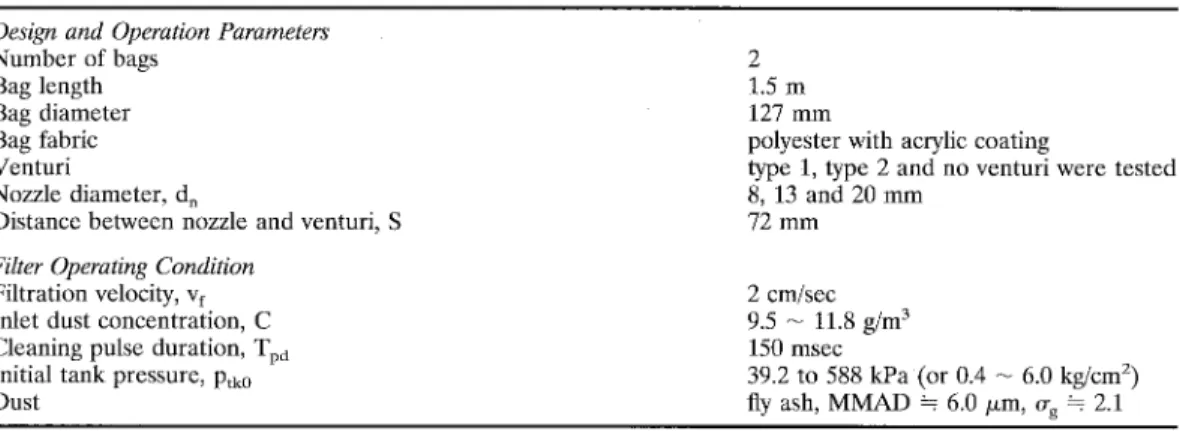
TABLE 1. Design and Operation Parameters of the Pulse-Jet Baghouse Used in This Study
Design and Operation Parameters Number of bags Bag length Bag diameter Bag fabric Venturi Nozzle diameter, d,
Distance betwecn nozzle and venturi, S Filter Operating Condition
Filtration velocity, v, Inlet dust concentration, C Cleaning pulse duration, T,,, Initial tank pressure, p,, Dust
2 1.5 m 127 mm
polyester with acrylic coating
type 1, type 2 and no venturi were tested 8, 13 and 20 mm
72 mm
2 cmlscc 9.5
-
11.8 g/m3 150 msec39.2 to 588 kPa (or 0.4
-
6.0 kgicmz) fly ash, MMAD = 6.0 pm, u, k 2.1at three positions, referred as points (1)-(3). These positions were located from the bag opening at 20, 100, and 140 cm, respectively. The pulse pressure and fabric acceleration were recorded simultaneously by computer.
All tests were performed at a constant filtration velocity of 2 cmlsec. When the pressure drop across the fabric reached 6 in. of H20, the bag cleaning was initiated. The design and operation conditions are shown in Table 1.
RESULTS AND DISCUSSION
Filtration Curves for Various Operating Conditions
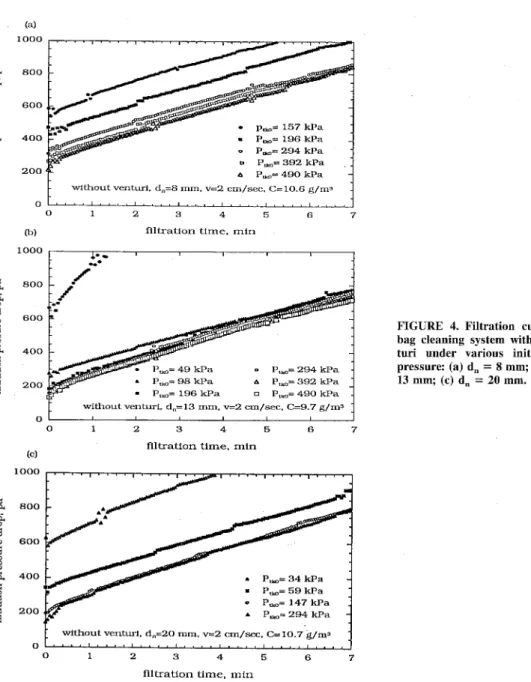
Figures 4a-c show the filtration curves for no venturi condition under various initial tank pressures. It is seen that the filtration curves are influenced by the initial tank pres- sure and nozzle diameter. When the initial tank pressure increases, the residual pres- sure drop decreases while the slope of filtra- tion stays almost constant. The experimental data of Dennis et al. (1981) showed the same results. With the initial tank pressure ex- ceeding a critical value, the filtration curves will overlap and the residual pressures drop remains the same. For example, it is seen in Fig. 4c that the filtration curves for p,,, = 147 kPa (or 1.5 kg/cm2) and p,,, = 294 kPa (3.0 kg/cm2) are almost the same, with the residual pressure drop of about 199 Pa (0.8
in. of H,O). This fact indicates that a critical value of tank pressure exists for the most effective bag cleaning. When the initial tank pressure exceeds this critical value, the pulse-jet cleaning effect increases only slightly.
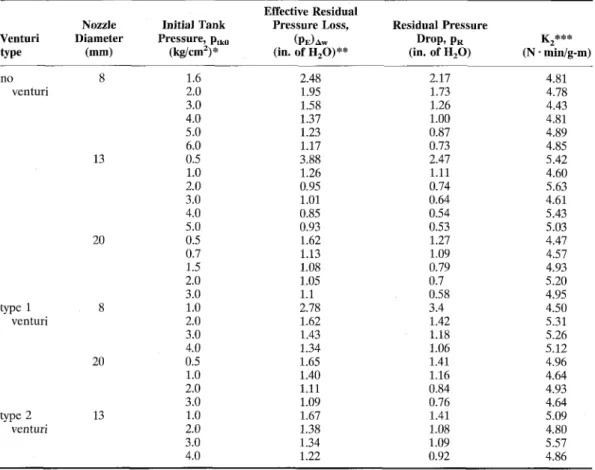
From the filtration curves under different operating conditions, the effective residual pressure loss, (p,),, and the specific resis- tance coefficient of dust cake, K,, can be calculated by Eq. (4). The calculated results are shown in Table 2. It is seen that the K2 value is nearly constant at the same filtration velocity of 2 cmlsec. The average of K, value in this experiment is 4.79 N
.
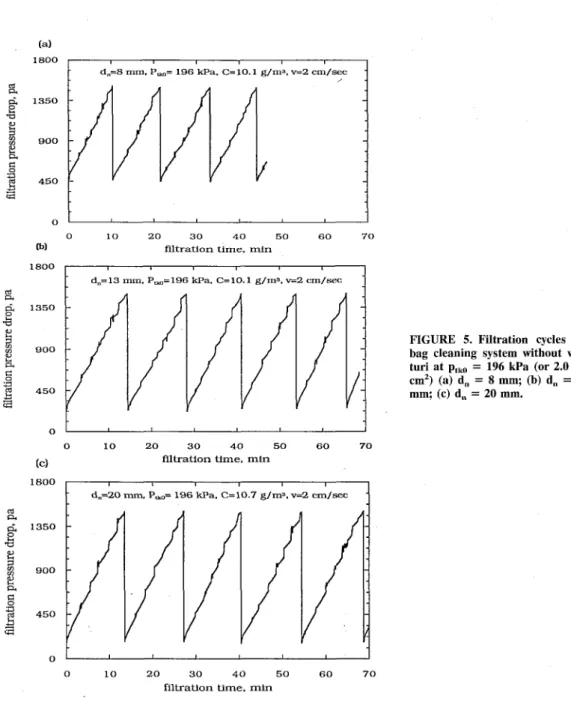
min/g-m. The effective residual pressure loss decreases with increasing initial tank pressure and noz- zle diameter. In this experiment, the effec- tive residual pressure loss reaches a value of about 249 Pa (or 1 in. of H,O) eventually under various operating conditions, when the initial tank pressure and nozzle diameter are large enough. This fact indicates that high initial tank pressure (high pressure-low air volume) or large nozzle diameter (low pressure-high air volume) provides compa- rable cleaning results.Figures 5a-c show the filtration cycle of the cleaning system for three different noz- zle diameters without the venturi and p,,, = 196 kPa. When the pressure drop across the fabric bag reaches 1494 Pa (or 6 in. of H20), the diaphragm valve opens and the bag cleaning process begins. The filtration time
Aerosol Science and Technology 29:6 December 1998
Design and Operation of Pulse-Jet Baghouse 517
without venturi. d,=8 mm. v=2 cm/sec. C= 10.6 g/m"
1
[b) filtration time, min
FIGURE 4. Filtration curves for bag cleaning system without ven- turi under various initial tank pressure: (a) d, = 8 mm; (b) d, = 13 mm; (c) d, = 20 mm.
t
without venturi. d,=13 mm, v=2 cm/sec. C=9.7 g/ms jfiltration time, min (cl
without venturi, d,=20 mm, v=2 cm/sec. C= 10.7 g/ma
' " " . . . . ~ , . ~ ~ ~ I . . . I . I I s I . . . . I . . . I
0 1 2 3 4 5 6 7
filtration time, min
of one cleaning cycle for nozzle diameter of 8, 13, and 20 mm is about 11 min, 13 min, and 13.6 min, respectively. The filtration time for 8 mm nozzle diameter is shorter than that for 13 and 20 mm; the time for the last two nozzle is very close. This discrepancy is caused by the effective residual pressure loss. The effective residual pressure losses
for 8, 13, and 20 mm nozzle diameter are 486, 237, and 262 Pa (or 1.95, 0.95, and 1.05 in. of H,O), which are found from Table 1. The lower effective residual pressure loss value represents a longer filtration time and a better cleaning effect. The higher effective residual pressure loss for 8 mm nozzle diam- eter results in the shorter filtration time per
518 C.-J. Tsai and H.-C. Lu Aerosol Science and Technology 29:6 December 1998
TABLE 2. The Calculated Values of K, and (P,), from Filtration Curves under Various Operating Conditions
Venturi type Nozzle Diameter (mm) Initial Tank Pressure, p,, (Wcmz)* Effective Residual Pressure Loss. ( P E ) A ~ (in. of H,O)** Residual Pressure Drop, PR (in. of H,O) no venturi trpc 1 venturi type 2 venturi
1 kg/cm2 = 98 kPa; *' 1 in. HZO = 249 pa; ^** avcrage Kz = 4.79 N.min/g-m
cycle. Thus, the effective residual pressure loss can be used as an index of bag cleaning effect. The filtration time can then be esti- mated from the effective residual pressure loss by Eq. (4) providing K, is known.
The Influence of Various Operating Conditions on Bag Cleaning
The pulse overpressure equals the differ- ence of the pulse pressure inside of the bag and the pulse pressure outside of the bag. The pulse overpressure is the driving force to dislodge the dust accumulated on the bag. In this experiment, the pulse overpressure is used as an index for cleaning intensity.
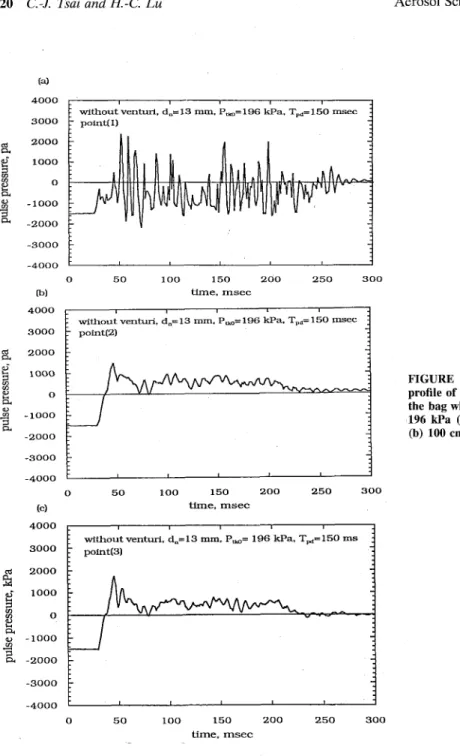
Figures 6a-c show the pulse overpressure profile at different positions along the bag, while Figs. 7a-c show the fabric acceleration
profile at the same positions. It is seen from Fig. 6 that the pulse overpressure profile varies along the bag. Fast oscillation of neg- ative pulse overpressure occurs near the top of bag (point (1). At the middle and bottom portions, point (2) and point (3), of the bag, both pulse overpressure profiles are nearly the same. This fact shows that the pulse pressure distribution is uniform in the mid- dle and bottom parts of the bag. From the profile of the fabric acceleration, it is seen that the maximum acceleration/deceleration occurs at the point (1). When the amplitude of pulse overpressure increases, the absolute magnitude of acceleration/deceleration also increases.
The effective residual pressure loss is an index to evaluate the bag cleaning effect. More effective bag cleaning will result in a
Aerosol Science and Technology
29:6 December 1998
Design and Operation of Pulse-Jet Baghouse 519
(a) 1800 I d,=8 mm. P,= 196 kPa. C=10.1 g/ms. v=2 cm/sec - , - 0 0 10 20 3 0 40 5 0 6 0 70
[bl filtration time, min
1800
dm= 13 mm. P,= 196 kPa. C=10.1 g/ms, v=2 cm/sec
0
1
0 10 2 0 3 0 40 50 6 0 70
(c) flltration time, min
FIGURE 5. Filtration cycles for bag cleaning system without ven- turi at p,, = 196 kPa (or 2.0 kg/ cm2) (a) d, = 8 mm; (b) d, = 13 mm; (c) d, = 20 mm.
I I I
0 10 20 3 0 4 0 50 60 70
filtration time. min
smaller effective residual pressure loss. The average and peak pulse overpressures and maximum absolute fabric acceleration are used as indices of bag cleaning intensity. Figures 8a-c show the relationship between the effective residual pressure loss and the cleaning intensity index. Figure 8a shows the relationship between the average pulse over-
pressure and the effective residual pressure at point (2). When the average pulse over- pressure exceeds about 600 pa, the effective residual pressure stays nearly constant. This fact indicates that when the average pulse overpressure exceeds 600 pa, the dust cake removal efficiency increases only slightly. This critical value is very close to the value of
520 C.-J. Tsai and H.-C. Lu Aerosol Science and Technology 29:6 December 1998
0 50 100 150 200 250 300
[bl time, m s e c
without vent-, dm= 13 mm. =,P 196 kPa. T,,= 150 msec
FIGURE 6. Pulse overpressure profile of different positions along the hag when d, = 13 mm, p,, = 196 kPa (or 2 kg/cmz) (a) 20 cm; (b) 100 cm; (c) 140 cm.
-3000
:
0 50 100 150 200 250 300
(cl time, msec I
i without venturi. dm= 13 mm. P,= 196 kPa. TM= 150 ms
point(31
:
time, msec
400-500 Pa obtained by Sievert and Loffler (1989).
Figure 8(b) shows the relationship be- tween the peak pulse overpressure and the effective residual pressure at the point (2). From Fig. Sb, the critical peak overpressure value of about 1200 Pa is obtained. Figure 8c shows the relationship between the maxi-
mum absolute acceleration/deceleration and the effective residual pressure at the point (1). From Fig. 8c, the critical value of fabric acceleration/deceleration is found to be about 30 g. This value agrees with the result of Morris (1984). These facts show that a critical cleaning effect exists for a pulse-jet cleaning system. Too large of an initial tank
Aerosol Science and Technology 29:6 December 1998
Design and Operation of Pulse-Jet Baghouse 521
0 50 100 150 200 250 300 (b) time, msec
without venturi, dm= 13 mm, p,=2 kg/cm2, TPh 150 msec point[21
FIGURE 7. Fabric acceleration profile of different positions along the bag when d, = 13 mm, p,, = 196 kPa (or 2 kg/cmz) (a) 20 cm; (b) 100 cm; (c) 140 cm. 0 50 100 150 200 250 300 (c) time, msec 0 50 100 150 200 250 300 time, msec
pressure and nozzle diameter result in a waste of cleaning energy. When designing a baghouse, the critical cleaning force inten- sity must be taken into consideration.
Figure 9 depicts the relationship between the initial tank pressure and average pulse overpressure for no venturi and type 1 ven- turi conditions. A horizontal line represent-
ing a critical average pulse overpressure of 600 Pa is also indicated. The average pulse overpressure increases with the initial tank pressure linearly. To create an average pulse overpressure higher than the critical value, 600 Pa, the initial tank pressure must be higher for the system using smaller nozzle diameters. For the nozzle diameters of 8 mm
522 C.-J. Tsai and H.-C. Lu Aerosol Science and Technology 29:6 December 1998 point(2) o without venturi A type 1 venturi u type 2venturi
[bl average pulse overpressure, pa
1000 0 point(2) 900 o without venturi o type 1 venturi A type 2venturi
peak pulse overpressure, pa
type 2 venturi
"
0 50 100
accelaration, g
and 13 mm, the pulse-jet cleaning system with type 1 venturi generates a higher pulse overpressure. For the nozzle diameter of 20 mm, the average pulse overpressure is simi- lar for the no venturi and type 1 venturi conditions. This fact shows that when no venturi is installed, a larger nozzle diameter is more effective to achieve a higher pulse overpressure. In this experiment, a venturi is suggested to be installed to increase the cleaning effect and reduce cleaning energy waste.
FIGURE 8. The relationship be- tween the effective residual pres- sure loss and cleaning force indi- ces: (a) (p,), vs. average pulse overpressure at point (2); (b) (p,), vs. peak pulse overpressure at point (2); (c) (p,), vs. maxi- mum absolute acceleration at point (1).
Figure 10 shows the relationship between the energy consumption of pressure tank and average pulse overpressure. The hori- zontal line in the figure represents the criti- cal average pulse overpressure. For no ven- turi condition, a small nozzle diameter consumes more energy while achieving the same average pulse overpressure. For the type 1 venturi condition, the energy con- sumption to obtain the same average pulse overpressure for 8 mm and 13 mm is very close. For no venturi condition, a larger noz-
Aerosol Science and Technology 29:6 December 1998
Design and Operation of Pulse-Jet Baghouse 523
0 1 2 3 4 5 6 7 8
initial tank pressure, kg/cm2
2 0 0 0 . . . . I . . . . , . . . . , . . . . , . . . . , . . . . , . . . . , . . . .
FIGURE 9. The relationship between the average pulse overpressure and initial tank pressure with type 1 venturi and without venturi condition under various nozzle diameters.
,2 2- 1 6 0 0
zle diameter causes more air to be dis- charged into the bag, resulting in a more effective pulse overpressure. When a venturi is installed, a larger nozzle also causes a higher pulse overpressure. However, since a venturi throat constrains the airflow into the bag, an increase of the nozzle diameter will not increase the effective pulse overpressure appreciably.
without venturi h e1 ventilri
---t dn=8 nun - 0-
-
dn=8 nun-
-
-+d,=13-- 0 - d n = 1 3 m m-
CONCLUSIONS
This study has investigated the filtration curves and pulse-jet cleaning effect for dif- ferent design and operating conditions of a pilot-scale pulse-jet baghouse. It is found that filtration curves vary with the initial tank pressure and nozzle diameter of the bag cleaning system. The filtration time in- creases with the increasing initial tank pres-
-
dn=20 nun - A- - d-
--
0 " " " ~ ~ " ' " ' 1 " " " ~ " " " ' " " " " " 2 0 0 02
--t-d,=8 nun-
g
1 6 0 0 3 V) V) --t- dn=20 mm - A- - dn=20 mm 1 2 0 0 i3 Q) 9 8 0 0 3 a &1
4 0 02
0 0 2 4 6 8 1 0 energy consumption, kJFIGURE 10. The relationship between the average pulse overpressure and tank pressure energy consumption with type 1 venturi and without venturi condition under various nozzle diameters.
524 C.-J. Tsai and H.-C. Lu Aerosol Science and Technology 29:6 December 1998
sure or nozzle diameter. However, a critical value of the tank pressure exists for an ef- fective bag cleaning. It is found that a critical effective residual pressure loss value of about 1 in. H,O and a critical cleaning av- erage overpressure of 500-600 pa for an effective bag cleaning exist for the pulse-jet baghouse investigated in this study.
The addition of the venturi increases the average pulse overpressure appreciably, hence increasing the cleaning effect. In this study, a type 1 venturi with a small nozzle is shown to be a preferred configuration for an effective bag cleaning.
Authors are grateful for the financial support of the Na- tional Science Council under the grant NSC 86-2211-E-
References
Bakke, E. (1974). Optimizing Filtration Parame- ters, J. Air Poll. Contr. Assoc. 24:1150-1154.
Bustard, C. J., Cushing, K. M., and Chang, R. L. (1992). The Potential of Pulse-Jet Baghouse for Utility Boilers. Part 2: Performance of Pulse-Jet Fabric Filter Pilot Plants, J. Air &
Waste Manage. Assoc. 42:1240-1249.
Dennis, R., Wilder J. E., and Harmon, D. L. (1981). Predicting Pressure Loss for Pulse jet Filters, J. Air Poll. Contr. Assoc. 31:987-992.
Dennis, R., and Hovis, L. S. (1984). Pulse-Jet Filtration Theory: A State of the Art Assess- ment, Fourth Symposium on the Transfer and Utilization of Particulate Control Technology,
EPA-60019-84-025a, pp. 22-36.
Dennis, R., and Klemm, H. A. (1980). Modeling Concepts for Pulse-Jet Filtration, J. Air Poll. Contr. Assoc. 30:38-43.
Donovan, R. P. (1985). Fabric Filtration for Com- bustion Source: Fundamentals and Basic Tech- nology. Marcel Dekker Inc., New York.
Ellenbecker, M. J., and Leith, D. (1981). Dust Removal from Non-Woven Fabric-Cleaning Methods Need to Be Improved, Filtration and Separation 18:41-45.
Humphries, W., and Madden, J. J. (1983). Fabric Filtration for Coal-Fired Boilers: Dust Dis- lodgment in Pulse Jet Filters, Filtration and Separation 20:40 -44.
Klingel, R., and Loffler, F. (1983). Influence of Cleaning Intensity on Pressure Drop and Re- sidual Dust Areal Density in a Pulse-Jet Fabric Filter, Proceedings of the Filtech. Conference,
London, pp. 306-314.
Koehler, J. L., and Leith, D. (1983). Model Cal- ibration for Pressure Drop in a Pulse-Jet Cleaned Fabric Filter, Atmospheric Environ- ment 17:1909-1931.
Lanois, G. D., and Wiktorsson A. (1982). Current Status and Future Potential for High-Ratio Fabric Filter Technology Applied to Utility Coal-Fired Boilers, in Proceedings of the First Conference on Fabric Filter Technology for Coal-Fired Power Plants, Denver, pp. 4-125-4- 154.
Morris, K., Cursley, C. J., and Allen, R. W. K. (1991). The ~ o l - e of Venturis in Pulse-Jet Fil- ters, Filtration and Separation 28:24-31.
Morris, W. J. (1984). Cleaning Mechanisms in Pulse Jet Fabric Filters, Filtration and Separa- tions 21:50-54.
Ravin, M. D., Humphries, W., and Postle, R. (1988). A Model for the Performance of a Pulse Jet Filter, Filtration and Separation 24:
201-207.
Rothwell, E. (1988). The Design and Operating Characteristics of Reverse-Jet Assemblies for Pulse-Jet Dust Collectors, Filtration and Sepa- ration 25:257-262.
Rothwell, E. (1990). Pulse-Driven Injectors for Fabric Dust Filters. 111: Comparative Perfor- mance of Model and Commercial Assemblies,
Filtration and Separation 27:345-349.
Sievert, J., and Loffler, F. (1987). Dust Cake Re- lease from Non-Woven Fabrics, Filtration and Separation 24:424-427.
Sievert, J., and Loffler, F. (1989). Fabric Cleaning in Pulse-Jet Filter, Chem. Eng. Process. 26:179-
183.
Received September 2, 1997; accepted July 7, 1998.