國 立 交 通 大 學
環境工程研究所
博 士 論 文
以常壓電漿輔助程序製造氮摻雜二氧化鈦可見光觸媒奈
米微粒之研究
Production of N-doped TiO
2Photocatalysts by Atmospheric Pressure
Plasma Enhanced Nanoparticle Synthesis Process
研 究 生:陳建志
指導教授:白曛綾
教授
以常壓電漿輔助程序製造氮摻雜二氧化鈦可見光觸媒奈米微粒之研究
Production of N-doped TiO
2Photocatalysts by Atmospheric Pressure
Plasma Enhanced Nanoparticle Synthesis Process
研 究 生:陳建志
Student:Chienchih Chen
指導教授:白曛綾
Advisor:Hsunling Bai
國 立 交 通 大 學
環境工程研究所
博 士 論 文
A DissertationSubmitted to Institute of Environmental Engineering College of Engineering
National Chiao Tung University in partial Fulfillment of the Requirements
for the Degree of Doctor of Philosophy in Environmental Engineering
September 2007
Hsinchu, Taiwan
中 文 摘 要
本研究目的為利用常壓電漿輔助奈米微粒製造程序(Atmospheric Pressure Plasma Enhanced Nanoparticle Synthesis;APPENS)製造均勻粒徑之 N 摻雜 TiO2奈米微粒,其可
為能源材料或光觸媒使用,此外亦可應用作為均勻氣膠產生器(monodisperse aerosol generator),提供對奈米顆粒健康效應等研究者一個簡易的奈米微粒即時產生源。 本研究利用自行開發之 APPENS 系統,在常溫常壓下,藉由各種不同製程條件之電 漿反應器系統產生奈米微粒,再將所得之微粒利用 SEM、TEM、XPS、XRD 等儀器分析 微 粒 之物 理化學特性。研 究結 果顯 示 , 本程 序 所合成 之光觸媒微 粒粒徑分佈 約為 20nm~40nm。經過 XRD 及 XPS 分析後確認為含氮摻雜之 anatase TiO2。將製造所得之光 觸媒以甲苯及異丙醇為揮發性有機物指標物種進行紫外光及可見光光催化批次反應,結 果顯示本研究之觸媒在以可見光光源照射 40 分鐘,對甲苯及異丙醇分別有 40%及 100% 去除效率,而在紫外光下對甲苯效率則提升為 60%,對異丙醇則在 30 分鐘內達到 100%。 利用連續式光催化反應來比較本研究製造得之光觸媒與商用光觸媒(P-25、ST01)之活性, 結果顯示在可見光照下確實有較優於商用觸媒之去除效率。本研究亦探討在不同製程條 件下製造各種不同氮摻雜光觸媒之表面鍵結特性,研究顯示可見光觸媒表面鍵結型態為 影響光催化活性之關鍵,OX-Ti-NY 型態摻雜(doping)對可見光的催化效果較 Ti-(NO)
為佳,而無論是 Ti-N、Ti-N 及 OX-Ti-NY 型態的氮摻雜 都有可見光的催化效果, Ti-(NO2)
型態的氮摻雜則可能會對可見光的催化效果有負影響。 研究中並針對合成程序條件對生成微粒之影響,發現在無電漿環境下形成的可見光 觸媒微粒會成雙峰分佈,其平均粒徑為 100 nm 及 400 nm; 而在電場強度 9.6 kV/cm 之電 漿環境下形成之微粒則成單峰分佈,粒徑大小依不同前驅物濃度而改變,範圍約在 30-60 nm 左右,此外改變不同電場強度及頻率亦會改變粒徑的分佈。本研究結果顯示本系統不 僅能製造出高均勻度之奈米微粒,且該電漿系統具有參數調整容易之優點,可迅速的產 生所需粒徑之奈米微粒,且在可見光觸媒製造上可獲致品質佳且較其他製程應用性更廣 之成品。 關鍵字:常壓低溫電漿、奈米微粒、光觸媒、可見光、二氧化鈦、奈米微粒、氣膠產生器、 燃料電池材料、太陽能電池材料、VOCs。
ABSTRACT
An Atmospheric Pressure Plasma Enhanced Nanoparticle Synthesis (APPENS) process was proposed to produce nitrogen doped (N-doped) titanium dioxide (TiO2) visible light
photocatalyst. The effect of N-doping statuses on the photocatalytic activity of N-doped TiO2
photocatalysts was investigated. The potential application of APPENS reactor as an aerosol generator was studied.
The results showed that photocatalytic activity of the N-doped TiO2 photocatalyst is
higher than the commercial ST01 and P25 photocatalysts in terms of toluene removals in a continuous flow reactor. The light absorption in the visible light range for N-doped TiO2was
also confirmed by a clear red shift of the UV-visible spectra. The N-doped TiO2particles with
OX-Ti-NYand -(NO) dopants are produced via N2plasma gas followed by air or N2annealing
gases. They have better visible and UV photocatalytic activities as compared to the pure TiO2
photocatalysts prepared under O2/Ar plasma and annealing gases. The results reveal that the
OX-Ti-NY and -(NO) dopants may have positive effects on the visible light photocatalytic
activity while the -(NO2) dopant tends to have a negative effect on the visible light
photocatalytic activity.
For the aerosol generator employs the APPENS process of alternative current (AC), the influences of applied voltage, frequency and molar ratios of precursor on the generated particles were characterized by the SEM, XRD and SMPS analyses. Results showed that TiO2
nanoparticles appear to be in a broad size range of bi-modal distribution when no voltage is applied. After applying the AC plasma, uni-modal distribution with average sizes range of 30-60 nm was observed. The applied electric frequency can be adjusted to either generate nanoparticles after the plasma reactor or develop a thin film in the reactor. An increase in the precursor molar ratio leads to larger particles with a broader size distribution.
Keywords: visible light photocatalyst, photocatalysis, nonthermal plasma, dielectric barrier discharge, titania nanoparticles, plasma enhanced chemical vapor deposition, aerosol generator, binding energy.
ACKNOWLEDGEMENTS
研究期間承蒙恩師 白曛綾博士於修習階段之諄諄教誨,與不厭其煩地對於
研究及論文上的悉心指導與叮囑,方使論文得以順利完成,尤其是對於做人處
事的道理更使我獲益良多,僅此致上最誠摯的謝意。口試期間蒙張木彬教授、
董瑞安教授、鄧宗禹教授、蔡春進教授與張宗良教授對於本論文謬誤及疏漏之
處提出指正與建議,在此致上萬分謝意。
本研究論文期間,受到許多人的關心、鼓勵及實驗的幫忙。感謝鄧宗禹教授
及宗良學長對於實驗、研究上的指導與鼓勵;工研院簡博士及姿名姐實驗上的
幫忙;家欣、育旨、育豪、映棠、政彰、小元等學長於研究經驗的傳承與關懷;
雅葳、惠綺,小德學弟與空氣資源管理實驗室一起生活過的同仁;從碩士班以
來的同儕王董、聖傑,壘球隊的隊友及一起走過三個週末的伙伴們,與你們度
過的歲月是我一輩子也難忘的,在此致上最深的謝意。
特別感謝在我求學期間,台中大同扶輪社先進們的推薦,讓我成為中華扶輪
教育基金會 2004 年度博士班獎學生,你們奉獻的精神是值得我一輩子效法的。
今日的學位的完成,尤其要感謝父母多年來的鼓勵與支持,讓我一路走到今天。
感謝昭玫在日常起居上無微不至的照顧、鼓勵與支持,讓我能保持健康的身體,
心無旁騖專致於研究,這段求學時間雖然繁忙我依然覺得很幸福。
CONTENTS
CHAPTER ONE INTRODUCTION ...1
1.1. MOTIVATION ...1
1.2. OBJECTIVES ...2
CHAPTER TWO LITERATURE REVIEW ...3
2.1. TiO2PHOTOCATALYSTS ...3
2.1.1. Basic concept of TiO2...3
2.1.2. Application of TiO2photocatalyst...5
2.2. RECENT DEVELOPMENT OF N-DOPED TiO2...10
2.2.1. Nitrogen doping methods ...11
2.2.2. The properties of N-doped TiO2...12
2.2.3. N-doping status ...14
2.3. PRODUCTION OF TiO2PARTICLES BY GAS PHASE METHODS ...21
2.3.1. Nucleation controlled synthesis ...22
2.3.2. Coagulation controlled synthesis...23
2.3.3. Condensation controlled synthesis...24
2.3.4. Dielectric barrier discharge ...25
CHAPTER THREE EXPERIMENTAL METHODS ...30
3.1. PREPARATION OF THE N-DOPED TiO2PHOTOCATALYST...30
3.1.1. Preparing N-doped TiO2particles under different process parameters...30
3.1.2. Preparation of different types of N-doping status of TiO2photocatalysts ...31
3.2. CHARACTERIZATION OF N-DOPED TiO2PHOTOCATALYST...35
3.2.1. The morphology, size, crystal phase and absorption spectra of N-doped TiO2 particles...35
3.2.2. The N-doping status of the N-doped TiO2particles ...36
3.3. PHOTOCATALYTIC DECOMPOSITION OF VOCs AND NOx BY TiO2 PHOTOCATALYST ...37
3.3.1. Photocatalytic degradation of VOCs in a batch reactor ...37
3.3.2. Photocatalytic degradation of VOCs in a continuous flow reactor...38
3.3.3. Photocatalytic degradation of NOx in a continuous flow reactor ...39
CHAPTER FOUR RESULTS AND DISCUSSION ...43
4.1. PREPARATION OF N-DOPED TiO2PHOTOCATALYST BY APPENS PROCESS....43
4.1.1. The feasibility of non-thermal plasma to generate nanosize TiO2...43
4.1.3. Comparison of the APPENS process with other plasma processes...45
4.1.4. Summary...48
4.2. PHOTOCATALYSIS STUDY OF N-DOPED TiO2...54
4.2.1. Photocatalytic activity of N-doped TiO2in a batch reactor ...54
4.2.2. Photocatalytic removals of NO by N-doped TiO2under UV and visible light irradiation ...56
4.2.3. Comparison of N-doped TiO2photocatalysis with commercial photocatalysts ...57
4.2.4. Summary...59
4.3. EFFECT OF N-DOPING STATUS ON PHOTOCATALYTIC ACTIVITY OF TiO2...70
4.3.1. IPA Conversion ...70
4.3.2. Crystallite and particle sizes...71
4.3.3. Crystal phase...72
4.3.4. UV-visible spectra...72
4.3.5. Core level binding energy ...73
4.3.6. N-doped status of the TiO2photocatalyst ...74
4.3.7. Summary...77
4.4. EFFECT OF PROCESS PARAMETERS IN CRYSTALLITE AND PARTICLE SIZE ..87
4.4.1. Effect of applied voltage ...87
4.4.2. Effect of electric frequency ...89
4.4.3. Effect of precursor molar ratio ...90
4.4.4 Long term stability ...93
4.4.5. Comparison of APPENS generator with commercial aerosol generators ...93
4.4.6. Summary...94
CHAPTER FIVE CONCLUSIONS AND RECOMMENDATION...105
5.1. CONCLUSIONS...105
LIST OF TABLES
Table 2.1 Summarized Applications of photocatalysis for literatures. ...7 Table 2.2 Synthetic methods for N-doping TiO2summarized from literatures...17
Table 2.3 Literature data on the core level binding energies of Ti 2p, N 1s and O 1s from XPS. ....18 Table 2.4 Homogeneous chemical reactions in plasma reactor ...27 Table 3.1 List of parameters for producing different TiO2particles ...33
Table 3.2 Plasma and annealing gas compositions for synthesizing different TiO2based
photocatalysts...33 Table 4.1 The operation parameters and the product properties of the APPENS process and other
plasma processes for producing N-doped TiO2photocatalysts. ...49
Table 4.2 Crystallite sizes of SYN1~SYN4 photocatalytic particles. ...79 Table 4.3 Plasma and annealing gas compositions and different N-doped status of TiO2
photocatalysts...79 Table 4.4 Crystallite size of TiO2particles generated via different TTIP/H2O precursor molar ratios.
...96 Table 4.5 Comparison of the APPENS generator with commercial aerosol generators...97
LIST OF FIGURES
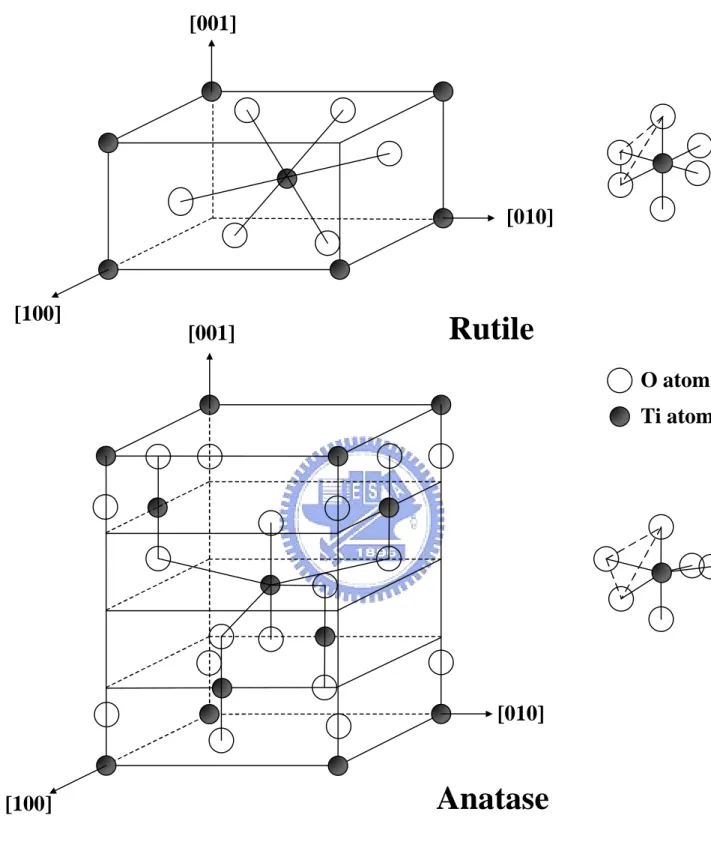
Figure 2.1 Structures of rutile and anatase TiO2. ...8
Figure 2.2 Mechanistic principles for photocatalytic degradation of pollutants and the charge carrier recombination of TiO2. ...9
Figure 2.3 Electronic structure of substituted metal anion and anion TiO2photocatalysts. ...19
Figure 2.4 Electronic structures of (a) substituted N-doping TiO2and (b) interstitial N-doping TiO2. ...19
Figure 2.5 Band structures of pure and N-doping TiO2in anatase and rutile, respectively. ...20
Figure 2.6 Schematic of gas-to-particle formation process ...28
Figure 2.7 Effect of characteristic times ...29
Figure 2.8 Condensation mechanism of particle growth ...29
Figure 3.1 Schematic diagram of APPENS reactor for producing TiO2nanoparticles. ...34
Figure 3.2 Schematics of the (a) batch type and (b) continuous flow photocatalytic reactors for VOCs removal...41
Figure 3.3 The light spectra of the visible light source used in this study. The five major peaks were observed at 435, 488, 545, 587 and 611 nm. ...42
Figure 3.4 Continuous flow reactor for photocatalytic removal of NO...42
Figure 4.1(a) SEM images of titania based particles formed without atmospheric pressure plasma. (b)&(c) SEM & TEM images of titania based particles formed with applying atmospheric pressure plasma, the particles were with size ranging from 20 to 40 nm....50
Figure 4.2 XRPD patterns of the Titania-based nanoparticle. ...51
Figure 4.3 XPS spectra of Ti 2p and N 1s that show evidence of nitrogen doping into the TiO2 photocatalyst. ...52 Figure 4.4 SEM image of the film thickness of N-doped TiO2deposited on a glass substrate via a
deposition time was 2 hrs...53 Figure 4.5a The decomposition of IPA and the formation of acetone in a batch photocatalytic
reactor under UV light (10 W, peak at 364.2 nm). Error bars indicated the error range of repeated experimental data...61 Figure 4.5b The decomposition of IPA and the formation of acetone in a batch photocatalytic
reactor under visible light (10 W, peaks at 435, 488, 545, 587 and 611 nm). Error bars indicated the error range of repeated experimental data. ...62 Figure 4.6 The removal efficiency of toluene as a function of time in a batch photocatalytic reactor
under UV (10 W, peak at 364.2 nm) and visible light (10 W, peaks at 435, 488, 545, 587 and 611 nm) sources. Error bars indicated the error range of repeated experimental data. ...63 Figure 4.7 Concentration variation of NO and NO2by photo-catalytic reaction under visible light
irradiation. The inlet concentrations of NO and NO2was 16.7 ppm and 1.1 ppm,
respectively. The carrier gas composition was 20%N2+80%O2. ...64
Figure 4.8 Concentration variations of NO and NO2by photo-catalytic reaction under UV light
irradiation. The inlet concentrations of NO and NO2was 17.4 ppm and 0.9 ppm,
respectively. The carrier gas composition was 20%N2+80%O2. ...65
Figure 4.9 Concentration variations of NO and NO2by photo-catalytic reaction under UV light
irradiation. The inlet concentrations of NO and NO2was 10 ppm and 0.9 ppm,
respectively. The carrier gas composition was 20%N2+80%O2. ...66
Figure 4.10 Removal rates of NO and NOxat different inlet NO concentrations under UV light
irradiation ...67 Figure. 4.11 Comparison of the toluene decomposition between P25, ST01 and the N-doped TiO2
(TiO2-xNx) photocatalysts tested in a continuous flow reactor under visible light (10W)
illumination. The residence time in the reactor was 2.35 minutes...68 Figure 4.12 Kubelka-Munk absorption spectra of the commercial photocatalysts (P25 and ST01)
and the N-doped TiO2(TiO2-xNx) photocatalyst prepared in this study. ...69
Figure 4.13 The IPA conversion under visible light source (435, 488, 545, 587 and 611 nm, 10 W) at 45℃ with a batch type photocatalytic reactor. All error bars of each data were
Figure 4.14 The IPA conversion under UV light source (364.5 nm, 10 W) at 45℃ with a batch type photocatalytic reactor. All error bars of each data were determined form the repeated experimental data. ...81 Figure 4.15 SEM photo images of particles produced via (a). SYN1, (b) SYN2, (c). SYN3 and (d).
SYN4...82 Figure 4.16 The XRPD patterns of photocatalytic particles synthesized in this study. ...83 Figure 4.17 The Kubelka-Munk absorption spectra of N-doped photocatalysts synthesized in this
study. ...84 Figure 4.18 The XPS patterns of O 1s, Ti 2p and N 1s spectra for photocatalytic particles produced
in this study. ...85 Figure 4.19 The nitrogen doping status for SYN1~SYN4 synthesized photocatalysts based on cross
comparison of N 1s and O 1s binding energies. ...86 Figure 4.20 SEM images of TiO2particles collected in the reactor at different applied voltages. (a)
No applied voltage, (b) 6.48 kV, (c) 8.58 kV and (d) 9.60 kV. The frequency was 60 Hz, the TTIP/H2O precursors molar ratio was 11.9 as TTIP bubbled at 150°C. The scale bar
in theSEM photo is1 μm...98 Figure 4.21 Particle size distributions measured by SMPS after dilution ratio of 1. The operation
condition was the same as that of Figure 4.20. Step-lines are SMPS measured data obtained at different applied voltages, and dash-lines are their lognormal fittings. ...99 Figure 4.22 Particle size distributions measured by SMPS after dilution ratio of 12 under different
electric frequencies. Also shown are SEM images of the reactor-deposited particles. The applied voltage was 10.20 kV, the TTIP/H2O precursor molar ratio was 11.9 as TTIP
bubbled at 150°C...100 Figure 4.23 The XRPD patterns of generated particles synthesized in this study. The operation
condition was the same as that of Table 1 with TTIP/H2O precursor molar ratio (MR)
from 0.4 to 76.1 and TTIP bubbling temperature of 150 or 200℃...101 Figure 4.24 Effect of precursor molar ratio on the size distributions of particles collected in the
reactor and measured by SEM images. The applied voltage was 9.60 kV and the TTIP bubbling temperatures were at 150 or 200℃...102 Figure 4.25 TEM images (scale bar = 20 nm) of particles collected in the reactor as obtained at two
different TTIP/H2O precursor ratios of 1.1 and 76.1, respectively. The applied voltage
was 9.60 kV and the TTIP bubbling temperatures were at 150 and 200℃, respectively. ...103 Figure 4.26 Stability of geometric mean particle diameter (Dpg) and geometric standard deviation
(σg) measured by SMPS during one hour of operation time. The frequency was 60 Hz,
the TTIP/H2O molar ratio was 0.7 as TTIP bubbled at 150°C and the applied voltage
ABBREVIATIONS
AC Alternating Current
APPENS Atmospheric Pressure Plasma Enhanced Nanoparticle Synthesis
BET Brunauer-Emmett-Teller
DBD Dielectric Barrier Discharge
DSSC Dye-Sensitized Solar Cells
FID Flame Ionization Detector
FWHM Full Width at Half Maximum
GC Gas Chromatography
IBAD Ion-Beam-Assisted Deposition
IPA Isopropanol
PECVD Plasma-Enhanced Chemical Vapor Deposition
RF Radio Frequency
SEM Scanning Electron Microscope
SMPS Scanning Mobility Particle Sizer
TEM Transmission Electron Microscope
TMC Total Mass Concentration
TTIP Titanium Tetraisopropoxide
UV Ultraviolet
XPS X-Ray Photoelectron Spectroscopy
CHAPTER ONE INTRODUCTION
1.1. MOTIVATION
The environmental problems related to the remediation of hazardous wastes, contaminated
groundwaters, the control of toxic air contaminants, and the energy resources have been the global
concerned topics in recent years. Therefore development of environmentally friendly technology
and energy resources are demanded. For these purposes titanium dioxide (TiO2) as a photo-catalyst
has been extensively studied due to their stability and wide applications in environmental pollution
control and solar energy resources (Hoffmann et al., 1995; Fujishima et al., 2000; Grätzel, 2001;
Kitano et al., 2007; Wang et al., 2007).
However, the pure TiO2 photocatalysts can only be effectively utilized under ultraviolet (UV;
<365 nm) light source. Thus the development of visible light photocatalysts has attracted wide attention in order to enhance the utilization efficiency of solar energy. The modified TiO2 that
utilizes visible light source can be achieved by doping various elements such as metals, F, S, and N
(Asahi et al., 2001; Wang et al., 2001; Umebayashi et al., 2003). Among the viable non-metal
doping elements (C, N, F, P and S) for TiO2, the substitutional doping of N has been recognized to
be one of the most effective means for producing visible light irradiation effect (Asahi et al., 2001).
reported as TiO2-xNxwithout specifying the actual N-doping status of the N-impurity. In addition to
the wide application of TiO2 nanoparticles, their implications on human health and biological
impact are also of concerns. Thus the generation of size controlled nanoparticles for both
implication and application studies have always been an important research.
1.2. OBJECTIVES
The objectives of this study are listed in the following:
1. To investigate the potential of a novel process of employing non-thermal plasma process for
producing TiO2and N-doped TiO2.
2. To investigate the photocatalytic performance of VOCs (toluene and isopropanol; IPA) and
nitric oxides (NOx) by the N-doped TiO2under illumination of UV and visible light sources.
3. To investigate the effects of plasma and annealing gas compositions on the species of Ti, N,
O and on the photo-activities of photocatalysts.
4. To investigate the possibility of the APPENS process as a chemical-approached aerosol
CHAPTER TWO LITERATURE REVIEW
2.1. TiO2PHOTOCATALYSTS
Titanium dioxide has received enormous studies due to their stability and wide applications in
decomposition of environmental pollutants and materials for solar energy resources (Fujishima et
al., 2000). A brief synopsis will be introduced in this section for the basic properties and application
of TiO2that related to this study.
2.1.1. Basic concept of TiO2
The three major structures of TiO2 are rutile, anatase and brookite. However, only the rutile and
anatase forms of TiO2play the important role in the application of environmental energy, thus these
two types were described in this study (Diebold, 2003). Figure 2.1 shows the unit cell structures of
the rutile and anatase forms of TiO2. The Ti atom is surrounded by six O atoms in both of structures.
These two crystal structures are in distorted octahedron class. A slight orthorhombic distortion
structure is occurred in rutile, while the distortion of cubic lattice is significant in anatase.
The distances of Ti-Ti in anatase are larger but the Ti-O distances are shorter than those in rutile.
Thus, these differences in lattice structures lead to the different mass densities and electronic band
structures between the two forms of TiO2 (Chen and Mao, 2007; Diebold, 2003; Thompson and
The mechanistic principles for photocatalytic degradation of pollutants are shown in Figure 2.2.
The electron-hole (e--h+) pair generated by light irradiation is trapped at surface, and the hydroxyl
radicals (•OH) were formed from h+ and OH-. The •OH is a highly reactive species that can oxidize
pollutants adsorbed on the catalyst surface. The mechanisms of reaction are shown as following
(Cao et al., 1999):
TiO2+ hv → h++ e- (1)
h++ OH-→ •OH (2)
Ti4++ e-→ Ti3+ (3)
Ti3++ O2→ Ti4++ O2- (4)
•OH + pollutant → oxidized pollutant (5)
h++ e-→ thermal heat or luminescence (6) The concentration of charge carriers under light irradiation excitation in any semiconductor is
reduced by the inherent recombination process of electron-hole pairs. Thompson and Yates (2007)
indicated that this action can be explained by the Shockley-Read-Hall model in TiO2. The active
sites for electron or hole trapping may vary and are usually described as defect states within the
crystal due to interstitial atoms, defect states, vacancy, or grain boundaries. In the
Shockley-Read-Hall mechanism, as schematically depicted in Figure 2.2, four transition processes
may occur: (1) electron capture; (2) electron emission; (3) hole capture; or (4) hole emission
electron-hole recombination by the defect on the TiO2 surface (Bore, 1990; Alberici and Jardim,
1997; Brillas et al., 1998). Nakamure et al. (2000) indicated that the formation of the oxygen
vacancy state located between the valence and conduction bands can be sewed an electrons trapping
center in plasma-treated TiO2. The plasma-treated TiO2 shows a good efficiency of the
photocatalytic oxidation of NO to NO3-under irradiation of visible light.
2.1.2. Application of TiO2photocatalyst
The TiO2 nanoparticles have attracted many studies due to their potential applications
including photocatalysis, photovoltaic, water splitting and gas sensing (Hoffmann et al., 1995;
Fujishima et al., 2000; Grätzel, 2001; Nakada et al., 2002; Chen and Mao, 2007; Kitano et al., 2007).
Table 2.1 shows the applications of TiO2photocatalysts summarized from literatures (Fujishima et
al., 2000; Grätzel, 2001; Chen and Mao, 2007; Ni et al., 2007). TiO2 photocatalysts have been
applied to various fields such as photocatalytic destruction of various environmental pollutants (air
and water), photocatalytic sterilization, photocatalytic cancer treatment, antifogging, self-cleaning,
solar cell materials, hydrogen fuel cells, display and gas sensor (Fujishima et al., 2000; Grätzel,
2001; Chen and Mao, 2007; Ni et al., 2007).
TiO2 nanomateirals can be utilized for antifogging and self-cleanning materials on various
glass products, i.e., mirrors and eyeglasses due to its superhydrophobic surfaces (Fujishima et al.,
2000). TiO2has been used for photodecomposition of pollutants, anti bacteria and kill tumor cells in
The Dye-Sensitized Solar Cells (DSSC) technology has been proposed that the efficiency of
solar to current conversion is reached about 10.6% (Grätzel et al., 2001). Water splitting and
hydrogen production have attracted many studies due to its feature of clean, suitable and renewable.
In addition, TiO2nanomaterial has been studied as sensors for various gases, and the sensors have
been approached for H2, O2 and CO gas sensing (Fujishima et al., 2000; Grätzel, 2001; Chen and
Table 2.1 Summarized Applications of photocatalysis for literatures (Fujishima et al., 2000;
Grätzel, 2001; Chen and Mao, 2007; Ni et al., 2007).
Property Category Application
Self-cleaning Materials for lamps, roads, residential and office buildings
Tunnel wall, soundproofed wall, traffic signs and reflectors, plastic surfaces, building stone and lamp covers or coatings
Air cleaning Room air cleaner, photocatalyst-equipped air conditioners, the materials for roadways and tunnel walls.
Pollutants destruction
Water purification River water, ground water, lakes, water-storage tanks and industrial wastewater
Antitumor activity
Cancer therapy Endoscopic-like instruments
Self-sterilizing Anti- bacteria Tiles to cover the floor and walls of
operating rooms, silicone rubber for medical catheters and hospital garments and public rest rooms, bed room
Photovoltaic Energy sources Solar cell, Dye-Sensitized Solar Cells (DSSC)
Photocatalytic water splitting
Energy sources Hydrogen fuel cells
Electrochromic Electrochromic devices Electrochromic windows and display Sensing Gas sensors Gas sensors for H2, O2, CO gases
[100]
[010]
[001]
Anatase
Rutile
O atom
Ti atom
[010]
[001]
[100]
h+ e -Reduction Reaction Oxidation Reaction O2+ e- O 2 -OH-+ h+ OH TiO2+ hv h++e -h+ e -e -h+ Recombination Center Crystal Defect or Impurity level
Conduction Band
Valance Band
Trapping Center Bulk Recombination Surface Recombination Optical Absorption Light(hv) 1 2 4 3 1 2 Electron emission 3 Hole capture 4 Hole emission Electron captureFigure 2.2 Mechanistic principles for photocatalytic degradation of pollutants and the charge carrier recombination of TiO2.
2.2. RECENT DEVELOPMENT OF N-DOPED TiO2
The N-doped TiO2 has received enormous attention from researches of photocatalytic field
since ever Asahi et al. (2001) have reported that N-doping TiO2 could initiate photo activation by
visible light sources, thereby improving methyl blue destruction efficiency and potentially
expanding its fields of application. Asahi et al. (2001) indicated that among the viable non-metal
doping elements (C, N, F, P and S) for TiO2, the substitutional doping of nitrogen has been
recognized to be one of the most effective means for producing visible light irradiation effect. This
TiO2-xNxfilm absorbed wavelength more than 500 nm, and the TiO2-xNxnano-particles are superior
to that of the TiO2nano-particles in the visible light of irradiation.
Studies on the N-doping TiO2includs novel production methods (Asahi et al., 2001; György et al.,
2003; Miao et al., 2004; Sakatani et al., 2004; Yang et al., 2004a; Yang et al., 2004b; Chen et al.,
2005; Livraghi et al., 2005; Nosaka et al., 2005; Suda et al., 2005; Wu et al., 2005; Yin et al., 2005),
effect of N-dopant concentration on photocatalytic activity (Irie et al., 2003), crystal phase of
N-doped TiO2 (Di Valentin et al., 2004), optical properties (Wu et al., 2005) and structure of
N-doped TiO2(Di Valentin et al., 2005; Livraghi et al., 2006). Most of the studies on N-doped TiO2
commonly utilized XPS for the characterization of N atoms presented in TiO2, but the N-doping in
TiO2 was frequently reported as TiO2-xNx without specifying the actual N-doping status of the
2.2.1. Nitrogen doping methods
Up to the present, many methods have been documented to successfully prepare N-doped TiO2
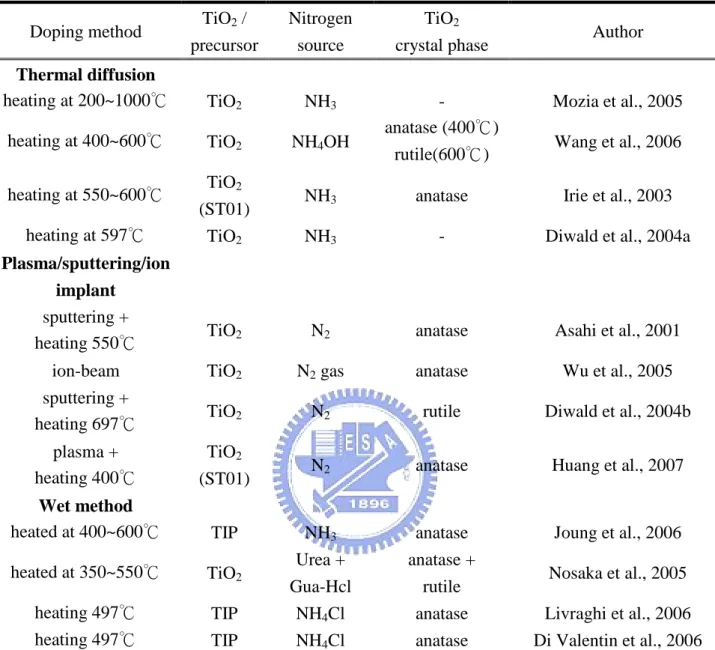
films or particles. Table 2.2 lists the synthetic methods for N-doping TiO2, which include direct
surface treatment of TiO2 target by sputtering (Asahi et al., 2001) or plasma (Miao et al., 2004),
using TiO2 precursors to produce TiO2 photocatalysts via the Plasma Enhanced Chemical Vapor
Deposition (PECVD) process (Maeda and Watanabe, 2006), the pulse laser deposition (Suda et al.,
2005), the ion-assisted electron beam evaporation method (Yang et al., 2004) and the aqueous phase
reactions such as sol-gel method (Chen et al., 2005; Nosaka et al., 2005; Sato et al., 2005; Yin et al.,
2005; Livraghi et al., 2006)
On can see form Table 2.2 that the materials for synthesizing N-doped TiO2were bare TiO2or
titanium precursors, while the nitrogen sources were N2, NH3, NH4OH and NH4Cl. The mechanism
of N-doping could be either in thermal diffusion, excited N ion implanted or chemical reaction.
Thermal diffusion and N ion implanted was in feature of utilizing the bare TiO2and then doped the
nitrogen by heating or ion sputtering. On the other hand, chemical reaction is usually observed in
wet method and the reaction occurs between the TiO2or titanium precursor and nitrogen sources of
NH3, NH4OH or NH4Cl at high temperature.
In the N-doping process, the nitrogen source such as NH3, NH4OH and NH4Cl may be
converted to harmful byproducts. But N-doping is difficult to be approached by simple heating of
ion into TiO2photocatalyst via utilizing the N2gas directly. However utilizing bare TiO2during the
process leads to confinement of the physical and chemical properties of N-doped TiO2.
The plasma enhanced chemical process (PECVD) can synthesize the N-doped TiO2 directly
from titanium precursor with N2gas (Battiston et al., 2000; Maeda and Watanabe, 2006). It supports
sufficient energy for breaking and doping N2 or NH3 molecules into the titania precursors. But,
most of the plasma processes entail stringent operating environment of low pressures (vacuum)
and/or high temperatures.
2.2.2. The properties of N-doped TiO2
Asahi et al. (2001) indicated that the substitutional doping of N was most effective because its
p state contributes to the band-gap narrowing by mixing with O 2p states. They have reported the
theoretical calculation of density of state (DOS) from the substituted O atom by C, N, F, P, and S in
TiO2lattice. The visible light-induced TiO2can be achieved by doping with various elements such
as metals, F, S, and N (Asahi et al., 2001; Wang et al., 2001; Umebayashi et al., 2003). In recent
years, some studies have been focused on the effect of N-dopant concentration (Irie et al., 2003),
crystal phase of N-doped TiO2 (Di Valentin et al., 2004), and the structure of N-doped TiO2 (Di
Valentin et al., 2005; Livraghi et al., 2006) on photocatalytic activity.
The local structure of the metal anion and anion substituted TiO2 photocatalysts are
the metal ions were substituted of Ti ions in the lattice position of TiO2. Both of them were found to
have significant impact on the modification of the electronic structure of TiO2 for extending the
absorption edge to visible light range (Asahi et al., 2001; Wang et al., 2001; Umebayashi et al.,
2003; Kitano et al., 2007).
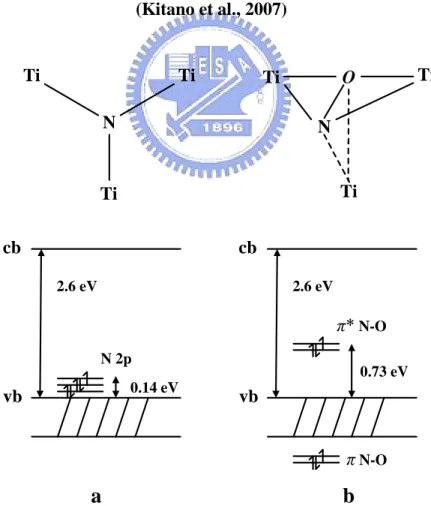
Furthermore, the N-doping (anion) TiO2has been considered as two modal, substituted N-doping
(Figure 2.4a) and interstitial N-doping (Figure 2.5b) TiO2(Di valentin et al., 2005). Di valentin et al.
(2004, 2005) and Livraghi et al. (2006) indicated that the electronic transition from localized states
to the conduction band instead of a band-to-band transition under visible light irradiation. The
localized states of substitutional N-doped anatase TiO2 were occupied N 2p that slightly above the
valence band edge (Figure 2.5a). The NO bond formed localized states noted as π(Figure 2.4b).
The highest localized state for the interstitial species is 0.73 eV above the top of the valence band,
and is 0.14 eV above it for substitutional species. Both of these two N-doping types were formed
localized occupied states between the bands for visible light induced photoactivity.
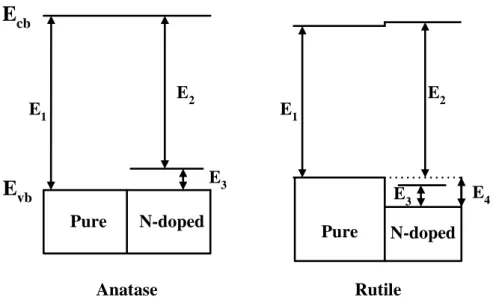
Di valentin et al. (2004) also indicated that the N-doping has opposite effects on the
photoactivity of anatase and rutile forms of TiO2, leading to a redshift and a blueshift, respectively
(Figure 2.5). They indicated that the doping is accompanied in both cases by the appearance of well
localized N 2p states above the O 2p valence band but in rutile the shift of the top of the valence
band towards lower energies leads to an increase of the band gap transition. The similar result was
al. (2003) indicated that the values of quantum yield decreased as nitrogen dopant increased due to
the doping sites serve as recombination centers.
2.2.3. N-doping status
The N-doped TiO2 has been recognized as one of the most effective means for band-gap
narrowing via mixing of 2p state of substituted N with 2p state of O in TiO2 lattice (Asahi et al.,
2001). Although it is widely accepted (Miao et al., 2004; Nosaka et al., 2005; Suda et al., 2005; Yin
et al., 2005; Maeda and Watanabe, 2006; Yin et al., 2006) that the TiN doping in TiO2photocatalyst
has a positive effect on the photocatalytic activity under illumination of visible light, there still exist
other types of N-doping such as -(NO), -(NO2) and (O-Ti-N) (Gyorgy et al., 2003; Diwald et al.,
2004a; 2004b; Chen and Burda, 2004; Chen et al., 2005; Livraghi et al., 2005; Nosaka et al., 2005;
Sato et al., 2005). Nosaka et al. (2005) doped N atoms into commercial TiO2particles in the present
of organic compounds and observed the presence of TiN and -(NO) in the photocatalysts. They
indicated that both TiN and -(NO) doped TiO2 contributed to absorption of the visible light. TiN
tended to increase the visible light photocatalytic activity, while -(NO) doping had a negative effect
on visible light photocatalytic activity.
However, Sato et al. (2005) and Yin et al. (2005) prepared the N-doped anatase TiO2 powders
and obtained -(NO) doping as the only status of N-doped TiO2. Their results showed that the
presence of -(NO) at N 1s binding energy at around 400 eV is an effective N-doping site. Diwald et
photochemical threshold down to ~2.4 eV, and this form of nitrogen is most likely located in an
interstitial site bound to hydrogen. They also indicated that this form of N-doping disagrees with the
conclusion of Asahi et al. (2001). Similar observation was shown by Chen et al. (2004; 2005) that
TiO2with oxynitride doping at N 1s binding energy of around 402 eV is an effective photocatalyst
for the decomposition of methylene blue.
Table 2.3 lists the binding energies of Ti 2p, N 1s and O 1s obtained from the XPS Handbook
as well as reported data on N-doped TiO2 photocatalysts or other nitrogen impurities materials
(Rodriguez et al., 2000; Jirsak et al., 1999). Although there might have some differences in the
values of binding energy of Ti 2p, N 1s and O 1s as detected by different instruments and
laboratories, they can still be identified as TiO2 and TiN at 2p3/2 and 2p1/2, and be grouped into
several ranges as N(I)~N(IV) for N 1s and O(I)~O(III) for O 1s.
The Ti 2p binding energies of Ti 2p3/2 (455.0~459.5 eV) and Ti 2p1/2(461.0~465.0 eV) were
different between TiO2 and TiN. As appearance of TiN, the core level binding energy of Ti 2p
tended to be lower than that of TiO2. The N 1s spectra with peaks at 395.8~397.8 eV indicated that
the N-doping status was TiN, while those of N(II)~N(III) at around 399~403 eV revealed the
presence of N2 chemisorption or the oxynitride doping such as Ti-N-O, Ti-O-N, NX-Ti-OY and
O-Ti-N. For N(IV), there exist an additional N-doping status of -(NO2) in TiO2 particles. The
binding energy of O(I) with peaks at 528.1~530.2 eV showed that the O atom was bound to metals
binding energies of Ti 2p, N 1s and O 1s listed in Table 2.3 will be used hereafter as references for
Table 2.2 Synthetic methods for N-doping TiO2summarized from literatures
Doping method TiO2/ precursor
Nitrogen source
TiO2
crystal phase Author
Thermal diffusion
heating at 200~1000℃ TiO2 NH3 - Mozia et al., 2005
heating at 400~600℃ TiO2 NH4OH
anatase (400℃)
rutile(600℃) Wang et al., 2006 heating at 550~600℃ TiO2
(ST01) NH3 anatase Irie et al., 2003 heating at 597℃ TiO2 NH3 - Diwald et al., 2004a
Plasma/sputtering/ion implant
sputtering +
heating 550℃ TiO2 N2 anatase Asahi et al., 2001 ion-beam TiO2 N2gas anatase Wu et al., 2005
sputtering +
heating 697℃ TiO2 N2 rutile Diwald et al., 2004b plasma +
heating 400℃
TiO2
(ST01) N2 anatase Huang et al., 2007
Wet method
heated at 400~600℃ TIP NH3 anatase Joung et al., 2006
heated at 350~550℃ TiO2
Urea + Gua-Hcl
anatase +
rutile Nosaka et al., 2005 heating 497℃ TIP NH4Cl anatase Livraghi et al., 2006
Table 2.3 Literature data on the core level binding energies of Ti 2p, N 1s and O 1s from XPS. (Chen et al., 2007)
Species Assigned doping status
Ti 2p3/2 455.0-459.5 TiN (455.2±0.2, 455.6, 455.9±0.2) TiNXOY(455.2) TiO2-XNX(456-459, 459.1) Titanium oxynitride (456.5) Oxidized TiN (456.8) TiO2(458.5, 458.8, 458.8±0.34, 459.1) Ti 2p1/2 461.0-465.0 TiNXOY(461) Oxidized TiN (462.6) TiO2-XNX(464.4, 463-465) TiO2(464.34, 464.4, 464.7) N 1s (I) 395.8-397.8 TiNX>1(395.85) TiN (396, 396.1, 396.5, 396.6, 396.7, 397, 397.2±0.5, 397.8) TiNXOY(397) N 1s (II) 398.8-401.2 N-C, N-O, N-N (399.25, 400, 398.8-400.3, 398.9±0.8) Molecularly chemisorbed γ-N2(399.3, 400, 401.15) Nitrogen contaminant (398.8-400.3) Ti-N-O (399.5) Interstitially dopant N-H(399.6) Ti-O-N (400) N 1s (III) 402.0-403.3 O-Ti-N (402) Molecularly chemsorbed γ-N2(402)
Oxidized TiN (NX-Ti-OY; 402-403.3)
NOX(402.5) N 1s (IV) 403.9-404.3 -NO2(404, 404.1±0.2) O 1s (I) 528.1-530.2 Metal oxide(529.6±1.5) TiO2(529.7, 530±0.2, 530.2, 530.5) O 1s (II) 531.0-532.4 TiNXOY(531.0)
Substoichiometric oxide, oxynitride(531.4), Ti-N-O(532), O-Ti-N(532), Adsorbed oxygen(532.2) OH(532.4) O 1s (III) 532.7-533.7 -NO2(533.2±0.5) CO(533.4)
O 2-Ti4+ O 2-O 2-Ti4+ O 2-O2- O 2-O 2-O 2-Ti4+ O 2-O2- O 2-O 2-O 2-O
2-Metal ion implantation, metal ion doping
Anion doping O 2-Mn+ O 2-O 2-Ti4+ O 2-O2- O 2-O 2-O 2-Ti4+ O 2-O2- O 2-O 2-O 2-O
2-Mn+: Cr, V, Mn, Fe metal ions etc.
Substitution of metal ions
O 2-Ti4+ O 2-O 2-Ti4+ O 2-O2- O 2-O 2-O 2-Ti4+ O 2-O 2-O 2-O 2-O
2-: N, S anions, C atoms or defects. Substitution of anions of defect site
Figure 2.3 Electronic structure of substituted metal anion and anion TiO2photocatalysts.
(Kitano et al., 2007) N Ti Ti N Ti Ti Ti O
a
0.14 eV N 2p 2.6 eV cb vbb
0.73 eV π*N-O 2.6 eV cb vb πN-O TiFigure 2.4 Electronic structures of (a) substituted N-doping TiO2and (b) interstitial N-doping
E1
E
cbE
vb Pure N-doped E2 E3 Anatase E1 Pure N-doped E2 E4 Rutile E3Figure 2.5 Band structures of pure and N-doping TiO2in anatase and rutile, respectively. (Di
2.3. PRODUCTION OF TiO2PARTICLES BY GAS PHASE METHODS
Production of nanoparticle by gas phase method is superior to that of wet method (sol-gel) in
higher purity crystal and continuous generation. Many of the nanoparticles are produced and
utilized as an aerosol generator by physical processes where the chemical composition of generated
particles is the same as the precursors. For examples, the vibrating orifice (Berglund and Liu, 1973),
evaporation-condensation aerosol generator (Veranth et al. 2003; Peinekea et al., 2006), spray
(Chein and Lundgren, 1995) or electrospray (Chen et al., 1995) aerosol generator, modified
fluidized bed (Prenni et al., 2000), gas-metal arc welding of steels (Zimmer et al. 2002) and the
spark discharge particle generator (Evans et al. 2003; Harvath and Gangl, 2003). The species of
physically generated particles are subjected to their dissolubility or evaporation properties.
On the contrary, the chemical process in which the chemical composition of generated particles is
different from the precursors is widely applied for the production of semiconductor materials, e.g.
flame synthesis (Pratsinis et al., 1996; Yang et al., 1996; Arabi-Katbi et al., 2001; Wang et al., 2001;
Almquist and Biswas, 2002; Lee and Choi, 2002; Tsantilis et al., 2002;), chemical vapor deposition
(Park et al., 2001; Nakaso et al., 2003b; Kim et al., 2005), thermo decomposition furnace aerosol
reactor (Okuyama et al., 1986; Nakaso et al., 2001; Spicer et al., 2002; Tsantilis and Pratsinis,
2004a; Cho and Biswas, 2006) and plasma process (Kim et al., 2003).
Figure 2.6 sketches the gas-to-particle formation mechanisms including nucleation, condensation,
vapors were nucleating to form primary particles, the primary particles were then grown to
secondary particles from the mechanism condensation, coagulation and the coalescence.
During the last decade, there has been a rapid growth in controlling size of particle due to the
development of nanotechnology. It has been the object of increasing number of studies not only on
producing the nano-sized particles, but also on narrowing the particle size distribution. In this
section, literatures that related to this study were reviewed and summarized on the factors or
mechanisms in controlling the particle size and the size distribution.
2.3.1. Nucleation controlled synthesis
The nucleation while occurred without another foreign phase is called homogeneous nucleation
and is commonly appeared during materials manufacture processes via gas phase reaction. On the
contrary, heterogeneous nucleation was occurred in the presence of nuclei particles and is often
appeared in atmospheric environment (Kodas and Hampden-Smith, 1999). In the precursor vapor
phase, some atoms or molecules can be formed as clusters by random collisions, and the clusters
would be grown or dispersed in the vapor phase (Kodas and Hampden-Smith, 1999; Friedlander,
2000).
For a supersaturated vapor, the sufficiently large clusters were reached to thermodynamically
stable state and then formed particles. In this state, the partial pressure around the particles was
larger than the vapor pressure on the curved surface of particle. This phenomena is called Kelvin
S T k v d B p ln 41 (7)
The σ(ergs/cm2) is surface tension, v1(cm3) is molecular volume, kB is Boltzmann’s constant, T
(K) is temperature, and S is saturation ratio. The S is defined as p1/pe, p1 is the partial pressure of
species 1 and pe is equilibrium vapor pressure over a flat surface. Therefore, the primary particle
size can be controlled by the concentration of monomer or the temperature of process. In this mode,
the primary particle size increased with increasing concentration of precursor (Kim et al., 2005; Yin
and Alivisatos, 2005).
2.3.2. Coagulation controlled synthesis
The mode of coagulation controlled synthesis is commonly occurred at high concentration of
particles and accompanied the collision and coalescence for particles growth. The hardness and
fractal dimensions of agglomerates are depended on the conditions of process (Friedlander, 2000;
Kodas and Hampden-Smith, 1999). Figure 2.7 shows two modes of particles growth by collision
and coalescence. The characteristic time for collision (τc) was defined as the average collision time
between two particles, and the time for two contacted particles to coalescence was τf, and αwas
defined as τc/τf. When τc>>τf(α→∞), the coalescence rate is much faster than the collision rate and
is not a strong function of properties of materials. When τf >>τc (α→0), colliding particles cease to
form a fractal-like agglomerates. The primary particle size is mainly a function of the parameters
that control the rate of coalescence. The intermediate situation (α→1) may commonly be appeared
sintering rate and favors to form the spherical and the greater particles (Friedlander, 2000; Kodas
and Hampden-Smith, 1999; Kuster and Pratsinis, 1995).
The mechanisms of coagulation and coalescence have been utilized for narrowing particle size
distribution. The narrowing size distribution of particles was produced by avoiding coagulation of
particles (Adachi et al, 2003; Kim et al., 2003; Nakaso et al., 2003a; Kuster and Pratsinis, 1995).
On the contrary, narrowing size distribution of particles also can be approached by enhancement of
coalescence/sintering rate (Lee and Choi, 2002; Nakaso et al., 2003b; Tsantilis and Pratsinis,
2004a).
2.3.3. Condensation controlled synthesis
The mode of condensation controlled synthesis is often occurred at low concentration of particles.
In this mode, the nucleated particles were grown by the mechanism of condensation. Not only the
monomers were condensed to the surface of particles, but also the precursor was deposited on it.
The particles grown by the condensation of monomers and the reaction of deposited precursor on
the surface is shown in Figure 2.8, using the TiO2particle as an example.
In the condensation controlled synthesis, the diameter of particle, surface area, concentration of
monomer, reactor temperature, and the residence time are all influential factors of the size
distribution of generated particles. Some studies indicated that the surface grown of TiO2could be
utilized for narrowing the size distribution of particles by increasing the surface reaction rate or the
Pratsinis, 2004a). Such higher rate of condensation and surface reaction lead to the higher growth
rate of smaller particles than that of greater particles (Yin and Alivisatos, 2005).
2.3.4. Dielectric barrier discharge
The atmospheric pressure plasma of dielectric barrier discharge (DBD) was developed for ozone
production by Siemens in 1852. It has also been applied to the air pollutant removals (Chang et al.,
1992; Lin and Bai, 2001), surface treatment (Thyen et al., 1997), and the SiO2thin film deposition
(Foest et al., 2003; Martin et al., 2004). The atmospheric pressure plasma has also been utilized for
enhancing the capture of ultra-fine particles (Kulkarni et al., 2002). An atmospheric pressure plasma
process was first employed in this study for the generation of nanoparticles. It is regarded as one of
the PECVD processes except that it is operated under atmospheric pressure and temperature (Bai et
al., 2004; Chen et al., 2006).
The chemical reactions in plasma can be classified into homogeneous and heterogeneous
reactions. The homogeneous reactions occur between species in the gaseous phase as the result of
inelastic collisions between electrons and heavy species (Grill, 1992; Lieberman & Lichtenberg,
1994). Table 2.4 lists the homogenous reactions of electrons with heavy species and reactions
between heavy species. The major energy transfer from electrons to heavy species takes place by
inelastic collisions, and then leads to a variety of reactions. The excitation of molecule A2 can be
vibrational, rotational, or electronic. The dissociative attachment, ionization and the dissociation are
Reactions between heavy species occur during the collisions of molecules, atoms, radicals, and ions.
The reactions were separated in two types, ion-molecule and radical-molecule reactions. The
density of radicals is much higher than that of ions in plasma, but ion-molecule reactions can have
significant contributions to plasma chemistry and can enhance the rate of the total reaction
Table 2.4 Homogeneous chemical reactions in plasma reactor (summarized from Grill, 1992) Reactions of electrons with heavy species
Excitation e + A2→ e + A2* Dissociation e + A2→ e + 2A Dissociative ionization e + A2→ e + A++ A -Ionization e + A2→ 2e + 2A+ e + A2→ 2A -e + A2→ 2e + A++ A Recombination e + A2+→ A2 Detachment e + A2-→ A2
Reactions between heavy species Ion-molecule reaction Recombination of ions A++ B-→ AB + hv A++ B-→ A* + B* + hv M + A++ B-→ AB + M Charge transfer A++ A → A + A+ Radical-molecule reaction Electron transfer A + B → A++ B -Ionization A + B → A++ B + e Penning ionization B* + A → A++ B + e Penning dissociation B* + A2→ 2A + B A: Gas atom B: Gas atom M: The three body *: Excited state
Molecules
CollisionClusters
NucleationParticles
Condensation
Coagulation
Sintering/Coalescence
Agglomeration
1 ~ 0 Figure 2.7 Effect of characteristic times (Friedlander, 2000)
Chemical
reaction
TTIP (Precursor) (CHmOn)xTiO
2Monomer
condensation
TiO2monomer/ clusterPrecursor deposition &
Surface reation
TTIPNucleation
Particle
growth
TiO
2CHAPTER THREE EXPERIMENTAL METHODS
3.1. PREPARATION OF THE N-DOPED TiO2PHOTOCATALYST
3.1.1. Preparing N-doped TiO2particles under different process parameters
The APPENS process for generating TiO2nanoparticles is sketched in Figure 3.1. The aerosol
reactor was a wire-tube type DBD reactor operated at atmospheric pressure and low temperature
conditions. The plasma also can be utilized as plate type reactor also shown in figure 3.1. Titanium
tetraisopropoxide (TTIP; Ti(OC3H7)4; 98%, Acros, USA) and H2O were used as the precursor
solutions for generating TiO2 nanoparticles in this study. The precursors were vaporized and sent
into the plasma reactor via passing the carrier gas through two series of impingers, they were
controlled at temperatures (TB101, Tungtec instrument, Taiwan) of 100~200°C and 25°C,
respectively, for TTIP and water. The N2 carrier gas was controlled by mass flow controllers
(5860E, Brooks, USA), and the total flow rate of precursor vapors was 137.4 sccm (cm3/min at 0℃).
The applied voltage of plasma system was supplied by alternative current (AC) power supply
(2700M-05, Chenhwa, Taiwan) and amplifier (1:107, Hsinhsin). The plasma reactor was made of
Pyrex glass with 21 mm I.D., 23 mm O.D. and 200 mm in length. One electrode was a stainless
steel (SS 316) rod of 2 mm in diameter positioned along the central line of the reactor. The other
electrode was a sheet of stainless steel mesh wrapped around the reactor with wrapping length of
The applied voltage, frequency and the precursor molar ratio were the controlling factors of
particle size distribution generated by the APPENS process, aa shown in Table 3.1. The applied
voltage was adjusted in the range 0~10.20 kV, the frequency of AC was 60, 120 or 240 Hz, and the
precursor molar ratios controlling TTIP/H2O volumetric flow rate ratio, were from 0.125 to 8. The
corresponding TTIP/H2O molar ratios were calculated from the vapor pressure of TTIP and H2O to
be 0.4 to 76.1, based on the equilibrium equation at a certain TTIP bubbling temperature (Duminica
et al., 2004), ) ( 3222 465 . 9 ) ( log K T Torr PTTIP , (8)
where PTTIPis the TTIP vapor pressure (Torr), and T is the TTIP bubbling temperature (°K).
3.1.2. Preparation of different types of N-doping status of TiO2photocatalysts
The same APPENS reactor was utilized for preparing different type of N-doping status of TiO2
photocatalysts. The alternative current (AC) at 60 Hz frequency was applied to the APPENS reactor.
The reactor was operated at 9.6 kV/cm electrical field strength under atmospheric pressure
conditions. The compositions of carrier gas (Ar/N2/O2) were controlled by mass flow controllers.
The total flow rate of precursor vapors was 137.4 sccm with TTIP/H2O volumetric flow rate ratio of
1.0. The carrier gases of N2 or O2 molecules were excited in the non-thermal plasma environment
and N atoms or N-containing molecules were implanted into the TiO2vapor precursors or particles.
The product particles were deposited on the inner surface of the reactor for further photocatalytic
The four different types of N-doping in the TiO2 particles were conducted under different plasma
and annealing gas compositions. The photocatalysts produced under the four tests were denoted as
SYN1 to SYN4 in the hereafter. After 10 hours of the plasma process, the product particles were
then annealed at 500℃ for 3 hours with a gas flow rate of 9.2 sccm. SYN1 and SYN2 were
processed under the same plasma gas environment composed of pure N2 gas. SYN3 was produced
without the presence of N2 gas for the purpose of producing pure TiO2 particles without any
N-doping. The plasma gases for producing SYN4 were combined 10% N2, 10% O2, and 80% Ar,
and the annealing gases were 20% N2and 80% Ar.
Table 3.2 shows synthesized gas compositions for obtaining different types of N-doping in the
TiO2particles. SYN1 and SYN2 were processed under the same plasma gas environment composed
of pure N2 gas, then SYN1 was annealed under air environment while SYN2 was annealed with
20% N2 + 80% Ar gases. SYN3 was produced without the presence of N2 gas for the purpose of
producing pure TiO2particles without any N-doping. It was processed at 20% O2+ 80% Ar plasma
and annealing gas environment. The plasma gases for producing SYN4 were 10% N2 + 10% O2 +
Table 3.1 List of parameters for producing different TiO2particles Bubbling temperature (℃) Frequency (Hz) Applied voltage (kV)
Precursor molar ratio (TTIP/H2O) 0 11.9 6.48 11.9 8.58 11.9 9.6 0.4, 0.7, 1.5, 3.0, 6.0, 11.9, 23.9 60 10.2 11.9 120 10.2 11.9 150 240 10.2 11.9 200 60 9.6 2.4, 4.8, 9.5, 12.7, 19.0, 28.5, 38.1, 57.1, 76.1
Table 3.2 Plasma and annealing gas compositions for synthesizing different TiO2based
photocatalysts.
Photocatalysts Plasma Gas Anneal Gas
SYN1 100% N2 Air(20% O2+ 80% N2)
SYN2 100% N2 20% N2+ 80% Ar
SYN3 20% O2+ 80% Ar 20% O2+ 80% Ar
3.2. CHARACTERIZATION OF N-DOPED TiO2PHOTOCATALYST
3.2.1. The morphology, size, crystal phase and absorption spectra of N-doped TiO2particles
The nanoparticles deposited on the reactor wall were collected for further analyses by Scanning
Electron Microscope (SEM; S4700, Hitachi, Japan) and Transmission Electron Microscope (TEM;
TECNAI 20, Philips, Japan). The SEM microscope was operated at accelerating voltage of 5-15 kV
and the images were collected under a vacuum of 10-8 torr, all of the samples for SEM analysis
were coated with platinum. The samples for TEM analysis were coated on the copper mesh and
operated at accelerating voltage of 200 kV and under a vacuum of 10-9 torr. The X-ray Powder
Diffractometer (XRPD; Rigaku, Japan) was used to determine the crystal phase of produced
particles. The XRPD was operated under 30kV and 20mA with Cu target, all samples for XRPD
analysis were coated on the glass (20 mm× 20 mm) as thin films. The geometric mean diameter
(Dpg) and geometric standard deviation (σg), were determined based on averaging over 80 particles
as observed from the SEM images. And for on-line measurement of particle size distribution, a
Scanning Mobility Particle Sizer (SMPS; 3080L, TSI, USA) was connected after the APPENS
reactor to determine the Dpg, σg, and the total mass concentration (TMC) of generated particles. The
volumetric flow of SMPS measurement was 0.3 L/min. In order to achieve the minimum required
flow rate of the SMPS, a N2 dilution gas stream was introduced after the plasma reactor with a
N2/aerosol dilution flow rate ratio of 1.0 (i.e. the inlet flow rate to the SMPS is double of the reactor
rate ratio of 12.0 was sometimes introduced (i.e. the inlet flow rate to the SMPS is 13 times of the
reactor outlet flow rate). The UV–Visible diffuse reflection spectra were measured by a
spectrophotometer (U-3010, Hitachi, Japan) with 60 mm integrating sphere. The scan speed of
spectrophotometer was 600 nm/min, all samples for diffuse reflection spectra analysis were coated
on the glass (20 mm× 20 mm) as thin film.
3.2.2. The N-doping status of the N-doped TiO2particles
The N-doping status of the N-doped TiO2 was analyzed by XPS (PHI 1600, Perkin Elmer) using
Al KαX-ray source (1486.6 eV) and under ultra-high vacuum (5.0×10⁻⁹ torr). All data from XPS
analysis were calibrated with the binding energy of C in 284.5 eV. It must be noted that binding
energy of XPS data is binding of electron in the atom, not binding between atoms. So one can not
directly assign a chemical bond between the Ti, O and N atoms in the presence of a given peak in
XPS spectra. But one can speculate the chemical bond, e.g., it is Ti-N or Ti-(NO), by a cross
comparison of the chemical shifts of Ti, O and N atoms from the XPS data.
Thus in this study chemical bonds between Ti, N and O atoms were proposed first by comparing
the chemical shift of elements and then confirmed by cross comparison of the chemical shift of Ti
2p, O 1s and N 1s atoms. The raw XPS data were filled using a non-linear least-squares splitting
program by Gaussian- Lorentzian function after performing a Shirly-type background subtraction.
The binding energy of Ti 2p, N 1s and O 1s be identified as TiO2and TiN at 2p3/2and 2p1/2, and be
3.3. PHOTOCATALYTIC DECOMPOSITION OF VOCs AND NOx BY TiO2
PHOTOCATALYST
3.3.1. Photocatalytic degradation of VOCs in a batch reactor
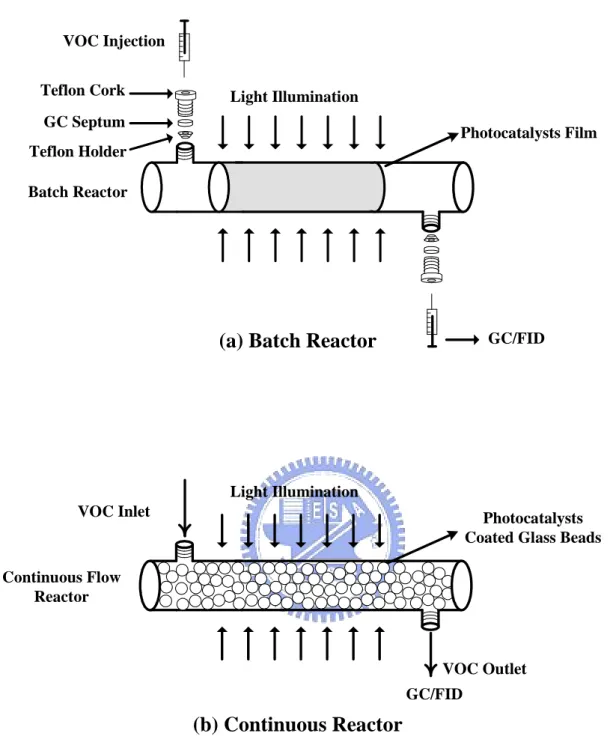
A batch photocatalytic reactor for IPA and Toluene removal is sketched in Figure 3.2(a). The
reactor was essentially the same device as the one used for producing the TiO2particles, except that
the inlet and outlet ends were sealed to form a batch-type configuration. Before the photocatalytic
reaction test, small amounts of IPA (0.04 μL) or toluene (0.01 μL) were injected into the sealed
reactor by syringe at a constant temperature of 45±3°C and relative humidity of 70±5%. After 60
min, the IPA and toluene reached a steady-state vapor concentration of 145±1 and 250±10 ppm as
confirmed by a GC/FID (9800, China Chromatography) at the oven temperature of 90℃. The
illuminating light was then turned on and the concentrations of target pollutants subjected to the
photocatalytic decomposition by either the TiO2or the N-doped TiO2photocatalysts were recorded.
To avoid the diffusion limitation in a batch reactor, the light was turned off for 30 min after each
sampling to ensure well mixture of the air pollutant molecules, and then the light was turned on
again to continue the photocatalysis tests.
The illumination light sources used in the batch and continuous flow photocatalytic
decomposition studies were either UV (364.2 nm; FL10BLB, Sankyo Denki) or visible light
(FL10D-EX, Tyo Light) sources having the same output power (10 W). To facilitate understanding
in this study is simply the one used in household living space. Both the intensity and the spectra of
the light sources were obtained from a spectrophotometer (USB2000, Ocean Optics). The intensities
of illumination in the reactor were 3.78 mW/cm2for UV light source and 4.81 mW/cm2 for visible
light source. The light spectra of the visible light source are shown in Figure 3.3 with major peaks
observed at 435, 488, 545, 587 and 611 nm. One can also observed a very small peak for visible
light lamp at UV range of 364 nm with intensity of 0.35 mW/cm2. To ensure the effect of this small
peak at 364 nm on visible light photocatalysis, a photocatalysis test was also conducted with UV
lamp (364.2 nm) of 0.43 mW/cm2 intensity (a precise control of the light intensity to be 0.35
mW/cm2 was not feasible during the test), and the results revealed that both the IPA and toluene
removals can be neglected under this condition.
3.3.2. Photocatalytic degradation of VOCs in a continuous flow reactor
In addition to the batch-type decomposition studies, continuous flow (with a schematic diagram
shown in Figure 3.2(b)) studies targeting toluene removal were also performed using 5 mm glass
beads (Beco Mfg Corp., German) as the packing media. The glass beads were directly deposited
with N-doped TiO2 after 10 hours of the plasma process. The Brunauer-Emmett-Teller (BET)
surface area of the glass beads was determined (ASAP 2020, Micromeritics) to be 0.0278 m2/g with
negligible pores by nitrogen-adsorption- desorption isotherm at 77 ˚K. The mass of the coated
photocatalysts per clean glass beads was 1.17 mg/g, and the mass of photocatalyst per surface area
For comparison basis, approximately the same amounts (±0.07 mg/g) of ST01 and P25
photocatalysts as the N-doped TiO2 were also coated on the glass beads and tested in separate
reactors under the identical conditions. The commercial photocatalysts of ST01 (Ishihara Sangyo)
and P25 (Degussa) powders were dispersed into the deionic water to a concentration of 50 g/L.
Then the clean glass beads were dipped into the slurries and dried at 105℃. The glass beads were
weighted before and after coating procedure to determine the actual coating amount of ST01 and
P25 on the glass beads.
The toluene vapor was obtained from an impinger with clean air as the carrier gas, with the total
gas flow rate of 18.3 sccm and typical toluene concentration of 463±13 ppm. The reaction
temperature and the relative humidity were maintained at 25°C and 70%, respectively. The
corresponding residence time in the continuous flow photocatalytic reactor was 2.35 min. Blank
tests were conducted for both batch and continuous flow photocatalytic tests. The blank tests
included those conducted with catalyst but without illumination, and those without catalyst but with
light illumination. Each type of blank tests showed that the removals of IPA and toluene vapors are
negligible.
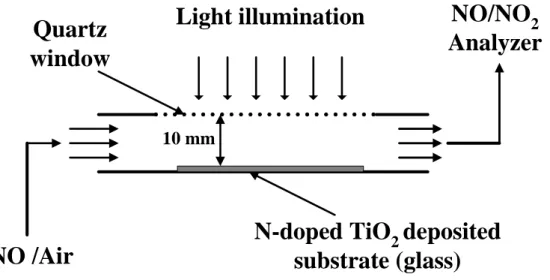
3.3.3. Photocatalytic degradation of NOx in a continuous flow reactor
The weight of synthesized N-doped TiO2 was 0.1 g coated on a glass substrate by a spray gun
(GP-1, Longyea, Taiwan). The dimension of glass substrate was 5 cm 20 cm (WL). A
between the quartz window and the bottom of the reactor is 1 cm. The illumination light sources
used in the continuous flow photocatalytic reactor were in either UV or visible light ranges. The
intensities of illumination in the reactor were 2.5 mW/cm2 for UV light source and 3.18 mW/cm2
for visible light source. The inlet concentration of NO was 10-18 ppm, the relative humidity was 50
± 5%, the total volumetric flow was 137.4 sccm and the residence time was 33.3 sec. The
chemiluminescence NO/NO2 analyzer (S5012, SIR, Madrid-Spain) was utilized for the NO, NO2
and NOx measurements during photocatalytic tests. The operating temperatures of converter and
GC/FID VOC Inlet
Light Illumination
Photocatalysts Coated Glass Beads Continuous Flow Reactor VOC Outlet GC/FID VOC Injection Photocatalysts Film Batch Reactor Light Illumination GC Septum Teflon Cork Teflon Holder
(a) Batch Reactor
(b) Continuous Reactor
Figure 3.2 Schematics of the (a) batch type and (b) continuous flow photocatalytic reactors for VOCs removal.
0 200 400 600 800 1000
Wavelength (nm)
P
h
o
to
n
fl
u
x
(a
.u
.)
Figure 3.3 The light spectra of the visible light source used in this study. The five major peaks were observed at 435, 488, 545, 587 and 611 nm.
Light illumination
N-doped TiO
2deposited
substrate (glass)
Quartz
window
NO/NO
2Analyzer
NO /Air
10 mmCHAPTER FOUR RESULTS AND DISCUSSION
4.1. PREPARATION OF N-DOPED TiO2PHOTOCATALYST BY APPENS PROCESS
4.1.1. The feasibility of non-thermal plasma to generate nanosize TiO2
Because the non-thermal plasma process has never been applied to generate both TiO2 and
N-doped TiO2particles, the feasibility of the process for generating TiO2particles was tested first in
this study. As the system was operated in the absence of applying atmospheric pressure plasma,
polydisperse particles were formed as observed by SEM image shown in Figure 4.1(a). The particle
distribution of size was very broad, which ranged from nano- to micron-sizes. The micro-sized
particles can be either in spherical, porous or doughnut shapes, forming from direct hydrolysis of
TTIP precursor vapors or highly agglomeration of primary nano-TiO2particles.
The SEM and TEM images of particles produced in plasma environment, i.e. by the APPENS
process, are shown in Figures 4.1(b) and 4.1(c). As the precursor vapors were nucleating to form
primary particles, their growth was hindered due to the AC applied voltage that produced ions of
the same sign at a time. The particles were all charged either in positive sign or in negative sign and
repelled each other. Besides, the local thermal equilibrium plasma under alternating current
provides a near neutral environment, thus a neutralizer may not be required after the non-thermal