國立交通大學
材料科學與工程學系
博士論文
以
PS-b-PEO 與 PS-b-P4VP 塊式高分子操
控
CdS 奈米粒子形成二維與三維奈米陣
列並探討其對於塊式高分子型態之影響
Fabrications of 2-D and 3-D CdS Arrays by PS-b-PEO and
PS-b-P4VP Templates and Effects of CdS on the Morphological
Transformation of Block Copolymers
研究生: 葉孝蔚
(Siao-Wei Yeh)
指導教授: 韋光華
(Kung-Hwa Wei)
Abstract
In this thesis, 3-D nanostructure of CdS clusters by dispersing pre-synthesized CdS nanoparticles, containing hydroxyl groups on surface, in the PEO block selectively of polystyrene-b-poly(ethylene oxide) (SEO) block copolymers as template in the bulk form was prepared, and the effects of surface-modified CdS nanoparticles on the crystallinity and morphological transformation of bulk SEO block copolymers were discussed in Chapter 2. In the Amorphous-Crystalline Bulk SEO system, CdS nanoparticles hinder crystallization of PEO domains, and induce the composites form a structure decided by the volume fraction only. (BCC structure for VPEO/HSEO = 0.11, and HEX
structure for VPEO/LSEO = 0.39)
The effects of hydrogen bonding between surface-hydroxylated CdS clusters and PEO chains on morphological transformation of the CdS/SEO thin film were illustrated in Chapter 3. Ordered 2-D spatial arrangement of CdS clusters in monolayered SEO thin films by using solvent selectivity to sequester CdS nanoparticles in PEO domains of SEO block copolymer thin films was fabricated. Large-scale ordered structure of CdS clusters is available by a patterned substrate. Surface-modified CdS nanoparticles maintain their original optical properties.
Moreover, the morphological transformation of polystyrene-b-poly(4-vinylpyridine) (S4VP) to a lamellar structure from a cylindrical structure by incorporating CdS
nanoparticles were also demonstrated in Chapter 4. CdS nanoparticles, in this case, containing a chemically-active carboxylic acid groups on surface were modified by mercaptoacetic acid and connected to the pyridine groups in the poly(4-vinylpyridine) (P4VP) chains of S4VP block copolymers. This morphological transformation, induced by hydrogen bonding between CdS nanoparticles and P4VP chains, is consistent with the phase diagram predicted by a theoretical study of the copolymer/particle mixture system.
also affected by the interaction parameter. The interaction parameter between the two phases in nanoparticles/block copolymers system is related to the intermolecular force between nanoparticles and block copolymers, such as the formation and reduction of hydrogen bonds and crystallization.
摘要
此論文主旨為利用有機雙塊式高分子自身組織成二維與三維週期性結構的特
性作為模版,操控無機CdS 奈米粒子,形成特定結構之奈米陣列,並探討 CdS 奈米
粒子對塊式高分子結構造成之影響。
在第二章中,利用不同分子量之PS-b-PEO 塊式高分子操控 CdS 奈米粒子形
成體心立方(body-center cubic)與六方柱狀(hexagonal-packed cylinders)結構之奈米複
材,並探討CdS 奈米粒子表面之-OH 基對於塊式高分子微結構之影響。CdS 奈米粒
子破壞PEO domains 的結晶特性導致在 amorphous-crystalline PS-b-PEO 中的奈米複 材之最後結構將僅取決於其體積分率。 在第三章中,以不同分子量之PS-b-PEO 塊式高分子操控 CdS 奈米粒子製備形 成二維特殊結構CdS 陣列,並探討 CdS 奈米粒子表面之-OH 基對於塊式高分子薄膜 結構從柱狀結構至球狀結構之轉換。 可利用分子量來操控 CdS 奈米團的間隔,並 可以利用patterned substrate 來達到大面積的規則結構。 CdS 奈米粒子的光學特性 並不會因為塊式高分子操控的影響改變其原本光學特性。 第四章中則利用 PS-b-P4VP 塊式高分子操控 CdS 奈米粒子形成層狀結構之奈米 複材,並探討 CdS 表面-COOH 基對於塊式高分子結構從柱狀結構至層狀結構之轉換。 此種奈米結構轉換結果與文獻中理論推導的計算結果相符合。 我們藉由本論文的研究結果可以得到以下結論,利用奈米粒子與對於塊式高分子之 間所造成的分子間作用引力(結晶形成與破壞、形成氫鍵之強弱),將會影響塊式高 分子兩項間的引力參數(interaction parameter),進而影響奈米複材最後之結構與 特性。
論文口試結束後,開車回家的路上,七年來在實驗室的點滴,投影片般浮現在 腦海裡。 從大學四年級剛進實驗室的專題研究到博士論文的口試完成,萬分感謝指導教 授韋光華老師的指導,使我在人格特質與專業能力上都有顯著的成長。 感謝我的口試委員梁耕三老師、鄭有舜博士、邱文英老師、黃華宗老師、林宏 洲老師,在您們的指導下,讓我獲益良多,真的感謝!! 在論文的研究過程中,尤其要感謝同步輻射中心梁耕三老師、鄭有舜博士、孫 亞賢博士、賴英煌博士與學妹的男友品鈞學長在實驗研究與討論上的協助,也讓我 學習到嚴謹的態度及深入的探討是作研究的必備條件。 在研究生生涯的學長、學姐們,充哥、小田學長、田帥帥、良祐、米奇、小豬 等學長們,在這段時間的教導與鼓勵,讓我克服了萬難往前的衝、衝、衝。蔡欣瑩 學姐不時的牛肉麵午餐邀約,讓我在實驗彈性疲乏之餘,可以藉牛肉的香味及好喝 的湯頭讓我精神百倍。 另外感謝實驗室曾經在我研究生生涯出現過的大大小小,蕭家傑學長、吳昭瑩 學姐,振道與岱慶的酒量、已婚的麗娟阿姐仔的麻辣鍋與芒果青、房子在竹北的汪 信亨、令人難忘的巫真瑋、雙胞胎的老爸兼實驗室亂源 apo、龜龜的阿標、善良愛 哭又不聯絡的沈妙玲、在工研院放火的鄭欽峰、好心的老周跟耀德、聰明好心又不 像處女座的琬琪、老師最疼的世莉、嘰哩刮啦又可愛又好心的克瑤、閱人無數的阿 茂、阿茂的同學阿諄、無機三人組(學弟的女友靜怡、天才孟婷與麻棘手含章)、學 妹的男友機車大饅頭、牛一般的國峰、遠在中研院的小玫、其實蠻愛講話也是天蠍 座的許公子、實驗室明日之星邱茂源與王旭生、要直升又成績不好的陳振平、搬家 用的李紹睿,還有三位印度籍洋將 Reddy, Kens and 好心又認真的 Dina,都讓人印 象深刻。 另外,隔壁實驗室的趙老大、美蕙學姐、”龜中之王”小賢、學長的女 友佩君學姐、香味十足的南哥、在德國打拼的守謙、台積電的淑慧、有前途的帥哥 阿家、在旺宏的虎爛王黃俊清……,也感謝他們在這過程中的參與。 最最最最最最感謝的是遠在高雄的爹娘,感謝您們的包容與支持鼓勵,太感謝 了!!! 還有所有的親友們,岳父、岳母,愛犬小雷,感謝感謝!! 我親愛的老婆,天鳳,感謝你這幾年來的犧牲、包容與支持,有妳真好!!還 有我的貓咪,gugi,在我弄 paper 很累時,看到妳心情就變好了。 還有關心我的朋友們、赤兔隊友與球友們,謝謝大家!!
Table of Content
Chapter 1: Introduction
1-1...Block copolymers ... 1-1 1-2 Nanoparticles ... 1-5 1-3 The reason for the research ... 1-5 1-4 Materials ... 1-6 Chapter 2: Effects of CdS in SEO bulk samples
2-1···Introduction Materials ... 2-1 2-2···Methods and Analysis ... 2-2 2-3 Results and Discussions
A. CdS-induced morphological transformation of bulk HSEO ... 2-4 B. CdS-induced structural change of bulk LSEO ... 2-8 2-4 Conclusions ... 2-12 Chapter 3: Effects of CdS in SEO thin films
3-1 Introduction ... 3-1 3-2 Methods and Analysis ... 3-3 3-3 Results and Discussions
A. Fabrications of ordered CdS clusters by SEO thin films ... 3-4 B. The effects of CdS nanoparticles on morphological changes of CdS/LSEO
thin films ... 3-8 3-4 Conclusions ... 3-12 Chapter 4: Effects of CdS in S4VP bulk samples
4-1 Introduction ... 4-1 4-2 Methods and Analysis ... 4-2 4-3 Results and Discussions ... 4-3 4-4 Conclusions ... 4-7 Chapter 5: Conclusions ... 5-1
Chapter 1: Introduction
Figure 1-1-1 Schematics of AB diblock and ABA triblock copolymers ... 1-13 Figure 1-1-2 Possible phase separated morphologies in PD-PS block copolymer systems.
... 1-13
Figure 1-1-3 Typical nanostructures indicating the LAM: lamellar, HCPC: hexagonally
packed cylinders, PC: primitive or simple cubic, BCC: body-centered cubic, FCC: face-centered cubic, HCPS: hexagonally closed packed spheres, DD: double diamond, Ia_3d and Pm_3n (adapted from Burger 2002). ... 1-14
Figure 1-4-1 SAXS data for the DMF solution of 0.035 wt. % M-CdS nanoparticles (U.
S. Jeng, Y. S. Sun, H. Y. Lee, C. H. Hsu, and K. S. Liang, S. W. Yeh, K. H. Wei, “The binding effect of surface-modified cadmium sulfide on the microstructure of PS-b-PEO block copolymers”, Macromolecules 2004, 37, 4617.) ... 1-15
Figure 1-4-2 (a) UV-vis absorption and photoluminescence spectra of
mercaptoethanol-modified CdS nanoparticles in N, N-dimethylforamide (DMF). (b) The X-ray diffraction curve of mercaptoethanol -modified CdS nanoparticles. ··· 1-16
Chapter 2: Effects of CdS in SEO bulk samples
Figure 2A-1 Synchrotron SAXS curves of HSEO and CdS/HSEO... 2-19 Figure 2A-2 (a) TEM image of HSEO stained by OsO4. The dark regions correspond to
PEO phases stained with OsO4. (b) TEM image of CdS/HSEO without staining. (c)
AFM images of thin films microtomed from bulk HSEO and (d) AFM images of thin films microtomed from bulk CdS/HSEO... 2-20
Figure 2A-3 (a) DSC analysis of CdS/HSEO and HSEO. The samples were heated
from -90oC to 130oC at 10oC/min. (b) Deconvolution curves of the WXRD curve of crystallinity HSEO. (c) WXRD of HSEO and CdS/HSEO after crystallization at -20oC for 18 hr. ... 2-21
measured at 30 °C and 200 °C, respectively. The inset shows SAXS data measured for the pure HSEO copolymer at 30 °C and 100 °C. Note that at 100°C, the profile of the pure copolymer is structureless after Q ~ 0.06 Å-1. ... 2-22
Figure 2A-5 Photoluminescence spectra of CdS and CdS/HSEO after excitation with
430-nm light... 2-23
Figure 2A-6 TEM images for the 14%CdS/HSEO composite at 200°C. ... 2-24
Figure 2B-1 (a) DSC, (b) and (c) X-ray diffraction curves of CdS/LSEO with various
CdS nanoparticle content. ... 2-28
Figure 2B-2 FTIR spectra of the CdS/PSEO in a selected region: C-O-C symmetric and
asymmetric stretching (1200-1000 cm-1). ... 2-29
Figure 2B-3 Small-angle X-ray scattering of CdS/LSEO nanocomposites with various
CdS nanoparticle content. ... 2-30
Figure 2B-4 TEM images of (a) LSEO stained with OsO4, (b) 7% CdS/LSEO, (c) 14%
CdS/LSEO, (d) 28% CdS/LSEO, and (e) 43%/LSEO... 2-31
Figure 2B-5 Photoluminescence spectra of CdS nanoparticle in DMF and CdS/LSEO
with various CdS nanoparticle content. ... 2-32
Chapter 3: Effects of CdS in SEO thin films
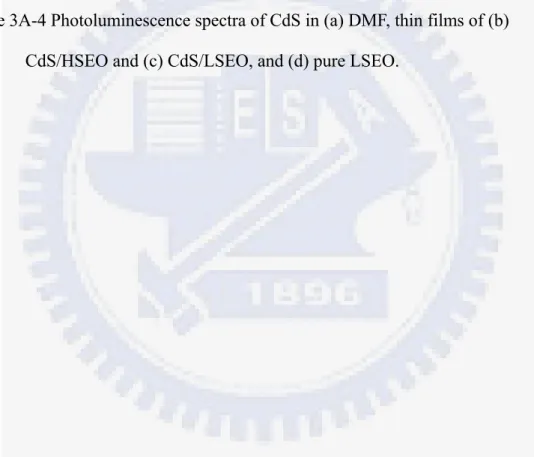
Figure 3A-1 (a) AFM image of a CdS/HSEO thin film supported on a carbon-coated
silicon wafer. (b) TEM image of CdS/HSEO thin film after removal from a carbon-coated silicon wafer with 1% HF solution. ... 3-20
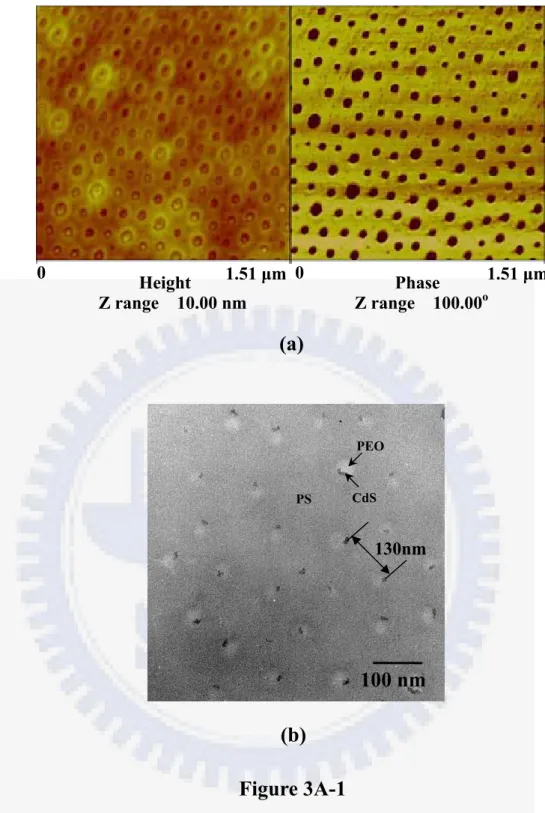
Figure 3A-2 (a) AFM image of a CdS/LSEO thin film supported on a carbon-coated
silicon wafer. (b) TEM image of a CdS/LSEO thin film after removal from carbon-coated silicon wafer with 1% HF solution. ... 3-21
Figure 3A-3 Phase contrast AFM images of a CdS/LSEO thin film on a patterned
substrate with 400-nm wide grooves. ... 3-22
Figure 3A-4 Photoluminescence spectra of CdS in (a) DMF, thin films of (b) CdS/HSEO
and (c) CdS/LSEO, and (d) pure LSEO... 3-23
carbon-coated silicon wafers. Figure 1(e). The SEM cross-sectional image of 28 wt.-% CdS nanoparticles in SEO thin film... 3-25
Figure 3B-2 1H NMR spectra of (a) 0, (b) 7, (c) 14 and (d) 28 wt.-% CdS/SEO and (e) D2SO4 in SEO in d-toluene after normalization. Figure 3A-3(f). A 2-D 13C-1H NMR
spectrum of 14 wt.-% CdS/SEO. Figure 3A-3(g). NMR spectra of 14 wt.-% CdS/SEO at different temperatures (21 and 60oC)... 3-26
Figure 3B-3 The comparisons between the percentage of shifted CH2O protons in PEO
(blue solid dots) and the percentage of CdS/SEO morphological spheres (white hollow squares) for various CdS content ... 3-27
Chapter 4: Effects of CdS in S4VP bulk samples
Figure 4-1 Transmission electron microscopy (left side) and phase contrast atomic force
microscopy (right side) images of bulk pure S4VP and S4VP containing 7% and 28% CdS particles by weight. ... 4-13
Figure 4-2 Small-angle X-ray scattering curves of pure S4VP and S4VP containing 7%
and 28% CdS nanoparticles. ... 4-14
Figure 4-3 1H NMR spectra of pure S4VP and S4VP containing 7% and 28% CdS nanoparticles by weight fraction, which respect to P4VP block... 4-15
Figure 4-4 The glass transition temperature of PS and P4VP domains of pure S4VP and
S4VP containing 7% and 28% CdS nanoparticles, which are determined by DSC.4-16
Figure 4-5 Phase diagram of the morphological transformation from a HEX structure of
pure S4VP block copolymers to lamellar structure with selective segregation of CdS nanoparticles in P4VP phase. The diagram was modified from Figure 1(a) in ref. 24(c) by Balazs et al. ... 4-17
Scheme & Table Lists
Chapter 1: Introduction
Scheme 1-1 Synthesis of surface-modified CdS nanoparticles by mercaptoethanol and
mercaptoacetic acid... 1-10
Table 1-1 Characteristic properties of CdS nanoparticles ... 1-11
Chapter 2: Effects of CdS in SEO bulk samples
Scheme 2A-1 Morphological transformation of HSEO diblock copolymer by selectively
dispersed colloidal CdS nanoparticles... ... 2-17
Scheme 2B-1 Crystalline and morphological properties of CdS/LSEO with various CdS
content... 2-25
Table 2B-1 Crystallinity of CdS/PEO composites with various CdS content from DSC
and WAXS results ... 2-26
Chapter 3: Effects of CdS in SEO thin films
Scheme 3A-1 Fabrication of an ordered array of pre-synthesized nanoparticles using a
block copolymer template by spin-coating a micellar solution. Nanoparticles are held in the cores of the micelles... 3-16
Scheme 3B-1 Morphological transformation of PEO cylinders into CdS/PEO spheres via
hydrogen bonding interactions between surface-hydroxylated CdS and PEO.. ... 3-17
Table 3B-1 The percentage and average length of PEO cylinders, the percentage of
CdS/PEO spheres, and the percentage of shifted CH2O protons in PEO that appear in
CdS/SEO thin films for various CdS content.. ... 3-18
Chapter 4: Effects of CdS in S4VP bulk samples
Scheme 4-1 Hydrogen bonding induces the morphological transformation from a HEX
structure of pure S4VP block copolymers to lamellar CdS/S4VP composites with selective segregation of CdS nanoparticles in P4VP phase. The overloading of CdS nanoparticles in P4VP domains causes a curvature of CdS/P4VP lamellar domains and a structural destruction due to the CdS aggregates... 4-11
1-1 Block copolymers
Block copolymers are composed of long sequences ("blocks") of the same monomer unit, covalently bound to sequences of unlike type. The blocks can be connected in a variety of ways; schematics of AB diblock and ABA triblock structures are shown in Figure 1-1-1.
Block copolymers exhibit microphase separation of the dissimilar blocks and self-assemble to a specific 2-D or 3-D structure in a nanometer scale.1 For example, depending upon the relative block volume fraction, spheres, cylinders, or lamellae of PS in a PB matrix are possible. More recently, a bicontinuous
morphology has been observed in PS-polyisoprene (PI) block copolymers. This newly discovered morphology has been coined the ordered bicontinuous double diamond (OBDD). This bicontinuous structure in PS-PI star block copolymers with PI as the major component has been observed.2 Similarly, Hasegawa and coworkers have observed the inverse of OBDD in the linear block copolymers with PS as the major component. Figure 1-1-2 shows the range of microstrucures possible in PS-PI block copolymers. However, these morphologies are considered as applying to PS-PI block copolymer systems.
The morphology will affect the bulk properties of BCP. The properties affected include the mechanical strength and toughness of the polymer as well as the gas permeation properties. For instance, Thomas and coworkers have conducted gas diffusion and solubility studies on various Kraton PS-PB block copolymers, materials exhibiting a variety of morphologies. Models of diffusion and the solubility of gases in the polymers developed by Sax and Ottino were used to predict the diffusional
properties of the carbon dioxide in various membranes. These rather simple models were successful for the various phase separated morphologies investigated, such as body centered cubic spheres, hexagonally packed cylinders, lamellae, and OBDD. These studies show that the gas transport properties are influenced, not only by the volume fraction of the respective blocks, but also by the morphology and connectivity of different phases.
On the other hand, block copolymers in the solution state, like low molecular weight surfactants, form micelles in solvents selective for one of the blocks. Tuzar reported the insoluble block forms the core of such structures, whereas the soluble block forms the corona. The phenomenon of micellization has been studied for many decades by Hamley et al., both from theoretical as well as from the
experimental points of view, due to the potential applications of micellar systems in areas like viscosity modification of fluids, cosmetics, pharmacy, lubrication of surfaces, emulsification, solubilization of insoluble substances, drug delivery and environmental purification methodologies in Tuzar, Haulbrook and Harada groups.
Two of the main questions that predominate in the study of micelle formation by block copolymers are the question of the structure of an isolated micelle and the question of the configuration of a block copolymer chain incorporated in a micelle. Complications arising from the presence of unimers (unassociated copolymer chains), possible long-range ordering of the micelles, intermicellar interactions, etc. should be considered. The generally accepted idea is that most block copolymer micelles are spherical with a relatively compact core consisting of the insoluble blocks and a corona consisting of the soluble ones. The chains in the core can be considered to be in a state resembling the homopolymer melt if the solvent is very poor for them (i.e., highly selective). Tuzar et al. reported that some swelling of the core by solvent molecules cannot be ruled out, especially in cases of low selectivity. The corona is
formed by the soluble blocks, which are in a well-solvated state but considerably stretched because of geometrical constrains, especially in the region near the core. Cylindrical micelles have also been observed in several cases by Nakano, Mortensen, Schillen, Zhao and Ding. This change in the overall structure may be due to the high content of the block copolymer in the insoluble part, to the block copolymer
architecture, and also to the selectivity of the solvent. Clusters of micelles have been identified in Moffit’s and Zhang’s groups.
Applications
Conventional and potential high-technology applications of block copolymers are based on their ability to self-assemble, in bulk or in selective solvents, into ordered nanostructures, with dimensions comparable to chain dimensions.3 By changing the molecular weight, chemical structure, molecular architecture, and composition of block copolymers, the size scale, the type of ordering, and the characteristics of these nanostructures can be manipulated.
Several potential high-technology applications of block copolymers are based on their ability to self-assemble, in bulk or in selective solvents, into ordered
nanostructures. Block copolymers, when dissolved in liquids that are solvents for one block but nonsolvents for the other (i.e., selective solvents), self-associate usually in spherical micelles of nearly uniform size. The insoluble blocks form the core and the soluble blocks the shell of the micelles. This phenomenon can be used for encapsulation and selective delivery or removal of organic/inorganic compounds.
Due to the miniaturization of electronic, optoelectronic, and magnetic devices, nanometer-scale patterning of materials is an important objective of current science and technology. Block copolymers, which have the ability to self-assemble into periodic ordered microstructures, are recognized to be promising candidates for patterning nanostructures. By changing the molecular weight, chemical nature,
molecular architecture, and composition of the copolymer, one can control the size and type of ordering. A few examples of nanopatterning by using block copolymers are presented in the following text.
Nanopatterning is very important for lithography. Nanosizes greater than 150 nm can be routinely produced by photolithography techniques. The minimum size that can be achieved by photolithography is determined by the wavelength of light used in the exposure. Electron beam lithography is commonly used to access feature sizes between 150 nm and 30 nm. However, sizes less than 30 nm are not easily obtained by standard lithography. One way to overcome this problem is by using self-assembled block copolymers. Dense, periodic arrays of holes and dots have been fabricated on a silicon nitride-coated silicon wafer using block copolymers of styrene and butadiene, polystyrene-b-polybutadiene by Park’s and Harrison’s groups. By using the same principle, various dense nanometer patterns can be produced using block copolymers. For example, parallel lines can be produced either by a film of lamellae, which are oriented normal to the substrate or of cylinders that lie parallel to the surface. Diblock copolymers of styrene and methylmethacrylate were used to produce templates for dense nanowire arrays by Thurn-Albrecht et al. The pores can be also filled with silicon tetrachloride, and, by hydrolysis with traces of water
(nanoreactor), an array of silicon oxide posts in an organic matrix is produced by Kim et al.
By using block copolymers, nanoporous and nanorelief ceramic films can be prepared with important applications as selective separation membranes, next
generation catalysts, and photonic materials. The ceramic network structure derived from PI-DG copolymer has potential use in interconnects because of its low dielectric constant, high-temperature stability, and the inherent etch selectivity of this material to photoresist. These periodic and interconnected high dielectric/low dielectric
ceramic/air structures also have potential as photonic band gap materials
1-2 Nanoparticles
Nanoparticles play an important role for nanotechnology and livelihood
applications, for example catalysts, light-emitting diode, etc. Recently, many kinds of metal, metal oxide or semiconductor nanoparticles were reported for applications, such as Au or CdSe nanoparticles for bio-labeling and solar devices, TiO2
nanoparticles for photo-catalysis materials, Co, CoFe2O4 and Fe2O3 nanoparticles
for magnetic applications. For semiconductor nanoparticles with sizes close to their Bohr exciton radius (typically between 1-10 nm), the size-dependent band gap results in tunable optical properties. These semiconductor nanoparticles are termed as quantum dots because their tunable optical properties can be predicted by
quantum mechanics. Among these studies, quantum confined semiconductor nanoparticles, such as CdS and CdSe/ZnS, are highly potential to light emitting diode devices.
1-3 The reason for the research
The interaction between surface-modified nanoparticles and the block copolymer chains to affect the crystallinity and morphology of the block copolymer bulk
samples and thin films is interesting. On the part of block copolymers in bulk form, the selective dispersion of pre-synthesized inorganic nanoparticles in one domain of a block copolymer and the fabrication of 3-D inorganic nanostructures by the block copolymer template improve the potential for optical applications, due to specific properties of nanoparticles and the increase of the refractive index contrast between phase-separated periodic domains of block copolymers. On the other hands, by block copolymer thin films as template, the ordered 2-D inorganic clusters
arrangement is important for several applications, such as nanomasks for lithography, nanotemplates for growing nanostructures, and devices.
1-4 Materials
In this thesis, asymmetric polystyrene-b-poly(ethylene oxide) (SEO) and poly(styrene-b-4-vinylpyridine) (S4VP) are used for this research due to various structures in amorphous-crystalline diblock copolymers and CdS nanoparticles are chosen because of their inherently interesting electronic and photophysical
properties.
For the present study, two asymmetric polystyrene-b-poly(ethylene oxide) diblock copolymers (SEO), having a higher molecular weight (MW) (MWPS/MWPEO
= 125k/16.1k) termed HSEO, and a lower MW (MwPS/MwPEO = 19k/12.6k) termed
LSEO, were used. The volume fraction of PEO in HSEO is 0.11 and that in LSEO is 0.39. Poly(styrene-b-4-vinylpyridine) (S4VP) diblock copolymer with a
molecular weight of 47.6kPS/20.9kP4VP (the volume fraction of P4VP domains being 0.3) was used. These block copolymers, with polydispersion index (PDI) < 1.1, were purchased from Polymersource Inc.
Two kinds of CdS nanoparticles were synthesized with mercaptoethanol and mercaptoacetic acid as the surfactant by reacting cadmium acetate dehydrate
(Cd(Ac)2•2H2O), sodium sulfide (Na2S), mercaptoethanol (HSC2H4OH) in methanol,
following a modification of the kinetic trapping method.4b,4c After filtration, CdS QDs were collected and then dispersed in N, N-dimethylforamide (DMF). In our case, surfactant-modified CdS containing a chemically active hydroxyl and
carboxylic acid groups on surface, as shown in Scheme 1-1, become hydrophilic, and their basic properties are given in Table 1-1. In Table 1-1, The average size of the surface-modified CdS nanoparticles in DMF can be characterized by the Schultz
distribution of a mean radius of 18.4 Å and a polydispersity of 0.5, as shown in Figure 1-4-1.5 Figure 1-4-1 shows the SAXS data for the CdS solution in DMF. The data can be simulated reasonably well (dashed curve) using a spherical shape and the Schultz size distribution shown in the inset. The two key parameters of the size distribution obtained from the fitting process are the mean radius ra = 18.4 Å
and the polydispersity p = 0.5. The most probable radius, rp, calculated is 9.6 Å.
To reduce fitting parameters, we have fitted the data to in an absolute scattering intensity scale, using the CdS concentration 0.035 wt. %, and a scattering-length density (SLD) of 8.78×10⁻⁶ Å-2 for DMF while 49.85×10⁻⁶ Å–2 for CdS nanoparticles
of a density of 6.63 g/cm3. The density for CdS is estimated from the X-ray diffraction data for the CdS powder.
The size distribution of CdS is calculated from the UV-Vis spectrum of CdS in DMF in Figure 1-4-2(a). Moreover, the CdS size obtained from the X-ray diffraction in Figure 1-4-2(b) is the crystal size, which is the smallest and corresponds to the fact that we have poly-crystal CdS. Figure 1-4-2(a) shows UV-vis absorption and photoluminescence spectra of the CdS nanoparticles. In the UV-Vis absorption spectrum, a blue shift (68 nm) in the absorption edge (447nm) with respect to the bulk value (515 nm) and the appearance of an exciton shoulder and a blue-shift of the absorption edge indicate that the CdS nanoparticles are quantum-confined.4a,4d From the absorption wavelength, the size of the CdS nanoparticles can be calculated using equation (1).
R e R Eg Eg Egabs ref ε µ π 2 2 2 2 1 1.8 2 • − ≈ ∆ = − h (1)
Here, R is the radius of the particle, µis the reduced mass of the exciton, i.e.,
1 −
µ = *−1 + *−1
e
h m
m , where m*e is the effective mass of the electron, m*h is the effective
absorption spectrum, two CdS sizes (3.4 nm for 2Redge and 2.0 nm for 2Rmax), as listed in Table 1-1, are calculated individually from edge absorption wavelength
edge
λ
andλ
max . Theλ
edge andλ
max correspond to the larger mean particles size and the mode size in a size distribution, respectively. The sizes of CdS in DMF, determined by energy gaps of semiconductors from UV-vis absorption spectra, are consistent with that calculated by small-angle X-ray scattering in an absolute intensity scale in previous studies. The polydispersity of the sample is assessed by calculating the half-width of size distribution (d1/2), 1.4nm, defined asmax 2
/
1 2R 2R
d = edge − (2)
If we assume a Gaussian distribution of particles, d1/2 value can be taken to be
twice of that of the standard deviation (σ2R), and 2Rmax approximate the mean particle diameter (2Rmean). Then, a simplified radius polydispersity index (RPI )
can be defined in equation (3).
(
2 2)
2 +1 = R RmeanRPI σ (3)
As shown in Table 1-1, RPI for the CdS nanoparticles in this case is about 1.12.
The photoluminescence of CdS in DMF, as shown in Figure 1-4-2(a), exhibits a sharp excitonic fluorescence at 478 nm and two broad peaks at 683 nm and 717 nm, which are due to two different states of surface-trapping.4d The fluorescence by surface trapped states, which exhibited by most nanoparticles, results from a
nonradiative decay of the free electrons to the deep-trapped state; it does not indicate a highly agglomeration of CdS nanoparticles. In the present study, the intensity of surface-trapped fluorescence is much stronger than that of the excitonic fluorescence, indicating a poor passivation of the surface state of CdS nanoparticles. This could be caused by the defects of CdS nanocrystals or the surface modification by
mercaptoethanol.4a,4d
Figure 1-4-2(b) shows X-ray diffraction curves of the CdS powders, which have broad peaks (2θ = 20o~40o) associated with their sphalerite structure. In the case of spherical crystallites, the relation between L, the coherence length, and D
(diameter of CdS) is given by L=3/4D. L is calculated from the Debye-Scherrer formula, given by equation (4).
θ λ cos 9 . 0 B L= (4)
where B is the full width at half maximum of the peak, λ is the X-ray wavelength, and θ is the angle of diffraction. The crystal size of CdS determined by this method is 1.33 nm. It should be noted that the CdS size obtained from X-ray diffraction is the crystal size, and represents the smallest size, corresponding to the fact that we have polycrystalline CdS.
Reference
1. Bates, F.S. Washington Science 1991, 251, 898.
2. Herman, D.S.; Kinning, D.J.; Thomas, E.L.; Fetters, L.J. Macromolecules 1987, 20, 2940.
3. Hadjichristidis, N.; Pispas, S.; Floudas, G. “Block CopolymersSynthetic Strategies, Physical Properties, and Applications”
4. a) Henglein, A. Chem. Rev. 1989, 89, 1861. (b) Veinot, J. G. C.; Ginzburg, M.; Pietro, W. J. Chem. Mater. 1997, 9, 2117. (c) Herron, N.; Wang, Y.; Eckert, H. J. Am. Chem. Soc. 1990, 112, 1322. (d) Brus, L. J. Phys. Chem. 1986, 90, 2555. 5. U-Ser Jeng, Ya-Sen Sun, Hsin-Yi Lee, Chia-Hung Hsu, and Keng S. Liang,
Scheme 1-1 Synthesis of surface-modified CdS nanoparticles by mercaptoethanol
and mercaptoacetic acid
Cd
2++S
2-+ HS-CH
2CH
2-OH
S CdS S S S S S S S OH OH OH OH HO HO HO OHCd
2++S
2-+ HS-CH
2CH
2-COOH
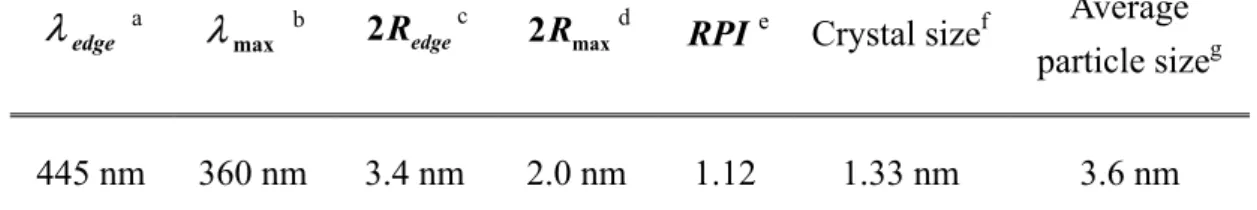
S CdS S S S S S S S COOH COOH COOH COOH HOOC HOOC HOOC COOH Chapter 1: IntroductionTable 1-1: Characteristic properties of CdS nanoparticles edge
λ
a maxλ
b edge R 2 c 2RmaxdRPIe Crystal sizef Average particle sizeg 445 nm 360 nm 3.4 nm 2.0 nm 1.12 1.33 nm 3.6 nm
a The edge absorption wavelength of CdS nanoparticles in DMF as obtained from UV-vis
spectra in Figure 1-4-2(a).
b The absorption wavelength of the mode of CdS nanoparticles. c The larger size of CdS nanoparticles were calculated with
edge
λ by UV-vis spectra using equation (1).4a,4d
d. The mode of the CdS size was calculated from
max
λ .
e
The radius dispersity index (RPI) were determined by equation (3).
f Crystal sizes are calculated using the Debye-Scherrer equation.
Figure Captions
Figure 1-1-1. Schematics of AB diblock and ABA triblock copolymers structures
Figure 1-1-2. Possible phase separated morphologies in PD-PS block copolymer
systems. fA refers to the volume fraction of the A block, which in this case is
polystyrene.
Figure 1-1-3. Typical nanostructures indicating the LAM: lamellar, HCPC:
hexagonally packed cylinders, PC: primitive or simple cubic, BCC: body-centered cubic, FCC: face-centered cubic, HCPS: hexagonally closed packed spheres, DD: double diamond, Ia_3d and Pm_3n (adapted from Burger 2002).
Figure 1-4-1. SAXS data for the DMF solution of 0.035 wt. % CdS nanoparticles,
fitted (dashed curve) using the Schultz size distribution with the mean radius ra and
polydispersity p values shown in the inset. The peak value rp is the most-likely
observed radius in the distribution. (U-Ser Jeng, Ya-Sen Sun, Hsin-Yi Lee, Chia-Hung Hsu, and Keng S. Liang, Siao-Wei Yeh, Kung-Hwa Wei, “The binding effect of surface-modified cadmium sulfide on the microstructure of PS-b-PEO block copolymers”, Macromolecules 2004, 37, 4617.)
Figure 1-4-2. (a) UV-vis absorption and photoluminescence spectra of
mercaptoethanol-modified CdS nanoparticles in N, N-dimethylforamide (DMF). (b) The X-ray diffraction curve of mercaptoethanol -modified CdS nanoparticles.
Figure 1-1-1
Figure 1-1-3
Q
(Å-1) 0.05 0.10 0.15I
(cm
-1)
0.01 0.1 1 0.035% M-CdS in DMF Radius r (Å) 0 10 20 30 40 50 Shultz Distribution 0.00 0.01 0.02 0.03 0.04 ra = 18.4 Å p = 0.5 rp = 9.6 Å 0.01 Figure 1-4-110 20 30 40 50 60
WXRD
CdS powder In ten sit y 2θ Figure 1-4-2 300 350 400 450 500 550 600 650 700 750 λmean= 360 nm λedge = 445 nmCdS in DMF
Photoluminescence UV-vis Absorption wavelength (nm)(a)
(b)
Chapter 1: Introduction2-1 Introduction
Block copolymers are versatile platform materials because they can
self-assemble into various nanostructures with periodic thicknesses on the scale of tens to hundreds of nanometers under the appropriate compositions and conditions, owing to microphase separation between incompatible blocks.1-4 The
crystallization and morphology of one particular type of block copolymer, crystalline-amorphous diblock copolymers, have been studied extensively. For example, morphology and crystallization of asymmetric poly(styrene-b-ethylene oxide) (SEO),5-6 poly(1,4-butadiene)-b-poly(styrene-r-butadiene),
polyethylene-b-poly(vinylcyclohexane),7 and poly(butadiene-b-ethylene oxide)8,9 have been reported.
For semiconductor nanoparticles with sizes close to their Bohr exciton radius (typically between 1-10 nm), the size-dependent band gap results in tunable optical properties.10-11 These semiconductor nanoparticles are termed as quantum dots because their tunable optical properties can be predicted by quantum mechanics. Nanoparticles that are not treated with a surfactant or bonded to polymer chains will, however, from large aggregates.
Recently, the use of nanostructured block copolymers as templates to selectively control the spatial location of semiconductor nanoparticles in one of the blocks may lead to several potential applications. For instance, periodic high refractive index contrast domains in phase-separated block copolymers can be used in photonic crystal applications.12 Moreover, several groups have also reported the in-situ synthesis of Co, Ag, Pb,13 CoFe2O4,14 and CdS15 nanoparticles or the ability to
control the spatial location of nanoparticles such as Au and SiO2,16 Pd,17 , TiO2, and
CdS18 by polystyrene-b-poly(ethylene propylene), polystyrene-b-poly(acrylic acid), polystyrene-b-poly(methylmethacrylate), polystyrene-b-poly(vinylpyridine) and SEO. The incorporation of nanoparticles into block copolymers, however, would lead to more complicated block copolymer morphologies than their pristine state as predicted by Balazs’group,19 which used a self-consistent field theory and a density functional theory for describing the polymer and the nanoparticles, respectively, to predict the morphology and phase diagram. These studies motivated us to
investigate the interaction between the block copolymer and nanoparticles,
particularly on the effect of nanoparticles in the morphology of block copolymers. In this part, we prepare self-assembled CdS/HSEO and CdS/LSEO
nanocomposites in the bulk form and report the selective distribution of CdS nanoparticles in the PEO block of diblock copolymers, HSEO and LSEO, and the resultant morphological changes. Specifically, in the case of HSEO bulk samples, CdS nanoparticles induce the PEO domains to change from hexagonally-packed PEO cylinders to body-centered cubic or simple cubic CdS/PEO spheres, as shown in Scheme 2A-1. To our knowledge, this is the first study concerning the
morphological transformation of block copolymer by nanoparticles. The binding of the nanoparticles leads to spherical PEO/CdS microdomains in the composites with a greatly enhanced thermal stability. In another case of CdS/LSEO, the effect of CdS nanoparticle concentration on the crystallization and morphology of
hexagonally-packed cylindrical LSEO diblock copolymer is shown in Scheme 2B-1 and reported in detail.
2-2 Methods and Analysis
Two kinds of block copolymers, HSEO and LSEO, are involved in the
incorporation of CdS nanoparticles. Synthesis of CdS nanoparticles has been reported previously in the section 1-4. Proper ratios of CdS and SEO (HSEO or LSEO) were mixed in DMF. These mixtures were dried slowly under vacuum at 323 K and then maintained at 383 K for 24 h to obtain the CdS/HSEO and CdS/LSEO nanocomposites. Preparation of pure HSEO and LSEO bulks is similar to that of CdS/SEO except the lack of CdS. Thermal Gravity Analysis had been used to check the presence of the residual DMF solvent, and there was no residual DMF present in these block copolymer nanocomposites.
For morphological studies, small-angle X-ray scattering (SAXS), transmission electron microscopy (TEM) and atomic force microscopy (AFM) were used to determine the morphology of CdS/HSEO and CdS/LSEO bulk samples. SAXS experiments were performed on wiggler beamline BL-17B1 at the National
Synchrotron Radiation Research Center, Taiwan. For TEM and AFM studies, the thin specimens were microtomed with Leica Ultracut Uct equipped with a diamond knife and subsequently deposited on copper grids and silicon wafers. TEM images were obtained with Hitachi H-600 transmission electron microscope operating at 100kV. AFM measurements were performed in taping-mode with a Digital Nanoscope IIIa under ambient conditions. In addition, the crystallization and thermal properties of the nanocomposites were measured by wide-angle X-ray diffraction (WXRD) and differential scanning calorimetry (DSC). WXRD on samples was collected by using a conventional rotating anode source. The glass transition temperatures (Tg) and melting point (Tm) were obtained from a Dupont DSC 2910 at a heating rate of 20 /min. ℃ Fourier transformed Infrared
spectroscopy (FTIR) spectra of the samples were obtained from a spectrometer of model Nicolet PROTÉGÉ-460. Photoluminescence spectra (PL) were obtained with a Hitachi F4500 fluorescence spectrophotometer at room temperature.
2-3 Results and Discussions
The effects of CdS nanoparticles on crystallization and morphological changes of HSEO and LSEO bulk samples are shown and discussed individually in the section 2-3-A for bulk CdS/HSEO and 2-3-B for CdS/LSEO.
2-3-A. CdS-induced morphological transformation of bulk HSEO
Figure 2A-1 shows one-dimension small-angle X-ray scattering patterns (SAXS) of HSEO and CdS/HSEO nanocomposites by synchrotron radiation. For pure HSEO, four peaks appear at Q = 0.016, 0.027, 0.032 and 0.042 Å -1, corresponding to a ratio of 1:31/2:41/2:71/2. This ratio indicates typical scattering by hexagonally-packed cylinders (HEX). The inter-cylinder distance (D) was determined to be 45.3 nm by equation (1).
( )
100 2 / 1 * 3 4 d D= (1) where d100=2π/Q100 and Q100= 0.16 nm-1. In the case of HSEO containing 3.5% CdS,the scattering peaks are located at Q = 0.0114, 0.0158, 0.0203, 0.0228, 0.0281 and 0.0399 Å -1, which gives a ratio of 1: 21/2:31/2:41/2:61/2:121/2. This ratio implies that the scattering is caused by either body-centered cubic packed spheres (BCC) or simple cubic spheres (SC). The inter-sphere distance is 67.5 nm, as determined from equation (2).
( )
110 2 / 1 * 2 3 d D= (2) where d110=2π/Q110 and Q110= 0.114 nm-1. SAXS results confirm that thenanostructured HEX structure of pure HSEO has been transformed to a BCC or SC morphology, due to the presence of CdS Nanoparticles. The size of CdS
Nanoparticles in the block copolymer is about 2.5 nm, as derived from the structure
form of the SAXS curve.
Figure 2A-2(a) and 2A-2(b) show the transmission electron microscopy (TEM) images of HSEO stained with OsO4 and CdS/HSEO without staining, respectively.
PEO domains appear in dark phase in Figure 2A-2(a), owing to selective staining, and display as short cylinders. In the case of CdS/HSEO, however, periodic dark
spherical phases of CdS-included PEO appear, and no pure PEO domains without CdS Nanoparticles could be observed. The location of CdS in the PEO domain is revealed by energy dispersive spectrometry. Dark phases are caused by the higher electron density of cadmium relative to that of HSEO. The selective distribution of mercaptoethanol-modified CdS in the PEO domain is quite possibly due to
dipole-dipole interactions between the hydroxyl groups of mercaptoethanol and the PEO block. The diameter of CdS-included PEO spheres is approximately 23 nm and the inter-sphere distance is about 60 nm, as estimated from their TEM images. In order to cover all PEO domains, there must be some distributions of CdS
Nanoparticles in each PEO domain because the volume fraction of added CdS with respect to the PEO block is about 2.7%, which is not enough to cover each PEO domain fully. It is, however, not possible to detect them with the current techniques.
The results from TEM analysis are consistent with those by SAXS. Further evidence of the two different morphologies can be found in phase-contrast atomic force microscopy images (AFM) of HSEO and CdS/HSEO samples, as shown in Figure 2A-2(c) and 2A-2(d), respectively. A diamond knife used during the
microtoming process causes the oblique lines in these figures. The difference in the images of pure HSEO by TEM and AFM (Fig. 2A-2(a) and 2A-2(c)) could be
explained by the fact that the dark PEO domains which appear as inclined short cylinders in bulk can be projected into cylindrical shapes in the transmission electron microscopy study, whereas the topology of the same microtomed slice would shows
hairy spherical images by the tapping mode of AFM.
Figure 2A-3(a) shows the thermal analysis results of HSEO and CdS/HSEO by differential scanning calorimetry. A crystal melting peak at 42.9oC associated with the PEO domain and a glass transition temperature (Tg) at 99 oC attributed to the PS domain appear in the pure HSEO case (the amorphous phase of PEO is rather small and undetectable). In the presence of CdS, the crystal melting peak of PEO depressed and diminished to a small kink, with an apparent Tg of -56.6 oC; The PS domain, however, maintains a Tg of about 99 oC. The difference between the two cases can be explained by a loss of crystallinity in the PEO domain by the
infiltration of CdS nanoparticles into the PEO domain. Moreover, the WXRD results shown in Figure 2A-3(b) and 2A-3(c) also support the corresponding crystal-to-amorphous change of the PEO domain. In the case of pure HSEO, two sharp peaks at 2θ=19.0o and 23.21 o represent the crystallinity peaks of the PEO domain after deconvolution, as shown in Figure 2A-3(b). Figure 2A-3(c) shows the decrease of crystallinity of PEO domain when CdS is incorporated into the PEO domain, indicating the change from crystalline to amorphous PEO. This result is also consistent with those obtained by DSC. The possible scenario for this
phenomenon is due to the relatively small size of CdS to the contour length of PEO block (2.5nm vs. 130nm) and the dipole-dipole interaction between the angling hydroxy group of surface-attached mercaptoethanol on CdS and ethylene oxide in PEO domain, CdS are tethering to PEO chain and appears to destroy the crystallinity of PEO domain, as shown in Scheme 1. This enables CdS-infiltrated PEO domains to be amorphous and to minimize their surface energy by forming either BCC or SC structures.
When only the volume fraction of the block copolymer HSEO is considered, it is true that in the equilibrium state the pure HSEO should be in the spherical region with
body-center cubic packing due to strong segregation.20 The morphology of
asymmetric amorphous-crystalline block copolymers, however, depends on both the microphase separation of the two blocks and the crystallization kinetics of the crystallizable block as demonstrated in the work by de Jeu et al.21 In their study, lamellar or hexagonally perforated lamellar structures of HSEO were obtained even though the volume fraction of HSEO indicates that it is typically within the
morphological range of sphere or cylinders. In our study, the hexagonally-packed cylindrical morphology of HSEO represents a compromise between the microphase separation involving PS and PEO blocks and the crystallization kinetics of the PEO block.20-21 The cylindrical morphology of pure HSEO is in a meta-stable state due to the fast crystallization of the PEO block. The addition of CdS quantum dots into the diblock copolymer inhibits the crystallization of PEO block. The resultant
morphology of CdS/HSEO sample, therefore, is determined largely by the microphase separation involving PS block and CdS/PEO block, (i.e. the crystallization effect is no longer existing). Theoretically, it is possible to observe the morphological
transformation of pure HSEO, providing two requirements are satisfied-at high temperature (far above Tm of PEO and Tg of PS) and long time (diffusion rate of polymer melt is very small). In reality, this phenomenon may not happen for pure HSEO since block copolymer might start to degrade if it were maintained at high temperature for too long.
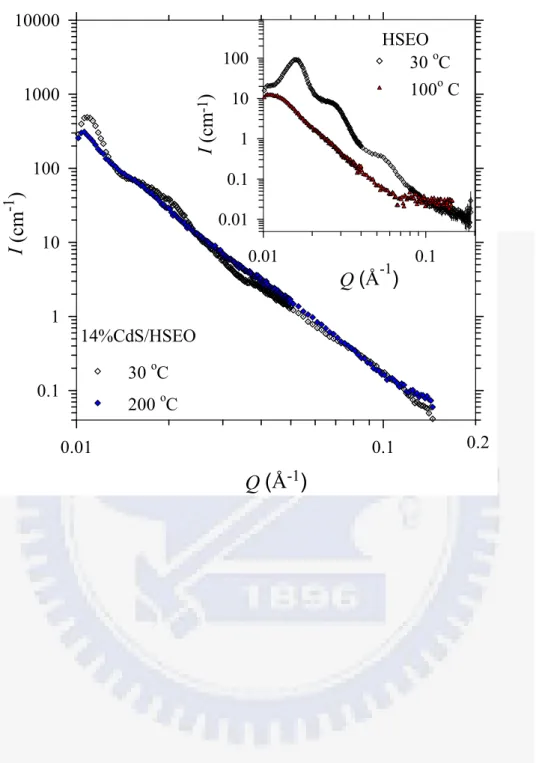
In Figure 2A-4, we show the SAXS result for the 14%CdS/HSEO composite, measured at 200°C – a temperature much higher than the melting and glass transition temperatures of the PEO (~40°C) and PS (100°C) blocks, respectively.25 At 200°C,
the scattering peaks in the lower-Q region diminish largely, indicating the disordering of the PEO/CdS domains in the copolymer matrix. Whereas in the higher-Q region (dominated by the nanoparticles), the SAXS profile persists surprisingly well, both in
shape and intensity, revealing that the PEO/CdS domains are stable during the large temperature transition. Overall, the integrated scattering intensity for the composite film, Qinv =
∫
∞ 0 2 ) (Q Q dQI , remains nearly the same as that at room temperature, strongly suggesting that the degree of phase separation, Qinv/Qinv-ideal, between the
PEO/CdS domains and the PS matrix, is inert to the temperature change. Here
Qinv-ideal = 2π2η(1-η)(∆ρ)2 is the integrated scattering intensity for an ideal two-phase
system of sharp boundary, in our case, PEO/CdS domains in PS matrix. Despite the loss of the mesomorphic order at 200°C, the SAXS result shows that PEO/CdS domains persist, maintaining their individual integrity without disassociating into the PS matrix. This picture is indeed visualized in the corresponding TEM image (Figure 2A-6) taken for the structure frozen at 200°C.
In contrast, the scattering invariant, Qinv, for the pure copolymer, of a PEO crystal
melting temperature ~ 40°C, is very sensitive to temperature changes, and decreases quickly to only 18 % of that at room temperature (inset in Figure 2A-4), even upon a moderate temperature increase to 100°C (~ Tg of the PS block). Using the molecular
weight and the volume fraction of the PS-b-PEO copolymer, we can also calculate a consistent order-disorder transition temperature TODT = 94 °C for the pure copolymer,
basing on the temperature-dependent interaction parameter proposed by Zhu et al.5 and the universal phase diagram by Leibler.23
Photoluminescence spectra of CdS nanoparticles in DMF and the CdS/HSEO nanocomposite film are shown in Figure 2A-5. CdS nanoparticles in DMF emit red light with a maximum intensity located at 650 nm. The peak maximum of CdS in the PEO block of HSEO is red-shifted by 30 nm compared to CdS in DMF. The red-shift in the luminescence of CdS nanoparticles might be caused by aggregation or the different chemical environment.11
In conclusion, semiconductor CdS nanoparticles can be selectively dispersed in the PEO domain of HSEO block copolymer by using a surfactant. The
CdS-infiltrated PEO domains are transformed from originally hexagonally-packed cylindrical structures to BCC or SC structures because CdS inhibits the
crystallization and minimizes the surface energy of CdS-infiltrated PEO phase. The photoluminescence of CdS is slightly affected by their incorporation in HSEO.
2-3-B. CdS-induced structural change of bulk LSEO
Figure 2B-1(a) shows differential scanning calorimetry (DSC) analysis results of CdS/LSEO with various amounts of incorporated CdS nanoparticles. A crystal melting peak (TmPEO) at 58oC, associated with the PEO domain, appears in the pure
LSEO case, while the glass transition temperature (TgPEO) of the amorphous phase
of PEO is undetectable. In the presence of 43% CdS nanoparticles, the crystallinity of the PEO domain reduces to 5 J/g from 55 J/g for the pure PEO domain, and TmPEO decreases to 42oC from 58oC for pure PEO in LSEO. TgPEO is -40oC where
CdS content increases. The crystallinity
X
DSCC can be calculated from DSC
curves by equation (3). ∆ ∆ = 0 1 H H wEO DSC C
X
(3)where ∆H0 refers to the heat of fusion for completely crystallized PEO (∆H0= 200 J/g)22, as shown in Table 2B-1. It indicates that CdS dispersed in PEO domains in LSEO hinders the crystallization of PEO domains. Moreover, the wide-angle X-ray diffraction results also support the corresponding
crystal-to-amorphous change of the PEO domain in LSEO. Figure 2B-1(b) shows the WXRD curves of pure LSEO after deconvolution; two sharp peaks at 2θ =19.0o and 23.21 o represent the crystalline peaks of the PEO domain. The WXRD curves
in Figure 2B-1(c) can be deconvoluted to determine the crystallinity,
X
WAXS C , andresults are given in Table 2B-1.
X
WAXSC can be obtained by equation (4).
+ = a c c EO WAXS C A A A w
X
1 (4)where w is the weight fraction of PEO and EO A and c A are the areas under the a
crystalline and amorphous peaks. The CdS diffraction peak has been deconvoluted and taken out from the PEO crystalline curves. This analysis shows that the
crystallinity of the PEO domain decreases with an increasing amount of CdS, indicating the retardation of PEO crystallization by the CdS nanoparticles. This result is also consistent with those obtained by DSC. The decrease in crystallinity of the PEO domain and the loading of CdS nanoparticles lead to the swelling of
CdS/PEO composite cylinders and an increase in the volume fraction of the CdS/PEO domain in LSEO.
To verify the intermolecular interactions between CdS nanoparticles and PEO block, the vibration spectra of CdS/PSEO in a selected region: C-O-C symmetric and asymmetric stretching (1200-1000 cm-1) were obtained, as shown in Figure 2B-2, and the results were discussed in the following. In the presence of 7% to 43% CdS in PEO domains, the C-O-C stretch vibrations of PEO chains display a shift toward lower wavenumbers, from 1100 cm-1 to 1085 cm-1. The changes in the intensity, sharp, and position of C-O-C stretching mode are associated with the interaction between PEO and surface-hydroxylated CdS nanoparticles, revealing the formation of dipole-dipole interactions between the oxygen atoms of PEO chains and hydroxyl groups on CdS nanoparticles.23
Figure 2B-3 shows one-dimension small-angle X-ray scattering (SAXS) patterns of CdS/LSEO nanocomposites with various CdS content by synchrotron radiation. For pure LSEO, four peaks appear at Q = 0.021, 0.041, 0.053 and 0.078 Å-1,
corresponding to a ratio of 1:41/2:71/2:121/2. This ratio indicates scattering by hexagonally-packed cylindrical (HEX) nanostructures. The inter-cylinder distance (D) was determined to be 35.07 nm using equation (5).
( )
100 2 / 1 * 3 4 d D= (5)where d100=2π/Q100 and Q100= 0.21 nm-1. After incorporating CdS nanoparticles
into the LSEO diblock copolymer, HEX nanostructures in CdS/LSEO still remain, but the ordering peaks of SAXS curves shift to a lower Q region, indicating an enlargement of the center-to-center distance between the PEO composite cylinders. The distance is measured from the center of a cylinder to that of a neighboring cylinder. The enlarged distance is a result of the reduced crystallinity and swollen CdS/PEO composite cylinders. A complete listing of inter-cylinder distances for various CdS/LSEO nanocomposites is given in Table 2B-2. From the SAXS curves, the increasing CdS content in LSEO leads to a reduction in the ordering peaks due to the convolution with CdS nanoparticle scattering contributions. In the case of CdS/LSEO with 43% CdS in the PEO block, the HEX PEO nanostructure is destroyed, which may be explained by the fact that CdS nanoparticles fill up a large fraction of free spacing in the PEO domains and alter the surface energy of the PEO composite domains in LSEO.
Figure 2B-4 shows TEM images of LSEO containing various amounts of CdS nanoparticles. In Figure 2B-4(a), the dark region is the PEO domain, due to staining by OsO4, and the lighter region is the PS domain. The cylindrical
nanostructure of pure LSEO is easily revealed. The diameter of the PEO cylinder is about 14 nm. There is no staining in Figures 2B-4(b)-(f); the darker color represents the PEO/CdS composite phase, because of the higher electron density of cadmium. The location of CdS in the PEO domain was probed by energy
dispersive spectrometry, and no PEO domains without CdS nanoparticles could be observed in LSEO. The selective distribution of mercaptoethanol-modified CdS in the PEO domain is likely due to dipole-dipole interactions between the hydroxyl groups of mercaptoethanol and the PEO block. In Figures 2B-4(b)-(e), the
cylindrical morphology of CdS/LSEO nanocomposites is distorted when the amount of CdS nanoparticles in PEO phase is increased. The cylindrical nanostructure, however, was destroyed in high CdS content CdS/LSEO (43% CdS in PEO) as seen in Figure 2B-4(f), which is consisted with SAXS results.
Figure 2B-5 shows the comparison of photoluminescent properties of CdS in DMF and in PEO domains. After dispersing CdS selectively in the PEO domains of the PSEO block copolymer, the excitonic fluorescence diminishes, and apparent red broad surface-trapped luminescent characteristics largely remain unchanged. Moreover, the main broad surface-trapped fluorescence of CdS nanoparticles in PEO domains displays a slight blue shift to 711 nm from 717 nm when CdS content is low (7-28%), but displays a red shift to 715 nm at 43 % CdS content in PEO. The disappearance of the excitonic fluorescence and the blue shift of the broad
surface-trapped fluorescence can be explained by the fact that the chemical environment of CdS nanoparticles has changed from amide groups (in DMF) to ethylene oxide groups (in PEO blocks). In the case of high CdS concentration (43%) in PEO domains, however, the CdS nanoparticles become agglomerated in the PEO domains and cause the red shift of the surface-trapped fluorescence.
To clarify the agglomeration of CdS nanoparticles in DMF and in the composites, the surfactant removal and its sequence in the process were given more detailed discussions. The surface-hydroxylated CdS nanoparticles were synthesized by bonding the surfactant, mercaptoethanol, to CdS nanoparticles with the thiol group, and then were dispersed and mixed with PSEO in DMF. The CdS/SEO
nanocomposite films were formed after drying under vacuum at 323 K and being maintained at 383 K for 24 h. During drying processes, the solvent, DMF, is removed and, in our opinion, a small ratio of mercaptoethanol may be also carried away from the CdS surface because the strong hydrogen bonding, between DMF and mercaptoethanol, and the lower boiling point of mercaptoethanol than that of DMF (157oC vs. 165oC). The removal of the surfactant from the surface of CdS nanoparticles causes their agglomeration and the broadening and red shift of their photoluminescent peaks. By comparing the photoluminescence of CdS/PSEO composites to that of CdS in DMF, the amount of surfactants that was removed seems to be small during drying processes because no red shift, only a little broadening, is shown in the photoluminescent peaks in Figure 2B-5.
In conclusion, CdS nanoparticles selectively dispersed in a PEO block hinder crystallization of PEO, resulting in an increase in the inter-cylinder distance of the HEX CdS/LSEO, as shown in Scheme 2B-1. High CdS nanoparticle concentration, however, destroys the ordered HEX nanostructure of LSEO. Furthermore, the comparison of photoluminescence of CdS in DMF and in PEO domains of PSEO block copolymers has been discussed in detail.
2-4 Conclusions
Surface-modified CdS nanoparticles selectively dispersed in a PEO block hinder crystallization of PEO and maintain their original optical properties in both cases of CdS/HSEO and LSEO bulk samples. Moreover, the CdS-infiltrated PEO domains, in the case of CdS/HSEO, are transformed from originally hexagonally-packed cylindrical structures to BCC or SC structures because of the inhibition of the
crystallization in PEO and minimization of the surface energy of CdS/PEO domains. In the case of CdS/LSEO, however, segregation of CdS nanoparticles results in an
increase in the inter-cylinder distance of the HEX CdS/LSEO, but the ordered nanostructure of LSEO is destroyed by high CdS content.
Acknowledgment
We appreciate Drs Sun, Y. S.; Jeng, U. S.; Liang, K. S. in National Synchrotron Radiation Research Center discussions and experimental support, and the financial support of the National Science Council through project NSC 92-2120-M-009-009.
References
1. (a) Bates, F. S.; Fredrickson, G. H. Annu. Rev. Phys. Chem. 1990, 41, 525. (b) Bates, F. S. Science 1991, 251, 898.
2. Hamley, I. W. The Physics of the Block Copolymers, Oxford University Press: New York, 1998.
3. Lazzari, M.; Lopez-Quintela, M. A. Adv. Mater. 2003, 15, 1583. 4. Park, C.; Yoo, J.; Thomas E. L. Polymer 2003, 44, 6725.
5. (a) Zhu, L.; Huang, P.; Chen, W. Y.; Weng, X.; Cheng, S. Z. D.; Ge, Q.; Quirk, R. P.; Senador, T.; Shaw, M. T.; Thomas, E. L.; Lotz, B.; Hsiao, B. S.; Yeh, F; Liu, L. Macromolecules 2003, 36, 3180. (b) Zhu, L.; Cheng, S. Z. D.; Huang, P.; Ge, Q.; Quirk, R. P.; Thomas, E. L.; Lotz, B.; Hsiao, B. S.; Yeh, F; Liu, L. Polymer 2001, 42, 5829.
6. Li, L.; Serero,Y.; Koch, M. H. J.; de Jeu, W. H. Macromolecules 2003, 36, 529. 7. (a) Loo, Y. L.; Register, R. A.; Ryan A. J. Macromolecules 2002, 35, 2365. (b)
Loo, Y. L.; Register, R. A.; Ryan A. J.; Dee, G. T. Macromolecules 2001, 34, 8968.
8. (a) Rottele, A.; Thurn-Albrecht, T.; Sommer, J. U.; Reiter, G. Macromolecules 2003, 36, 1257. (b) Reiter, G.; Castelein, G.; Sommer, J. U.; Rottele, A.;
Thurn-Albrecht, T. Phys. Rev. Lett. 2001, 87, 226101.
9. Chen, H. L.; Hsiao, S. C.; Lin, T. L.; Yamauchi, K.; Hasegawa, H.; Hashimoto, T. Macromolecules 2001, 34, 671.
10. (a) Veinot, J. G. C.; Ginzburg, M.; Pietro, W. J.; Chem. Mater. 1997, 9, 2117. (b)
Herron, N.; Wang, Y.; Eckert, H.; J. Am. Chem. Soc. 1990, 112, 1322.
11. (a) Gao, M. Y.; Richter, B.; Kirstein, S.; Adv. Mater. 1997, 9, 802. (b) Gao, M. Y.;
Richter, B.; Kirstein, S.; Mohwald, H.; J. Phys. Chem. B 1998, 102, 4096.
12. Urbas, A. M., Maldovan, M.; DeRege, P.; Thomas, E. L.; Adv. Mater. 2002, 14,
1850.
13. (a) Abes, J. J.; Cohen, R. E.; Ross, C. A. Chemistry of Materials 2003, 15, 1125. (b) Boontongkong, Y.; Cohen, R. E. Macromolecules 2002, 35, 3647.
14. (a) Ahmed, S. R.; Kofinas, P. Macromolecules 2002, 35, 3338. (b) Ahmed, S. R.; Ogale, S. B.; Papaefthymiou, G. C.; Ramesh, R.; Kofinas, P. Appl. Phys. Lett. 2002, 80, 1616.
15. (a) Moffitt, M.; Vali, H.; Eisenberg, A. Chemistry of Materials 1998, 10, 1021. (b) Moffitt, M.; McMahon, L.; Pessel, V.; Eisenberg, A. Chemistry of Materials 1995, 7, 1185.
16. Bockstaller, M. R.; Lapetnikov, Y.; Margel, S.; Thomas E. L. J. Am. Chem. Soc. 2003, 125, 5276.
17. (a) Ribbe, A. E.; Okumura, A.; Matsushige, K.; Hashimoto, T. Macromolecules 2001, 34, 8239. (b) Hashimoto, T.; Harada, M.; Sakamoto, N. Macromolecules 1999, 32, 6867.
18. (a) Weng, C. C.; Wei, K. H. Chemistry of Materials 2003, 15, 2936. (b) Yeh, S. W.; Wei, K. H.; Sun, Y. S.; Jeng, U. S.; Liang, K. S. Macromolecules 2003, 36, 7903.
2001, 292, 2469. (b) Thompson, R. B.; Ginzburg, V. V.; Matsen, M. W.; Balazs, A. C. Macromolecules 2002, 35, 1060. (c) Lee, J. Y.; Shou, Z.; Balazs, A. C. Phys. Rev. Lett. 2003, 91, 136103.
20. Hamley, I. W. The Physics of the Block Copolymers, Oxford University Press: New York, 1998.
21. Li, L.; SereroY.; Koch, Michel H. J.; de Jeu, Wim H. Macromolecules 2003, 36,
529.
22. Floudas, G.; Tsitsilianis, C. Macromolecules 1997, 30, 4381.
23. Qiao, J.; Yoshimoto, N.; Ishikawa, M.; Morita, M. Chemistry of Materials 2003, 15, 2005.
24. Leiber, L. Macromolecules 1980, 13, 1602.
25. U. S. Jeng, Y. S. Sun, H. Y. Lee, C. H. Hsu, and K. S. Liang, S. W. Yeh, K. H. Wei, Macromolecules 2004, 37, 4617.
Scheme 2A-1 Morphological transformation of HSEO diblock copolymer by
selectively dispersed colloidal CdS nanoparticles.
CdS PEO PS PS PEO PS Cd2+ +S2- + HS-CH 2CH2-OH S Cds S S S S S S S OH OH OH OH HO HO HO OH
Figure Captions:
Figure 2A-1 Synchrotron SAXS curves of HSEO and CdS/HSEO.
Figure 2A-2 (a) TEM image of HSEO stained by OsO4. The dark regions
correspond to PEO phases stained with OsO4. (b) TEM image of CdS/HSEO
without staining. (c) AFM images of thin films microtomed from bulk HSEO and (d) AFM images of thin films microtomed from bulk CdS/HSEO.
Figure 2A-3 (a) DSC analysis of CdS/HSEO and HSEO. The samples were heated from -90oC to 130oC at 10oC/min. (b) Deconvolution curves of the WXRD curve of crystallinity HSEO. (c) WXRD of HSEO and CdS/HSEO after crystallization at -20oC for 18 hr.
Figure 2A-4 Comparison of SAXS profiles for the 14%CdS/HSEO composite measured at 30 °C and 200 °C, respectively. The inset shows SAXS data measured for the pure HSEO copolymer at 30 °C and 100 °C. Note that at 100°C, the profile of the pure copolymer is structureless after Q ~ 0.06 Å-1.
Figure 2A-5 Photoluminescence of CdS and CdS/HSEO after excitation with 430-nm light.
Figure 2A-6 TEM images for the 14%CdS/HSEO composite at 200°C. The dark spherical regions are the PEO/ CdS domains. The bar represents a unit length of 100 nm for the image.
Figure 2A-1
14%CdS/HSEO 3.5%CdS/HSEO Pure HSEO
100 nm (b) 100 nm (a) (c) (d) Figure 2A-2
Figure 2A-3 (b) (c) -80 -60 -40 -20 0 20 40 60 80 100 120 TmPEO=42.8 o C TgPS= 97 o C 3.5% CdS/HSEO End other mal Temperature (oC) TgPS= 99 o C 14% CdS/HSEO pure HSEO TmPEO=42.9o C TgPS= 100 o C TgPEO= -56.6oC DSC (a) HSEO 3.5%CdS/HSEO 14%CdS/HSEO HSEO
Figure 2A-4
Q (Å
-1)
0.01 0.1I
(cm
-1)
0.1 1 10 100 1000 10000 30 oC 200 oC 0.2 Q (Å-1) 0.01 0.1 I (cm -1) 0.01 0.1 1 10 100 100o C PS-b-PEO M-CdS(4) 30 oC 14%CdS/HSEO HSEO500 550 600 650 700 750 800 0 50 100 150 200 250 300 350 400 450
PL
CdS/HSEO CdS in DMF In tens ity wavelength (nm) Figure 2A-5Figure 2A-6
100nm
Scheme 2B-1 Crystalline and morphological properties of CdS/LSEO with various
CdS content
without CdS low high
LSEO CdS/LSEO
CdS content
PS PEO PS PS PEO PS PS PS PEO PS PS PEO
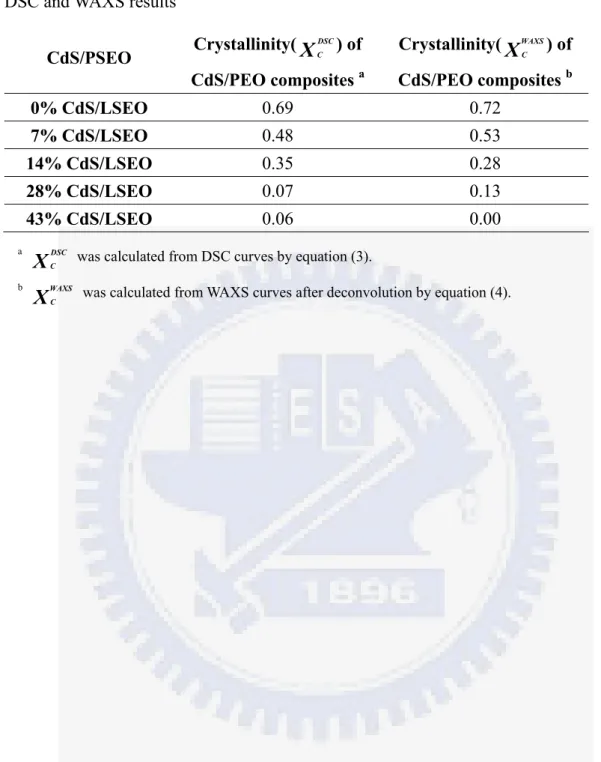
Table 2B-1 Crystallinity of CdS/PEO composites with various CdS content from
DSC and WAXS results
CdS/PSEO Crystallinity(
X
DSC C ) of CdS/PEO composites a Crystallinity(X
WAXS C ) of CdS/PEO composites b 0% CdS/LSEO 0.69 0.72 7% CdS/LSEO 0.48 0.53 14% CdS/LSEO 0.35 0.28 28% CdS/LSEO 0.07 0.13 43% CdS/LSEO 0.06 0.00 aX
DSCC was calculated from DSC curves by equation (3).
b
X
WAXSC was calculated from WAXS curves after deconvolution by equation (4).
Figure Captions
Figure 2B-1: (a) DSC, (b) and (c) X-ray diffraction curves of CdS/LSEO with various CdS nanoparticle content.
Figure 2B-2: FTIR spectra of the CdS/PSEO in a selected region: C-O-C symmetric and asymmetric stretching (1200-1000 cm-1).
Figure 2B-3: Small-angle X-ray scattering of CdS/LSEO nanocomposites with various CdS nanoparticle content.
Figure 2B-4: TEM images of (a) LSEO stained with OsO4, (b) 7% CdS/LSEO, (c)
14% CdS/LSEO, (d) 28% CdS/LSEO, and (e) 43%/LSEO. Figure 2B-5: Photoluminescence spectra of CdS nanoparticle in DMF and