國立交通大學
生物資訊及系統生物研究所
博士論文
利用次世代定序技術系統化分析微小非編碼核醣核酸
Systematic analysis of small non-coding RNA using
next-generation sequencing technology
研究生 : 王威霽
指導教授: 黃憲達 教授
利用次世代定序技術系統化分析微小非編碼核醣核酸
Systematic analysis of small non-coding RNA using next-
generation sequencing technology
研究生 : 王威霽
Student : Wei-Chi Wang
指導教授: 黃憲達
Advisor : Hsien-Da Huang
國立交通大學
生物資訊及系統生物研究所
博士論文
A Thesis
Submitted to Institute of Bioinformatics and Systems Biology College of Biological Science and Technology
National Chiao Tung University for the doctoral degree
in bioinformatics and systems biology
August 2011
Hsinchu, Taiwan, Republic of China
i
利用次世代定序技術系統化分析微小非編碼核醣核酸
學生
:王威霽 指導教授:黃憲達 博士
國立交通大學
生物資訊及系統生物研究所博士班
摘要
次世代定序技術(NGS)是一個新的定序技術,它是一個能夠快速、大
量以及穩定偵測和分析微小非編碼核醣核酸(small non-coding RNA)
的表現量的方法。微小非編碼核醣核酸在生物體內主要影響到基因沉
默(gene silencing)、DNA 甲基化、組蛋白修飾。為了研究微小非編
碼核醣核酸的功能,微陣列(microarray)被廣泛的使用。隨著次世代
定序的發展,近年來越來越多生物學家利用次世代定序技術來研究微
小非編碼核醣核酸的功能。次世代定序比微陣列在分析微小非編碼核
醣核酸上更為準確且能發現未知的微小非編碼核醣核酸。次世代定序
技術提供生物學家更好的資料品質,但是到目前為止,如何廣泛且完
整的分析微小非編碼核醣核酸還未被提出。這個研究的主要目標就是
針對次世代定序技術在微小非編碼核醣核酸建立廣泛且完整的分析
流程,希望這個系統化的分析流程能夠幫助生物學家快速的分析資
以及獲得更多有用的結果。
ii
Systematic analysis of small non-coding RNA using
next-generation sequencing technology
Student : Wei-Chi Wang
Advisor : Hsien-Da Huang
Abstract
Next-generation sequencing (NGS) technology which is a novel sequencing technology offers high-throughput and robust approaches for monitoring and analyzing the expression of small non-coding RNAs. Small non-coding RNAs contain microRNAs (miRNAs) and short interfering RNAs (siRNAs) which play an important role in gene silencing, DNA methylation and heterochromatic histone modifications in animals and plants by targeting mRNAs. Unlike capillary-based sequencing, next-generation sequencing technology produces million of sequences (35~1000 nt) at a time. This offers the quantitative analysis in the small non-coding RNA. Moreover, comparing oligonucleotide microarray, it can be used to not only profile the expression levels of known miRNAs but also discovery novel miRNAs. In the recent years, there are more and more studies applying this sequencing technology to deciphering the function of small non-coding RNAs. However, there are no complete and comprehensive analysis flows for these sequencing data.
This work aims at developing the systematic and comprehensive analysis pipeline in small non-coding RNA including animals and plants for next-generation sequencing data. This pipeline can help biologists to easily apply their own NGS data to finding the biological significant small non-coding RNAs, pathways and regulation networks between small non-coding RNAs and their target genes.
iii
致謝
關於這個研究首先要感謝中研院植物暨生物學研究所林納生博士於 2008 年提供 第一份 NGS data 開啟我投入這個研究。在當時台灣很少有 NGS data 或是相關研 究,透過和實驗室林豐茂學長合作研究了解如何處理 NGS data,接著發表第一 篇論文。透過處理 NGS data 以及我們 lab 研究 miRNA 的專長,陸續和 UCR 的史 允中以及 Hailing Jin 教授合作分析 NGS small non-coding RNA data 在動物和 植物上,都有不錯的成果。
關 於 miRNA 的 一 些 相 關 知 識 要 特 別 感 謝 勝 達 常 常 給 我 在 miRNA target prediction 上的建議,Alan 在 miRNA TSS 方面的 support,熙淵學長在 promoter analysis 的建議和指導。還有博凱常常在我需要一些資料時給予我協助。除此 之外,還要感謝實驗室的學弟妹在一些瑣碎的事上幫忙。
當然最感謝的是我的指導教授黃憲達博士對我從碩士班到博士班的包容以及指 導,最後感謝我的父母以及哥哥姐姐對我的支持和幫忙,讓我能安心完成學業。
iv
Table of contents
摘要 ... i Abstract ... ii 致謝 ... iii Table of contents ... ivList of Figures ... vii
List of Tables ... ix
1. Introduction ... 1
Motivation and Specific Aims ... 1
2. Background ... 4
2.1 Next-generation sequencing technology ... 4
Roche 454 ... 4
Illumia Genome Analyzer... 5
ABI SOLiD ... 6
Helicos’ tSMS ... 6
Pacific Biosciences ... 7
Comparison of next-generation sequencing technologies ... 7
2.2 The biogenesis of microRNAs in animals ... 9
2.3 MicroRNAs and siRNAs in plants ... 12
The biogenesis of miRNAs in plants ... 12
The biogenesis of tasiRNAs ... 13
The biogenesis of nat-siRNAs ... 14
The biogenesis of hc-siRNAs ... 15
2.4 Regulation role of small RNA... 17
The regulation role of miRNA in animals ... 17
The regulation role of small RNAs in plants ... 18
2.5 Application of NGS in small RNA ... 21
3. Related works ... 22
3.1 The repositories of miRNAs ... 22
miRBase ... 22
3.2 miRNA target site prediction tools ... 22
TargetScan/TargetScans ... 22
miRanda ... 23
PicTar ... 23
PITA ... 24
v
3.3 Tool and web servers for analyzing NGS small RNA sequencing data ... 25
miRDeep ... 25 deepBase ... 25 Geoseq ... 26 miRanalyzer ... 26 SeqBuster ... 27 mirTools ... 27 DSAP ... 28 miRExpress ... 28 miRNAkey ... 29
3.4 miRNA target interaction databases and tools ... 30
MAGIA ... 30 miRGator ... 30 TarBase ... 31 miRecords ... 31 miR2Disease ... 32 miRTarBase ... 32 starBase ... 32
3.5 Transcriptional regulation related database and tools ... 34
miRStart ... 34
TRANSFAC ... 35
JASPAR ... 35
MATCH ... 36
3.6 Other related resources... 37
Gene Ontology ... 37
KEGG ... 37
Vienna RNA Package ... 38
Rfam ... 38
RNALogo ... 39
4. Materials and Methods ... 40
4.1 The system flow of profiling small RNA expression ... 40
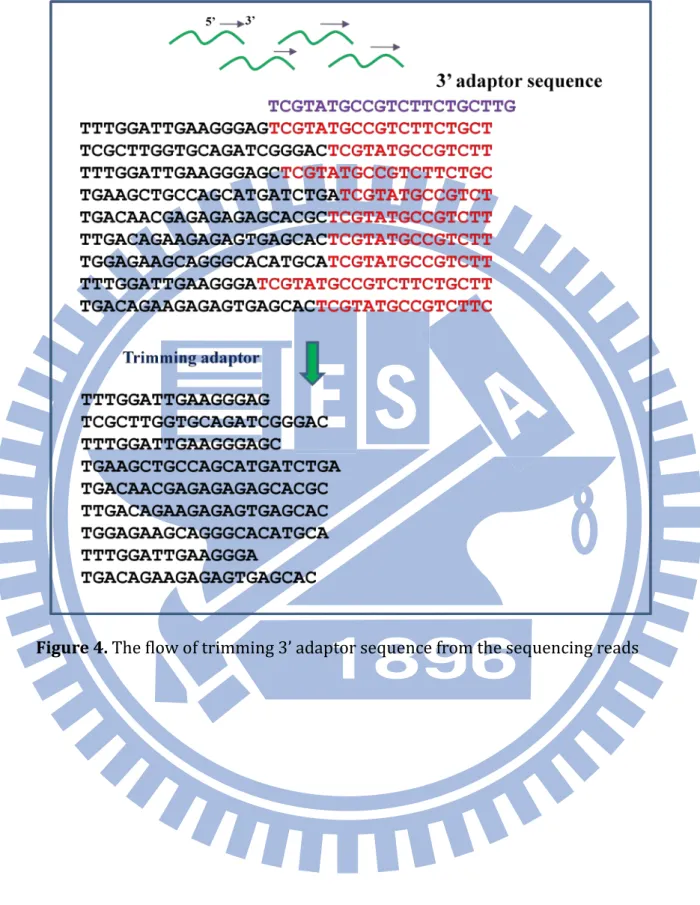
Trimming adaptor sequence from sequencing reads ... 40
Aligning trimmed reads with the reference genomes or small RNA database ... 42
Calculating the expression level of various kinds small RNA ... 42
Normalizing the expression of small RNA and finding differential expressed small RNAs45 4.2 Novel miRNAs discovery ... 46
4.3 miRNA and siRNA target genes prediction ... 51
vi
4.6 Regulation role of miRNA analysis ... 55
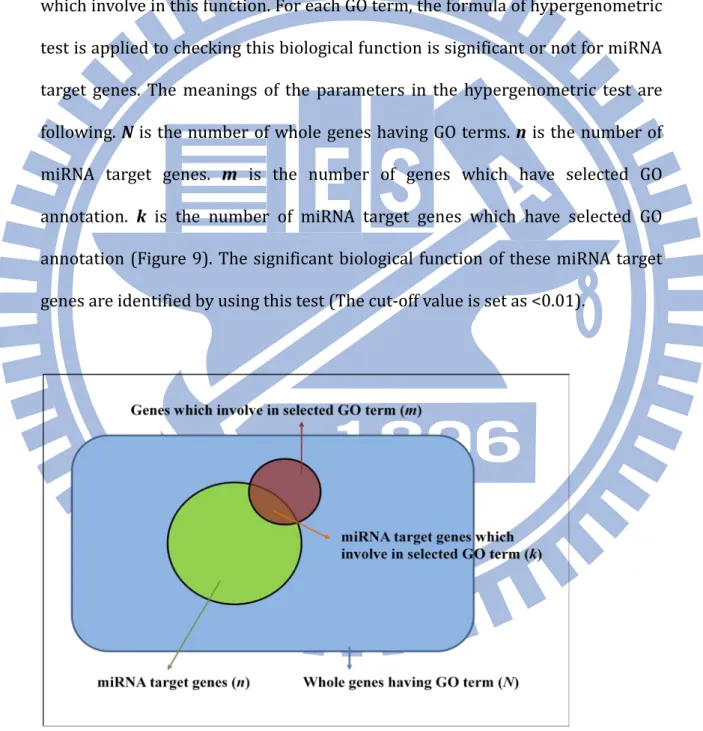
Gene ontology enrichment analysis ... 56
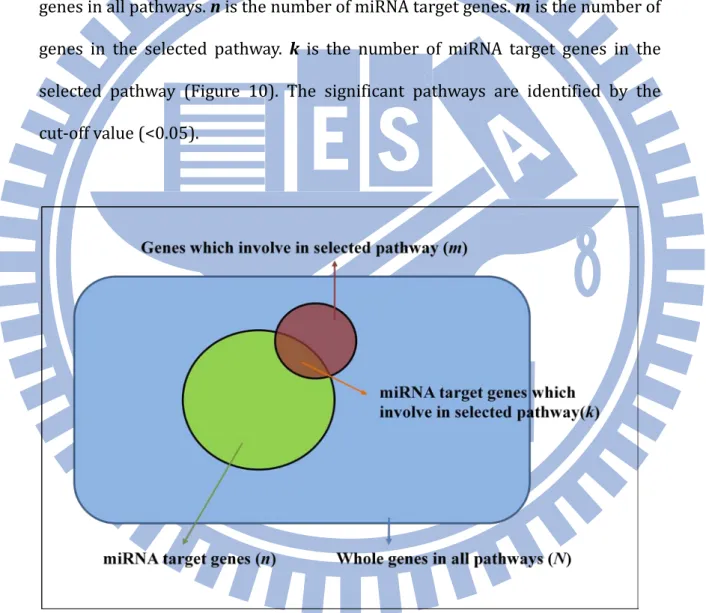
Pathway enrichment analysis ... 57
5. Results ... 59 Case Study 1 ... 59 Case Study 2 ... 69 Case Study 3 ... 74 Case Study 4 ... 80 6. Discussions ... 85
6.1 Increasing the correctness of profiling NGS data ... 86
6.2 Improving completeness of regulation role of small non-coding RNAs by adding other kind NGS data ... 89
References ... 92
vii
List of Figures
FIGURE 1. THE DISTRIBUTION OF NON-CODING SMALL RNA STUDIES BY NGS.DATA COLLECTION UNTIL
2011.03... 3
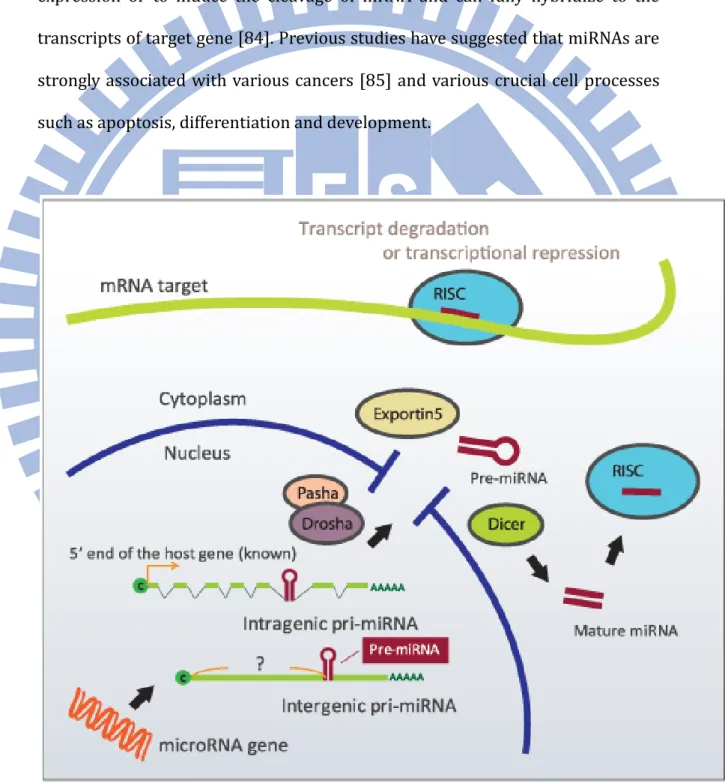
FIGURE 2.THE BIOGENESIS OF MIRNAS ... 9
FIGURE 3. MIRNA FUNCTION:(A) MRNA DEGRADATION, COMMON IN PLANTS,(B)TRANSLATION REPRESSION, COMMON IN ANIMALS,(C)TRANSCRIPTION REPRESSION BY HISTONE OR DNA METHYLATION, COMMON IN YEASTS, PLANTS, AND POSSIBLY ANIMALS ... 11
FIGURE 4. THE FLOW OF TRIMMING 3’ ADAPTOR SEQUENCE FROM THE SEQUENCING READS ... 41
FIGURE 5. HOW TO MONITOR THE EXPRESSION LEVEL OF THE MIRNA IN SEQUENCING DATA ... 43
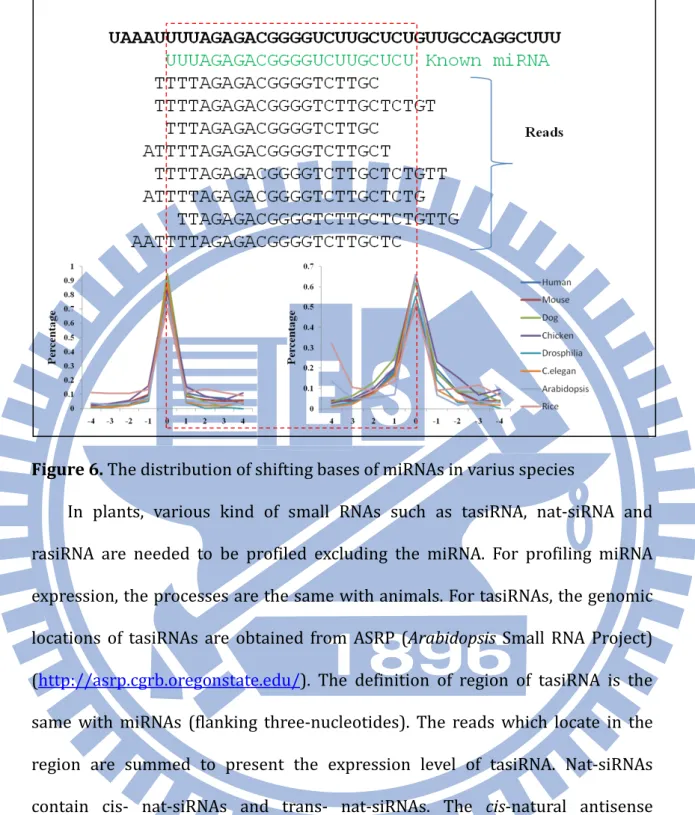
FIGURE 6.THE DISTRIBUTION OF SHIFTING BASES OF MIRNAS IN VARIUS SPECIES ... 44
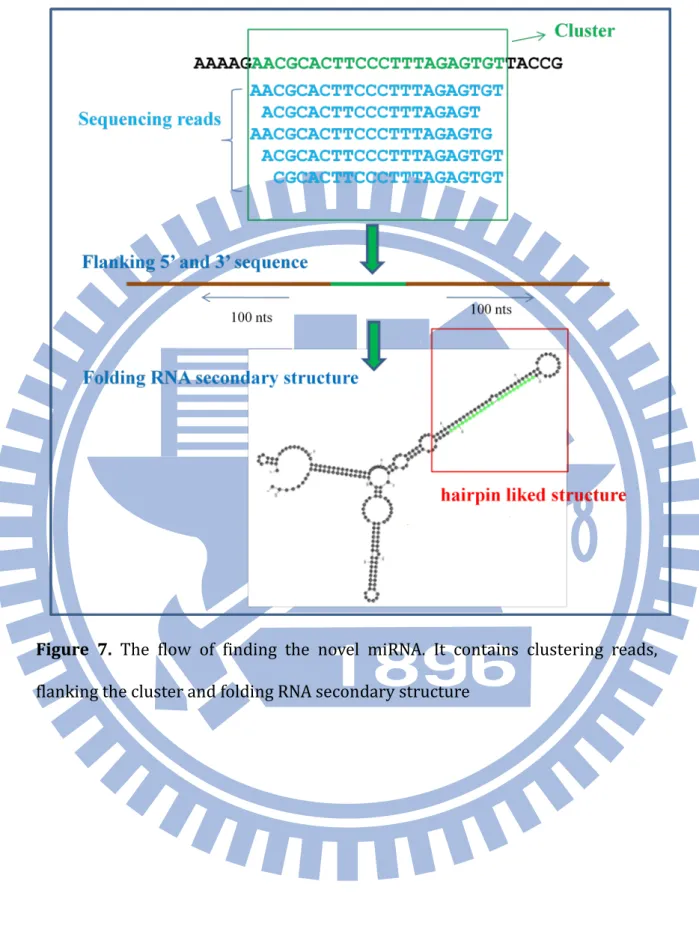
FIGURE 7.THE FLOW OF FINDING THE NOVEL MIRNA.IT CONTAINS CLUSTERING READS, FLANKING THE CLUSTER AND FOLDING RNA SECONDARY STRUCTURE ... 50
FIGURE 8. THE FLOW OF IDENTIFYING TFBS IN THE PROMOTER REGION OF MIRNAS.THE SEQUENCE LOGOS OF BINDING PROFILE OF TFS ARE CONSTRUCTED BY WEBLOGO ... 54
FIGURE 9. THE INTERSECTION OF HYPERGEOMTERIC TEST IN GENE ONTOLOGY ENRICHMENT ANALYSIS 56 FIGURE 10. THE INTERSECTION OF HYPERGEOMTERIC TEST IN PATHWAY ENRICHMENT ANALYSIS ... 57
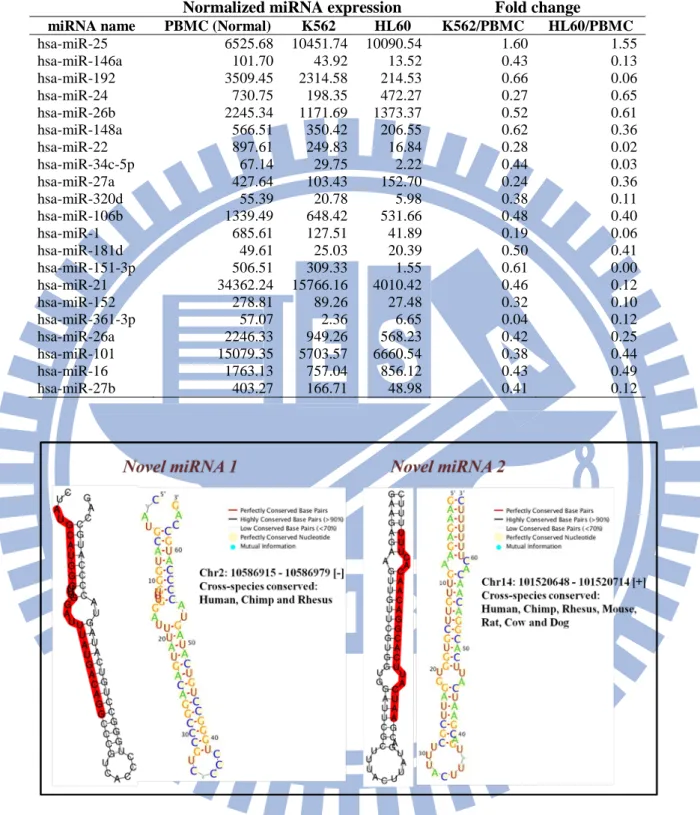
FIGURE 11.THE SECONDARY STRUCTURE AND CROSS-SPECIES CONSERVATION OF NOVEL MIRNA1 AND 2 (CASE STUDY 1) ... 60
FIGURE 12.THE SECONDARY STRUCTURE AND CROSS-SPECIES CONSERVATION OF NOVEL MIRNA3 AND 4 (CASE STUDY 1) ... 61
FIGURE 13.THE SECONDARY STRUCTURE AND CROSS-SPECIES CONSERVATION OF NOVEL MIRNA5 AND 6 (CASE STUDY 1) ... 61
FIGURE 14.THE SECONDARY STRUCTURE AND CROSS-SPECIES CONSERVATION OF NOVEL MIRNA7 AND 8 (CASE STUDY 1) ... 62
FIGURE 15.THE SECONDARY STRUCTURE AND CROSS-SPECIES CONSERVATION OF NOVEL MIRNA9 AND 10(CASE STUDY 1) ... 62
FIGURE 16.THE SECONDARY STRUCTURE AND CROSS-SPECIES CONSERVATION OF NOVEL MIRNA11 AND 12(CASE STUDY 1) ... 63
FIGURE 17.THE SECONDARY STRUCTURE AND CROSS-SPECIES CONSERVATION OF NOVEL MIRNA13 AND 14(CASE STUDY 1) ... 63
FIGURE 18.THE SECONDARY STRUCTURE AND CROSS-SPECIES CONSERVATION OF NOVEL MIRNA15 AND 16(CASE STUDY 1) ... 64
FIGURE 19. MIRNA TARGET GENES INVOLVE IN CELL CYCLE ... 68
FIGURE 20.THE SECONDARY STRUCTURE AND CROSS-SPECIES CONSERVATION OF NOVEL MIRNA1 AND 2 (CASE STUDY 2) ... 71
viii
(CASE STUDY 2) ... 71
FIGURE 22.HIFIA BINDING SITES IN THE PROMOTER REGIONS OF LET-7 FAMILY AND MIR-103/107 ... 72
FIGURE 23. THE TARGET SITES OF HSA-LET-7 FAMILY AND HSA-MIR-103/107 IN THE 3’UTR OF AGO1. THESE TARGET SITES ARE CONSERVED IN 15 SPECIES (RED PART IS SEED REGION). ... 72
FIGURE 24.THE MODEL OF TRANSLATIONAL SUPPRESSION UNDER NORMOXIA AND DE-SUPPRESSION UNDER HYPOXIA ... 73
FIGURE 25.THE MRNA EXPRESSION LEVEL OF AGO2 IN MOCK, VIRULENT PST (EV) AND AVIRULENT PST
(AVRRPT2) ... 75
FIGURE 26.THE PROTEIN LEVEL OF MEMB12 WITH MIR393B*(MEMB12-WT AND MU) ... 78
FIGURE 27. MIRNA* AND MIRNA PAIR, EACH OF WHICH TARGETS DIFFERENT REGULATORS WITHIN THE SAME CELLULAR PROCESS – IMMUNITY THROUGH TWO DISTINCT RNAI EFFECTORS. ... 79
FIGURE 28.LENGTH DISTRIBUTION OF SIRNAS DERIVED FROM BAMV OR SATBAMV IN A. THALIANA .. 81
FIGURE 29.LENGTH DISTRIBUTION OF SIRNAS DERIVED FROM BAMV OR SATBAMV IN N. BENTHAMIANA
... 82
FIGURE 30.THE LENGTH DISTRIBUTION OF TOTAL SIRNAS FROM N. BENTHAMIANA ... 83
FIGURE 31.THE SIRNA DISTRIBUTIONS IN 5’UTR OF SATBAMV IN A. THALIANA. AND N. BENTHAMIANA
(A.BSF4,B.BSL6). ... 84
ix
List of Tables
TABLE 1. NON-CODING SMALL RNA STUDIES USING NEXT-GENERATION SEQUENCING TECHNOLOGY... 3
TABLE 2. THE PERFORMANCE COMPARISON OF NEXT-GENERATION SEQUENCING TECHNOLOGIES ... 8
TABLE 3.THE NUMBER OF MIRNA AND READS AND GEO ACCESSION IDS FOR ANALYZING THE SHIFTING BASES OF MIRNA IN VARIOUS SPECIES ... 43
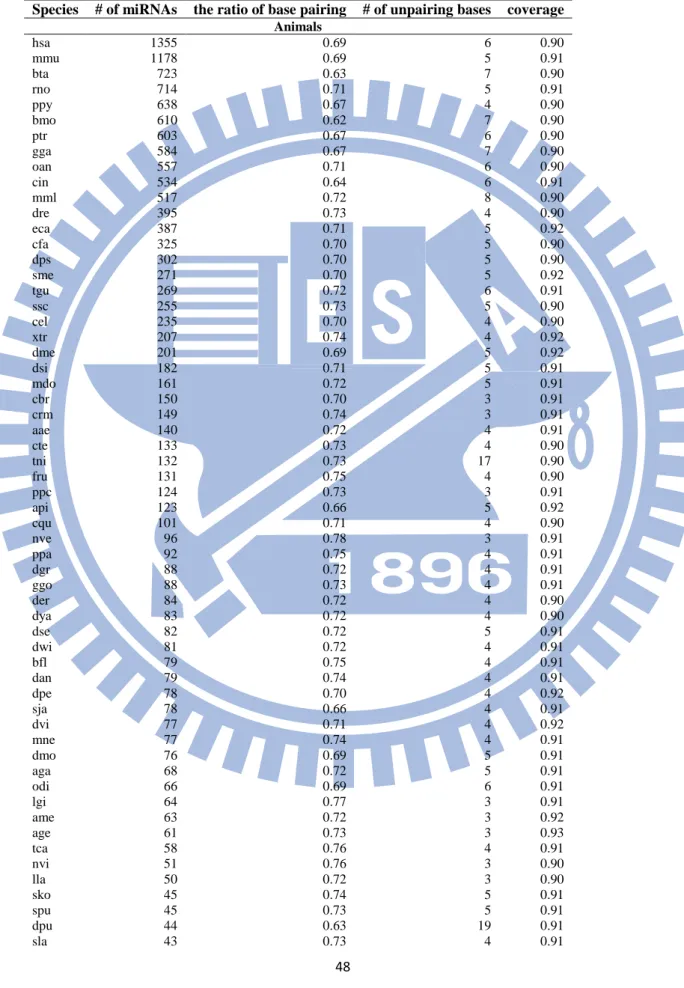
TABLE 4.THE THRESHOLDS OF MIRNAS AND CORRESPONDING COVERAGE RATES FOR EACH ORGANISM ... 48
TABLE 5.THE LISTS OF DIFFERENTIALLY EXPRESSED MIRNAS IN TWO CANCER CELL LINES ... 60
TABLE 6.THE PREDICTED LISTS OF TRANSCRIPTION FACTOR WHICH REGULATE MIRNAS ... 65
TABLE 7.THE FUNCTION OF MIRNA TARGET GENES BY GO ENRICHMENT ANALYSIS ... 66
TABLE 8.THE PATHWAY LISTS OF MIRNA TARGET GENES BY PATHWAY ENRICHMENT ANALYSIS ... 68
TABLE 9.THE LISTS OF DIFFERENTIALLY EXPRESSED MIRNAS IN HYPOXIA HUVECS ... 70
TABLE 10.THE LISTS OF DIFFERENTIALLY EXPRESSED MIRNAS (COMPARING AGO1- AND AGO2-IP) ... 76
TABLE 11. THE PREDICTED TARGET GENES OF SELECTED MIRNA* ... 77
TABLE 12.THE AMOUNT OF SMALL RNAS IN 7 LIBRARIES IN N. BENTHAMIANA ... 81
1
1. Introduction
Motivation and Specific Aims
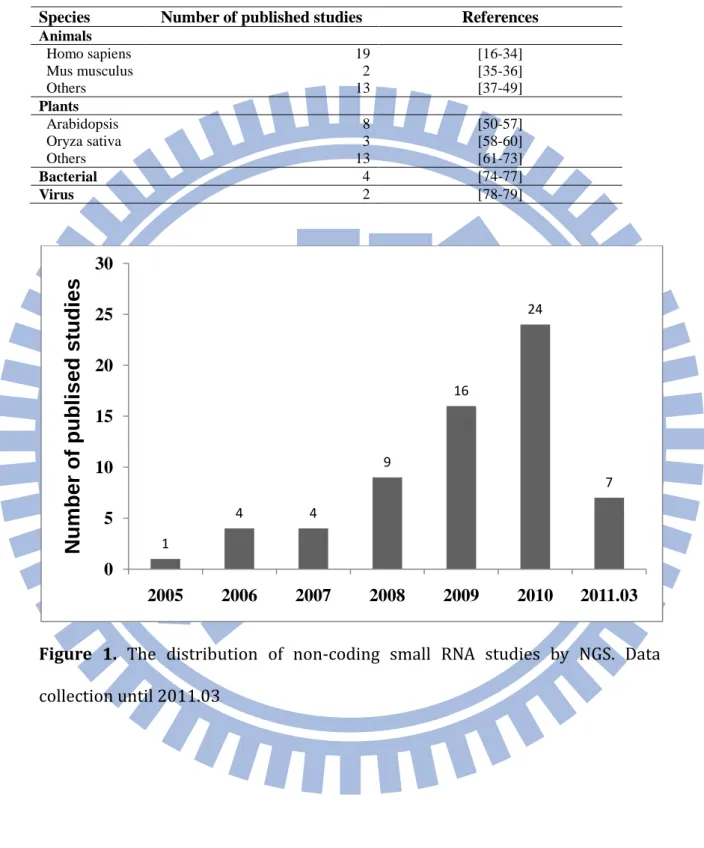
Non-coding small RNAs like microRNAs (miRNAs) and short-interfering RNAs (siRNAs) play an important role in gene regulation by mRNA degradation, translation repression and transcriptional gene silencing in animals and plants. To investigate the function of small RNAs, the method for high-throughput monitoring their expression level is needed. The oligonucleotide microarray is one of common used method for detecting the expression of small RNAs. But this method can only detect known small RNA sequences by designing corresponding probe sets. To overcome this problem, next-generation sequencing (NGS) technology which can produce millons of sequencing reads at a time is applied for profiling the expression level of small RNAs. NGS has higher sensitivity and specificity than olignucleotide microarray. Moreover, NGS can identify novel non-coding small RNAs such as novel miRNAs. There are over 60 published studies about non-coding small RNA analysis by next-generation sequencing technology in animals, plants, bacterial and virus (Table 1). The amount of published studies per year also increases from the date (2004) which NGS is available (Figure 1).
To handle large amount of small RNA sequencing data sets, various standalone packages, web-based tools and algorithms are designed for different purposes. For example, using traditional alignment tools like BLAST [1] and blat [2] to map sequencing data to genomic sequences is not efficient. So, several tools such as SeqMap [3], ZOOM [4], Maq [5], Bowtie [6] and SOAP [7] are developed for analyzing numerous short sequences and map millions of short
2
sequences to genomic sequences. miRDeep [8] is designed for identify novel miRNAs from small RNA NGS data. For automatically profiling the expression of miRNAs, miRExpress [9] and miRNAkey [10], standalone packages, are developed. Web-based tools such as miRanalyzer [11], SeqBuster [12], DSAP [13] and mirTools [14] are also built. However, there are no any systematic and comprehensive analysis flows for annotating small RNA sequencing data completely. In order to solve this problem and provide more detailed annotation for sequencing data, the analysis pipeline of non-coding small RNA data by NGS in different organisms such as animals and plants is certainly need to be constructed.
This work aims at developing the systematic and comprehensive analysis pipeline in small non-coding RNA including animals and plants for next-generation sequencing data. This pipeline contains sequencing raw data preprocessing, the expression level of small RNAs profiling, novel miRNAs discovery, the target genes of small RNAs identification and functional analysis of target genes by combining multiple related data such as Gene Ontology (GO), pathway information from KEGG [15] and gene expression data from cDNA microarray. The method for each part is designed for optimizing the running time and the results like generating more correct expression profiles and reducing the false positive rate of target gene prediction. In addition, easily understood analysis results of each part are also important for researchers. Therefore, the analysis result of this pipeline is designed for abundance of biological significance, easily read and simple formats.
3
Table 1. Non-coding small RNA studies using next-generation sequencing
technology
Species Number of published studies References
Animals Homo sapiens 19 [16-34] Mus musculus 2 [35-36] Others 13 [37-49] Plants Arabidopsis 8 [50-57] Oryza sativa 3 [58-60] Others 13 [61-73] Bacterial 4 [74-77] Virus 2 [78-79]
Figure 1. The distribution of non-coding small RNA studies by NGS. Data
collection until 2011.03 1 4 4 9 16 24 7 0 5 10 15 20 25 30 2005 2006 2007 2008 2009 2010 2011.03
Num
be
r of
publ
is
e
d
s
tudi
e
s
4
2. Background
2.1 Next-generation sequencing technology
Next-generation sequencing (deep sequencing) technology is a new sequencing approach which produces millions of sequencing reads at a time. The general workflow of next-generation sequencing is preparing samples for sequencing by ligating specific adaptor oligos to 5’ and 3’ ends of DNA fragments. Then, the samples are subjected to the next-generation sequencers. The length of sequencing reads is 25~1000 nt according to different sequencing platforms. The quantities of sequencing reads are also different in each sequencer. The difference between next-generation sequencing (NGS) and Sanger sequencing are the number of produced reads at a time (NGS: 100 MB-30 GB, Sanger: 0.1 MB), the length of reads (NGS: 25-1000 nt, Sanger: 700-900 nt) and the cost per GB (NGS: $2K~84K, Sanger: >$2500K). Five next-generation sequencers can be chosen now. They are Roch454 FLX sequencer, Illumia Genome Analyzer, Applied Biosystems SOLiD sequencer (ABI SOLiD), HeliScope Single Molecule sequencer (Helicos tSMS) [80-82] and Pacific Biosciences [83].
Roche 454
Roche 454 is the first next-generation DNA sequencer which is commercially introduced in 2004. Roche 454 sequencer produces sequencing reads based on the principle of prosequencing. Figure S1 demonstrates the workflow of Roche 454 sequencer. The sample is constructed by ligating 454-specific adaptors to DNA fragments. Then, ligated DNA fragments are amplified by bead-based emulsion polymerase chain reaction (em-PCR). After em-RCR, amplified beads
5
are loaded into the picotiter plate (PTP). PTP is the solid surface which contains the single wells for packing beads and enzyme beads. In the PTP, all amplified beads are sequenced by pyrosequencing reactions. Nucleotides are flowed sequentially and sequenced by detecting the light which is generated through the release of pyrophosphate. Roche 454 sequencer can produce 700 Mb of sequences per run in 23 hours. The length of sequences is 700-1000 nt [80-82].
Illumia Genome Analyzer
Illumina Genome Analyzer which is developed based on the concept sequencing by synthesis (SBS) is available in 2006. Figure S2 is the workflow of Illumina Genome Analyzer. Before loading the sample into the flow cell, it needs to be done fragmentation and 5’ and 3’ adaptor ligation. The ligated DNA fragments are amplified by bridge amplification (an isothermal process that amplifies each fragment into a cluster). To sequence each cluster in the same direction, one strand of amplified clusters is selectively removed. Then, the flow cell is transferred to the Genome Analyzer. Each single-strand cluster is sequenced by SBS reactions (imaging, removing the fluorescent group and deblocking the 3’ end for next cycle). In each chemistry cycle, only a single base is identified. So, the length of sequencing read is determined by the number of cycles of nucleotide incorporation, image and cleavage. Illumina Genome Analyzer can produce 95 GB of 100-150 nt sequencing reads per run in 2 days [80-82].
6
ABI SOLiD
Applied Biosystems SOLiD sequencer (ABI SOLiD) is commercial release in October 2007. Like Roche 454, it uses em-PCR to amplify fragment DNA into beads. ABI SOLiD uses a unique sequencing process catalyzed by DNA ligase (Figure S3a). The ligation-based sequencing process begins with annealing a universal primer which is perfect complementary to the 5’ end adaptor. Then, 16 random 8-mer probes are added. The first and second 3’ end of the probes are labelled using one of four fluorescent dyes and complementary to the template sequences. After ligation, the fifth dinucleotide is imaged. Then, the 6-8 nucleotides of the probes are removed and adding the random probe set. Every dinucleotide profile is imaged after several rounds of ligation and the sequencing reads are identified (Figure S3b). This ligation-based approach is called as 2 base encoding. SOLiD sequencer can produce 10-20 GB of sequencing reads (25-75 nt) per run in 2-4.5 days [80-82].
Helicos’ tSMS
Helicos’ tSMS sequencing platform is available in 2008. It is the first next-next generation (3rd generation) sequencing platform. The technology of tSMS is
different with Roche 454, Illumia and SOLiD. tSMS do not amplify the templates before sequencing. Library preparation is also different with other three sequencing technologies (only adding a poly-A tail and labeling the fluorescent). Then, tailed templates are detected according to the fluorescent label through hybridiinge to poly-T oligonucleotides on the flow-cell surface. The sequencing flow of tSMS is called as terminator SBS. The terminator nucleotides are based on steric hindrance to deter the incorporation of more than one nucleotide per cycle. Fluorescent is removed and the next fluorescent nucleotide is added singly per
7
cycle after identifying incorporate nucleotides. tSMS currently produces 21-28 GB of sequencing reads (25-50 nt) per run in 8-9 days [81].
Pacific Biosciences
Pacific Biosciences is the second 3rd generation sequencing platform (announced
in 2010). Like Helicos’ tSMS, it does not need to do amplification before sequencing. The sequencing method of Pacific Biosciences is called as single-molecule real-time (SMRT) sequencing. It directly observed DNA synthesis on single DNA molecules in real time by using zero-mode waveguide (ZMW) technology. The first commercial SMRT array contained ~75000 ZMWs. Each ZMW contains a DNA polymerase loaded with DNA samples. The sequencing length of SMRT is >1000 nt (maximum length is more than 10000 nt). Moreover, the time per run is only several hours [83].
Comparison of next-generation sequencing technologies
Table 2 lists the performance comparison of current different next-generation sequencing platforms. Among these five sequencing platforms, tSMS and Pacific Biosciences are 3rd generation sequencing platform which do not do
amplification. Therefore, the sequencing error rate is lower than other three platforms (the error rate of Pacific Biosciences could not be obtained from official site but it should be very low according to the sequencing method). This is because some templates which are sequenced do not incorporate a nucleotide at the corresponding cycle during the amplification processes. For Pacific Biosciences, the length of sequencing read is more than 1000 nt. It is more suitable than other sequencing platforms in de novo assembly and SNP identification.
8
Table 2. The performance comparison of next-generation sequencing
technologies
Roche 454 (FLX-Titanium)
Illumia Genome Analyzer (IIx)
ABI SOLiD Helicos tSMS Pacific Biosciences Method of
amplification
Bead-based/ emulsion PCR
Bridge amplification Bead-based/ emulsion PCR N/A N/A Sequencing chemistry Pyrosequencing Polymerase-based sequencing-by-synth esis Ligation-based sequencing Virtual terminator SBS Single-molecule real-time sequencing Read length 700-1000 100-150 35-75 25-55 >1000
Run time 23h 2 days for 36-cycle single-end run, 4 days for 36-cycle paired-end run 6-7 days for fragment libraries, 8 days for 2×25 base paired-end libraries 8-9 days < 1 day Throughput/r un (Gb) 0.7 95 10-20 21-35 Unknown Error rate of sequencing 0.005% 0.001% 0.01% 0.005% Unknown
9
2.2 The biogenesis of microRNAs in animals
MicroRNAs (miRNAs), small non-coding RNAs of 19~25 nt sequences, play important roles in gene regulation in animals and plants. Generally, miRNAs hybridize to the 3’-untranslated region (3’-UTR) of mRNA to down-regulate gene expression or to induce the cleavage of mRNA and can fully hybridize to the transcripts of target gene [84]. Previous studies have suggested that miRNAs are strongly associated with various cancers [85] and various crucial cell processes such as apoptosis, differentiation and development.
10
MicroRNA (miRNA) genes are generally transcribed by RNA Polymerase II (Pol II) in the nucleus to form large pri-miRNA transcripts, which are with 5’ 7-methyl guanosine cap and 3’ poly-A tail. The pri-mRNAs can be classified into two types according to their genomic locations (Figure 2). One is intragenic pri-miRNA which locates in the known gene. Another is intergenic pri-miRNA which locates in the region which does not be annotated as the gene. 60-100 nucleotide pre-miRNA precursors are produced through the transcription process of pri-miRNA transcripts. This transcription is processed by the RNase III enzyme Drosha and its co-factor DGCR8 [86] (also known as Pasha). Drosha functions as the catalytic subunit, while DGCR8 recognizes the RNA substrate in this process. Then, the pre-miRNA is exported to the cytoplasm by exportin-5 and turned into the miRNA duplex by RNase III enzyme Dicer [87]. One strand of the miRNA duplex is incorporated into the protein complex known as RNA-induced silencing complex (RISC) with Argonaute proteins [88]. Previous study shows that nuclear RISC, consisting only of Ago2 and mature miRNA, is loaded in the cytoplasm and imported into the nucleus [89]. Diederichs and Haber indicate that Ago2 can serve as Dicer enzyme to cleave pre-miRNA [90]. The mature miRNA then binds to complementary sites in the 3' untranslated regions (3'-UTRs) of mRNA to negatively regulate gene expression depend on the degree of complementarity between the miRNA and its target. miRNAs that bind to mRNA targets with imperfect complementarity block the expression of target gene at the level of protein translation. Complementary sites for miRNAs by this mechanism are generally found in the 3’UTR of the target mRNA genes. miRNAs that bind to their mRNA targets induce target-mRNA cleavage. The regions among miRNA-binding sites called as seed regions (Watson–Crick consecutive base pairing between
11
mRNAs and the miRNA at position 2-8 from its 5' end) [91] located in 3'-UTRs of mRNAs are important to translational repression and mRNA degradation [92].
Figure 3 shows the function of miRNAs in different ways. Plant miRNAs differ from animal miRNAs in that many plant miRNAs have perfect homology to their target mRNAs, and they act through the RNAi pathway to cause mRNA degradation [93]. However, some plants with imperfect complementarity to their target sites and act a function similar to animal miRNAs. Plant miRNAs are also known to target chromatin modifications, such as histone methylation and DNA methylation [94].
Figure 3. miRNA function: (A) mRNA degradation, common in plants, (B)
Translation repression, common in animals, (C) Transcription repression by histone or DNA methylation, common in yeasts, plants, and possibly animals
12
2.3 MicroRNAs and siRNAs in plants
In plants, small RNAs (19-27 nt) can be classified into two classes, microRNAs (miRNAs) and short interfering RNAs (siRNAs), play an important role in gene regulation. siRNAs contain trans-acting siRNAs (tasiRNAs), natural antisense transcript siRNAs (nat-siRNAs) and heterochromatic siRNAs (hc-siRNAs). Figure S4 demonstrates that the biogenesis and relationship of miRNAs and each type of sRNA in plants.
The biogenesis of miRNAs in plants
The biogenesis of miRNAs in plants has some difference with animals. In plants, the length of stem-loops generally is longer than that of animal stem-loops. DCL1 (DICER-LIKE1) has the functions of Drosha and Dicer. The miRNA/miRNA* duplex is produced through DCL1 interacting with HYL1 (HYPONASTIC LEVAES1) to cleave the miRNA precursor in nucleus [95-98]. The mature miRNA is methylated by HEN1 (HEN1 is also in nucleus) [94]. Methylation protects small RNAs from degradation and polyuridylation. Exporting miRNA duplexs or mature miRNAs to the cytoplasm is completed by HASTY [99] (the function is similar with Exportin-5) (Figure S5).
Like animals, plant miRNAs require Argonaute protein for forming RNA-induced silencing complex (RISC) [100]. However, the degree of complementarity between miRNAs and their targets is different in plants. Unlike animals, nearly perfect complementarity between miRNAs and their targets is required in plants [100-103]. Most plants miRNAs only have four or less mismatches with their targets. These mismatches usually locate in the 3’ region of miRNAs [104]. The degree of complemnetarity in the region of miRNA/mRNA duplex at position 3-11 affects the efficiency of cleavage in mRNAs [105]. The
13
affection of miRNAs and their targets is also different between animals and plants. In animals, most miRNAs guide translational repression of their target genes. In plants, most miRNAs lead to mRNA cleavage by targeting the coding region of mRNAs. The previous studies demonstrated that about two-thirds of plant miRNAs regulate the expression of transcription factors during plant development. In additional to their great affection in development [106-107], they also play important roles in plant responses to biotic and abiotic stresses and nutrient homeostasis [106, 108-112].
The biogenesis of tasiRNAs
Trans-acting siRNAs (tasiRNAs) which has similar function to miRNAs down-regulate the expression of genes are 21 nt regulatory siRNAs. TasiRNAs are generated from specific miRNAs cutting TAS primary RNAs process. TAS genes transcribe long primary RNAs which do not generate protein products. Its’ function is serving as the precursors of the tasiRNA. In processing tasiRNAs, miRNAs guide the cleavage of tasiRNA primary transcripts which are converted into the structure of dsRNA by SGS3 and RDR6 binding to one of the two single-stranded TAS cleavage sequences. Then, DCL4 (DICER-LIKE4) with DRB4 cuts the dsRNAs and produces 21 nt tasiRNA-mRNA duplexes (Figure S6) [113-115]. Like miRNAs, tasiRNAs are methylated by HEN1 for avoiding degradation and polyuridylation. Different tasiRNA families regulate the gene expression by forming RISC with different AGO family protein (Figure S4). AGO1 involves with TAS2 tasiRNAs and AGO7 involves with TAS3 tasiRNAs. The high degree of complementarity between tasiRNAs and mRNA is needed to guide mRNA cleavage. The different members of same gene family are targeted by either miRNAs or tasiRNAs. For example, miR161 or TAS2 tasiRNA target the
14
members of PPR family and miR160, miRN167 or TAS3 tasiRNA target the members of ARF family, respectively. According to previous studies report, tasiRNAs are found only in plants [116].
The biogenesis of nat-siRNAs
Natural antisense transcript siRNAs (nat-siRNAs), 24 or 21 nt siRNAs, are generated from natural antisense transcripts (NATs). NATs are formed by two coding or non-coding RNAs that have complementary regions. There are two classes of NATs, cis-NATs and trans-NATs [50, 117-125]. The transcripts in the same genomic locus but in different strands form cis-NATs. For example, the genomic locus of SRO5 is at chr5: 25097998-2509997 [+]. The genomic locus of P5CDH is at chr5: 25099003-25103298 [-]. The overlapping region is at chr5: 25099003-2509997. The cis-NATs can be categorized into three groups, convergent (overlapping in the 3’ ends of two transcripts), divergent (overlapping in the 5’ end of two transcripts) and enclosed (one transcript can completely overlap another transcript) according to the conditions of overlapping. Trans-NATs are formed by the overlapping regions of two transcripts from different genomic locus.
The 24 nt nat-siRNAs are derived from the complementary region by the interaction of DCL2 (DICER-LIKE2), NRPD1a, RDR6 and SGS3. These 24 nt nat-siRNAs guides the cleavage of the constitutive transcript and establishes a phase for the sequential production of 21 nt nat-siRNAs by DCL1 (Figure 7). Unlike tasiRNAs, the function of nat-siRNAs is not for targeting other mRNAs. It can lead to post-transcriptional gene silencing by hybridizing to the cis-strand of mRNA. The member of AGO family involves in this mechanism does not be understood clearly. The well known example is SRO5 and P5CDH in Arabidopsis.
15
SRO5 and P5CDH have the function of regulating salt tolerance [126]. SRO5 and P5CDH have the overlapping region in their 3’end of transcripts. P5CDH is expressed constitutively. When SRO5 is induced in response to salt stress, the 24 nt nat-siRNAs are derived from the overlapping region of these two transcripts by DCL2, RDR6 and SGS3 interaction. These siRNAs direct the cleavage of P5CDH transcripts (Figure S7). Meanwhile, the dsRNAs are formed by RDR6, SGS3 and SDE4. 21 nt nat-siRNAs are produced from the cleavage of dsRNAs by DCL1. Then, the mRNA of P5CDH are degraded through these 21 nt nat-siRNAs targeting P5CDH.
The biogenesis of trans- nat-siRNAs does not be understood clearly. However, previous studies suggests that trans- NAT-siRNAs are involved in alternative splicing, post-transcriptional gene silencing [127-129]. There are some studies using the computational methods to screen whole Arabidopsis transcripts to find trans-NATs.
The biogenesis of hc-siRNAs
Heterochromatic siRNAs (hc-siRNAs), 24 nt siRNAs, are produced from transposable or repetitive elements [130-132]. Single strand non-coding transcripts are transcribed from heterochromatic locs by Pol IV and CLASSY1 (Figure S8). RDR2 involves in the formation of dsRNAs through using transcripts as templates. Then, the dsRNAs are processed into 24 nt siRNAs by DCL3. Methylation by HEN1 joins the process for protecting degradation and polyuridylation. The siRNAs are loaded into AGO4-RISC complex. DNA methylation and heterochomatic histone modifications are affected by PoI V and AGO4 interaction and the interaction in DRD1 (potential chromatin remodeling protein), DMS3 (structural maintenance of chromosomes hinge-domian protien)
16
and Pol V [133-137]. In Arabidopsis, the siRNAs derived from a transposable element inserting in the intron of FLC (FLOWERING LOCUS C) genes lead to the reduction of FLC and early flower. FWA gene is silenced through the siRNAs, generated from two tandem repeats in the promoter region of FWA, triggering DNA methylation. The siRNAs derived from the tandem repeats in the promoter region of SDC, a gene ecncoding the F-box protein, silenced SDC by triggering DNA methylation.
17
2.4 Regulation role of small RNA
The regulation role of miRNA in animalsThe miRNAs regulate the gene expression by targeting the 3’-UTR of mRNAs, resulting in degradation of mRNAs and repression of translation. miRNAs are reported strongly associated with various pathways such as cancer pathway and cholesterol metabolic pathway.
The well-known example in cancer pathway is that miRNA-34 (miR-34) family, miR-34 a, b and c, is down-regulated in various cancers. Figure S9 demonstrates the regulation role of miR-34 family in cancer pathway [138]. p53 is the key factor which regulate the abundance of miR-34 in cancer pathway. miR-34 family targets the set of mRNAs which support tumor formation such as E2F3, Bcl2, Notch, HMGA2, CDK4, CDK6 and Cyclin E2. E2F3 is an important transcription factor which initiated the production of proteins that affect cell-cycle checkpoint, DNA repair and replication. miR-34 family inhibits cell proliferation and activates cell death pathways by down-regulating the expression of E2F3. Bcl2 which usually over-expressed in cancer cells is the important gene in tumor formation. It protects tumor cells processed into apoptosis pathway. Reduction of Bcl2 expression level by miR-34 family targeting induces the apoptosis of cancer cells. The other miR-34 target genes such as Notch, HMGA2, CDK4, CDK6 and Cyclin E2 are involved self-renewal and survival of cancer stem cells. Therefore, the miR-34 family can inhibit tumor formation. According to the function of these miR-34 target genes, miR-34 family is a tumor suppressor in cancer pathway.
18
Recent studies reported miRNAs involve in cholesterol metabolic pathway. miR-33 a and b are the intragenic miRNAs [139-141]. Their host genes are SREBP (sterol regulatory element-binding protein) family. SREBP family is the transcription factor which is the key protein in cholesterol biosynthesis. miR-33 is co-expressed with its host gene (SREBP) and targets ABCA1 (adenosine triphosphate-binding cassette transporter A1). ABCA1 is the important regulator in HDL (high-density lipoprotein) synthesis and reversing cholesterol transport. Figure S10 demonstrates the regulation role of miR-33 in cholesterol metabolic pathway. Cholesterol accumulation induces the expression of ABCA1 and inhibits the expression of SREBP. ABCA1 medicates cholesterol efflux to apolipoprotein A1 (apoA-1) and HDL. The expression of ABCA1 is down-regulated by miR-33. Therefore, the role of miR-33 in cholesterol metabolic pathway is regulating the expression level of HDL with SREBP (the host gene of miR-33) by targeting ABCA1.
The regulation role of small RNAs in plants
In plants, many genes silencing are through small RNA such as miRNAs and siRNAs. miRNAs regulate the expression level of genes by targeting the coding region of the mRNA. siRNAs regulate the gene expression through multiple ways such as directly targeting the coding region of mRNA or transcriptional gene silencing by triggering DNA methylation and histone modifications. Table S1 lists the reported miRNAs which are involved in root development in Arabidopsis and Rice [142].
The miRNAs involve in auxin signing pathway are miR160, miR164, miR167, miR390 and miR393. miR160 targets ARF10, ARF16 and ARF17. The function of ARF10 and ARF16 is for root cap development. Overexpressing miR160 causes
19
serious root cap defect in rice (the targeting relationships do not be validated yet). The function of ARF17 is reducing primary root length and decreasing root branching in Arabidopsis. miR164 is the key regulator in lateral root development. miR164 targets NAC1 which transduces auxin signal for the emergence of lateral root. So, miR164 down-regulates auxin signal in lateral root development. miR167 targets ARF6 and ARF8 which are positive regulator of shoot-borne root emergence. miR390 regulate the expression of ARF2, ARF3 and ARF4 which involve in auxin signaling pathway by indirect targeting. miR390 target TAS3 which is the non-coding transcript and produce tasiRNAs. These tasiRNAs direct target ARF2, ARF3 and ARF4. miR390 regulates the auxin signal concentration and lateral root development by TAS3-ARF2/ARF3/ARF4 pathway. miR393 targets TIR1 (transport inhibitor response 1), AFB2 (auxin signaling F-Box proteins 2) and AFB3. So, miR393 regulates auxin signaling. Moreover, NAC1, the target gene of miR164, is the downstream of TIR1. NAC1 transduce auxin signal to promote lateral root development. Therefore, miR164 and miR393 may participate together in lateral root development.
Vegetative and reproductive processes of plant root require mineral elements in soil such as macronutrients, micronutrients and heavy metals. Several miRNA families involve in nutrition response or metabolism which affect plant growth. The first miRNA family is miR395 which is the key regulatore in sulphate metabolism by targeting SULRT2;1 (low-affinity sulphate transporter), APS1 and APS2 (ATP sulphurylases). The second miRNA family is miR398 which affects copperand zinc homeostasis by targeting CSD1 and CSD2. CSD1 and CSD2 are copper/zinc superoxide dismutase genes. Heavy metals such as copper and zinc are required for root growth. Therefore, miRNA398 has great influence in
20
plant root development and growth behavior of plants. The final miRNA family is miR399. miR399 involves in phosphate starvation response in Arabidopsis. The concentration of phosphate is one of important factor in root system architecture and growth habit. miR399 regulates phosphate homeostasis by targeting PHO2. External abiotic stress such as drought affects plant root growth. miR169 is induced by drought stress in Rice. But the target genes of miR169 are not identified.
miRNAs in plants also involve in other pathway excluding root development [133]. For example, miR156 targets over 50% members of SPL family. SPL 3, 4 and 5 promote the change of vegetative phase and floral transition. The length of plastochron is regulated by SPL9 and SPL15. miR172 targets AP2 (APETALA2) which regulates floral transitions. miR159 targets MYB33, MYB65 and MYB101. These MYB genes induce Gibberellin-responsive (GA) genes in the aleurone layer. Floral pattering and leaf morhpgenesis are regulated through miR164 targeting CUC1 (CUPSHAPED COTYLDON1) and CUC2 (CUPSHAPED COTYLDON2). miR165/166 targets RHB and REV which promote abaxial identity of lateral organs in both Arabidopsis and maize. miR319 targets several TCP genes (a large family of proteins containing “TCP domain”). TCP genes regulate cell divisons during leaf morphogenesis.
21
2.5 Application of NGS in small RNA
Small RNAs play an important role in regulating the expression level of gene. In the last few years, high-throughput and robust approaches for monitoring the expression of miRNAs have been used to understand how miRNAs are differentially expressed under various conditions. The oligonucleotide microarray is one method for detecting miRNA expression. This approach involves the design of probes based on known miRNAs that are collected in miRBase for miRNA expression profiling studies. However, the approach is restricted to detecting the expression of known miRNAs. Next-generation sequencing technology is an inexpensive and high-throughput sequencing method. This new method is a promising tool with high sensitivity and specificity and can be used to measure the abundance of small-RNA sequences in a sample. Hence, the expression profiling of miRNAs can involve use of sequencing rather than an oligonucleotide array. Additionally, this method can be adopted to discover novel miRNAs. There are over 60 published researches which applied NGS to their small RNA studies in animals, plants and bacterial (Table 1). In the latest version of miRBase [143], a database collecting 17341 mature miRNAs, there are 8117 mature miRNAs which are identified by NGS. NGS is a powerful method for profiling miRNAs expression and discovery novel mRNAs (near 50% miRNAs are found by NGS).
22
3. Related works
3.1 The repositories of miRNAs
miRBasemiRBase (http://www.mirbase.org/ ) is the first database which collects published miRNA sequences [143]. It contains 15172 miRNA precursors which express 17341 mature miRNAs in 142 species (miRBase 16.0). miRBase offers the comprehensive information for each miRNA such as the chromosome location, the predicted target genes and the expression level detected by next-generation sequencing technology. Users can also check their own sequences with whole miRNAs in miRBase. Moreover, miRBase offers users to download all data in the database for user-defined analysis by themselves.
3.2 miRNA target site prediction tools
TargetScan/TargetScansTargetScan [144] is the first developed miRNA target site prediction tool based on the concept of seed matches. The definition of seed matches is that seven continuous perfect complementarity in the miRNA /mRNA duplex in the 2-8 positions of the miRNA. A:U, C:G and G:U pairs are considered as complementarity. TargetScan scans the 3’UTR of mRNAs. For each predicted target site, the free energy of the duplex is assigned. TargetScans is the improvement version of TargeScan. TargetScans scans a set of orthologous 3’UTR of mRNA in a group of organisms. In TargetScans, seed matches are classified into 3 main types. The first is 6-nt seed match (6mer). The second is 7-nt matches to seed region (7mer-m8 and 7mer-A1). The third is 8-nt matches to seed region (8mer). The improvement of TargetScans offers users to obtain more confident
23 miRNA target lists.
miRanda
miRanda [145] is the open-source software for miRNA target sites prediction. The target prediction pipeline of miRanda contain three steps. In the first step, the miRNA/mRNA duplex is identified in the 3’UTR region of mRNA. G:U pairs and indels between the duplex are allowed. In the second step, the thermodynamic stability of the miRNA/mRNA duplex is computed. The third step is filtering the predicted target site by the cross-species conservation of target sites. In mammalian, the target sites of human, mouse and rat are used (target conservation>=90%). In fish, zebra fish and fugu are used (target conservation>=70%). miRanda offers users to define the cut-off value for some parameters such as score threshold, energy threshold and the penalty of indels.
PicTar
PicTar [146] is designed to identify common targets of miRNAs. The set of coexpressed miRNAs are used for finding the target locations in the multiple alignments of 3’ UTR of mRNAs. PicTar first searches perfect seed which is defined as 7-nt continuous matches starting at position 1 or 2 from the 5’ end of miRNAs. Then, predicted target sites are filtered according to the MFE (minimum free energy) of the miRNA target duplex and whether these sites locate into overlapping regions in aligned orthologous sequences. Remained target sites are called as anchors. HMM maximum likelihood score are used for ranking the user-defined minimum number of anchors. The score is calculated by considering all segmentations of the target sequence into target sites and background, thus accounting for the synergistic effect of multiple targeting sites for a single miRNA or varius miRNAs co-regulatinh the same mRNA.
24
PITA
PITA [147] is the first prediction tool which implements the target site accessibility into identifying the target sites of miRNAs. This concept is observing the difference between the energy of miRNA/mRNA duplex and the energy of unfolded the secondary structure of target region. The energy of miRNA-target duplex and target region are calculated by Vienna RNA packages. The gained energy from miRNA-target duplex is computed by RNAduplex. The folding energy of the target region is computed by RNAfold. The seed match in PITA is defined as beginning from the second position of 5’ end of miRNA with 6-8 continuous perfect matches excluding G:U pair. One wobble pairing (G:U pair) is allowed if the length of continuous matches is equal or larger than 7 nt.
RNAhybrid
RNAhybrid [148] is the miRNA target sites prediction tool which does not use the concept of seed match. It identifies all possible MFE in miRNA/mRNA duplexes by using the dynamic programming technique. The length of bulge and internal loops of the miRNA-target duplex are set to be smaller than 15 nt. The most important features of RNAhybrid is that several statistical issues are done such as the length normalization of binding energy, the significance of individual target prediction and modeling multiple binding sites by Poisson approximation. RNAhybrid is available for download and as a Web tool on the Bielefeld Bioinformatics Server (http://bibiserv.techfak.uni-bielefeld.de/rnahybrid/).
25
3.3 Tool and web servers for analyzing NGS small RNA
sequencing data
miRDeep
miRDeep [8] is the first stand-alone package which is designed to identify novel miRNAs from sequencing data generated by next-generation sequencing technology. miRDeep first aligns the sequencing reads with reference genomes. Then, the reads which have multiple genomic loci or mapped to rRNA, tRNAs, scRNA, snRNA and snoRNA are removed. Remained reads are used for finding potential miRNA precursors. Probabilistic scoring systems are applied to each potential precursor. miRDeep can be downloaded at http://www.mdc-berlinde/rajewsky/miRDeep and be executed on the standard Linux machine .
deepBase
deepBase [149] is a database which collected 185 NGS small RNA sequencing data in seven organisms (Homo sapiens, Mus musculus, Gallus gallus, Ciona intestinallis, Drosophila melanogaster, Caenhorhabditis elegans and Arabidopsis thaliana). The type of small RNAs which were annotated are nasRNA (ncRNA-associated small RNA), pasRNA (promoter-associated small RNA), easRNA (exon-associated RNA), rasRNA (repeat-associated), miRNA and snoRNA. deepBase also provided the interactive web interface (http://deepbase.sysu.edu.cn) for researchers quickly viewing the annotated small RNA sequencing data .
26
Geoseq
Geoseq [150] (http://geoseq.mssm.edu ) collects deep-sequencing data from various public repositories like GEO (Gene Expression Omnibus) and SRA (Sequence Read Archive) from NCBI and preprocessed these data. The method of Geoseq for dealing with the sequencing data is different with previous studies. It maps the reference sequence against sequencing data instead of mapping them to reference genomes or sequences. Researchers can analyze their own sequencing data against the processing data in Geoseq for identifying differential isoform expression in mRNA-seq datasets and identifying known and novel miRNAs in miRNA datasets.
miRanalyzer
miRanalyzer [11] (http://web.bioinformatics.cicbiogune.es/microRNA/ ) is the first web server tool for analyzing the next-generation sequencing data in small RNAs. Before uploading the sequencing data, the researchers need to merge the same reads to a unique one and counting their copy numbers (expression level). After running the datasets at miRanalyzer web server, researchers can obtain the analyzed results such as the expression level of all known miRNAs in miRBase, predicted novel miRNA lists and all sequencing reads which can be mapped to transcribed sequences (mRNA, ncRNA and rasiRNA). miRanalyzer also provides the target gene lists for all detected miRNAs by using two miRNA target site prediction tools (miRanda and TargetScan).
27
SeqBuster
SeqBuster [12] (http://estivill_lav.crg.es/seqbuster) is the web-based toolkit to deal with and analyze high-throughput sequencing small RNA datasets. It also offers the stand-alone version to overcome the storage capacity limitations of the web-based tool. It provides raw data preprocessing, miRNA profiling, the analysis of miRNAs variability (IsomiRs), differentially expressed miRNAs discovery and miRNA target sites prediction. For differentially expressed miRNAs discovery, the equation for normalizing the expression level is n = (freq n/sum [freq all seqs]) × scale-value. SeqBuster is the first tool offering the analysis of IsomiRs. For each detected miRNA, it provides the analysis results in 5’ end and 3’end trimming, 5’ end and 3’end adding and nt-substitution.
mirTools
mirTools [14] (http://centre.bioinformatics.zj.cn/mirtools/ ) is the web server which allow researchers to do comprehensive analysis through uploading their high-throughput sequencing small RNA data. In mirTools, researchers can process their raw sequencing data, explore the length distribution of reads, classify reads into different categories such as known miRNAs, snoRNA, rasiRNA and coding sequences, identify novel miRNAs, discovery differentially expressed miRNAs between different samples and predict the target genes of miRNAs by using miRanda and RNAhybrid. mirTools also provide the function analysis of miRNA target genes by investigating them in Gene Onotology terms and pathways .
28
DSAP
DSAP [13] (http://dsap.cgu.edu.tw ) is the web server which is designed for analyzing small RNA datasets produced by next-generation sequencing technology. Researchers need to prepare their datasets as a tab-delimited format which contains the unique reads and their expression level. The system flow of DSAP is different with other web tools for analyzing small RNA sequencing data. Other web tools align reads with reference genomes first. Then, they compare the chromosome location of reads with known miRNA or ncRNA location. DSAP directly align reads with miRNA precursors from miRBase and ncRNAs from Rfam. After mapping reads, the information of cross-species distribution of detected miRNAs is provided. DSAP also provides two or three sample comparison.
miRExpress
miRExpress [9] is the first stand-alone package which is designed for monitoring the miRNA expression and identifying novel miRNAs in small RNA datasets generated by next-generation sequencing technology. miRExpress combine the known miRNAs from miRBase (users do not handle the miRNAs information by themselves). Researchers can use miRExpress to preprocess their raw sequencing data, observe the length distribution of proceeded reads, monitor miRNA expression through user defined parameters, identify novel miRNA by cross-species miRNAs comparing. miRExpress also provides the alignments between detected miRNAs and reads. Users can find nucleotide modification from this report. miRExprees can be downloaded at http://mirexpress.mbc.nctu.edu.tw/ and be executed on x86 Linux 32 or 64 bit system.
29
miRNAkey
miRNAkey [10] is a package designed to analyze high-throughput sequencing miRNA data. The system flow of miRNAkey contains serval steps. First is trimming 3’ adaptor sequence from 3’ end of the reads. Second is mapping the reads to known miRNAs. Thrid is counting the expression level of mapped miRNAs and converting the expression into the normalized RPKM expression index (reads per kilobase prer million mapped reads). Fourth is identifying differentially expressed miRNAs by chi-squared analysis. Final is producing the additional information according to the input data, such as multiple mapping levels and post-clipping read lengths. The important improvement is that miRNAkey developed SEQ-EM algorithm for solve the multiple-aligned-reads problems in the detected miRNAs. miRNAkey is freely available for downloading at (http://ibis.tau.ac.il/miRNAkey ).
30
3.4 miRNA target interaction databases and tools
MAGIAMAGIA [151] (http://gencomp.bio.unipd.it/magia ) is the web-based tool which provides miRNA and gene integrated analysis. Users can start their searching by selecting the organism, the Entrez Gene, Refseq and ENSEMBL gene ID and setting the parameters of three miRNA target site prediction tools (miRanda, TargetScan and PITA). Then, users need to upload the expression profile of mRNAs and miRNAs. Different or the same biological samples are allowed. Then, MAGIA run analysis by systematically combining predicted miRNA target genes and the expression profile of miRNA and mRNA. Pearson and Spearman correlations, mutual information, variational Bayesian model and meta-analysis are used for the measure of miRNA-target interactions. The reports of MAGIA provide the bipartite regulatory network which gives the straightforward view of miRNA-target interactions. The useful links in the network are also offered such as miRNA-disease information from miR2Disease, gene expression level in Atlas databases and the text-mining searching link to PubFocus and EbiMed (miRNAs and genes as keywords).
miRGator
miRGator [152] (http://miRGator.kobic.re.kr ) is an integrated repository which collects the information of miRNAs, miRNA-associated gene expression, predicted miRNA target sites, miRNA-disease information and genomic annotation in human. The expression profiles of gene in miRGator have two types. One is miRNA knockout. Another is miRNA overexpressed. For miRNA target sites, both known (validated) and predicted miRNA-target interactions are collected. The relationships between miRNAs and disease are obtained from
31
literature. miRGator integrates these collected data and creates various specific relationship such as differentially expressed miRNAs against differentially expressed miRNA target genes and differentially expressed miRNAs against disease-associated miRNAs. miRGator uses the network representation to give the results of different relationships. Moreover, the gene (differentially expressed or miRNA target) annotations are also provided through the information gene ontology (GO) and pathways (KEGG).
TarBase
TarBase [153] (http://www.diana.pcbi.upenn.edu/ ) is the first database which collects experimental validated miRNA targets. TarBase collects the sets of positive and negative miRNA targets in human, mouse, fruit fly, worm and zebrafish. Positive and negative miRNA targets are judged by detecting the sufficiency of the target site to induce translational repression or cleavage. TarBase also provides the functional links to several databases such as Gene Ontology (GO) and UCSC Genome Browser.
miRecords
miRecords [154] (http://miRecords.umn.edu/miRecords ) is an integrated database for miRNA-target interactions. miRecords collects 1135 experimental verified miRNA-target interactions between 301 miRNAs and 902 target genes in seven animal species. miRecords also predicted miRNA targets which are produced by using 11 developed miRNA target site prediction software. At the website of miRecords, user can find the miRNA-target interactions by the miRNA name, the RefSeq accession, the Entrez Gene ID or the gene name of target gene searching.
32
miR2Disease
miR2Disease [155] (http://www.miR2Disease.org ) is the resource for the relationship between miRNA target genes and human disease. miR2Disease collects 1939 relationships between 299 human miRNAs and 94 human diseases. Users can search the relationship of miRNA s and diseases by the miRNA ID, the disease name and the gene name through the web interface of miR2Disease. Moreover, the submission page is provided for researchers submitting the miRNA-disease relationship which is not found in miR2Disease.
miRTarBase
miRTarBase [156] (http://mirtarbase.mbc.nctu.edu.tw/ ) is the repository which collects 3576 experimental validated MTIs (miRNA-target interactions) between 657 miRNAs and 2297 target genes in 17 species. There are several experimental protocols which can give strong or weak evidence for MTIs. Strong experiment evidence contains Luciferase reporter assay, qPCR (quantitative polymerase chain reaction) and western blot. Weak evidence contains pSILAC and cDNA microarray. pSILAC is designed to high-throughput screening the expression level of proteins when the miRNA is expressed or not. cDNA microarray is used for detect the mRNA expression when the miRNA is present or not. miRTarBase also provides the functional analysis of these verified miRNA target genes by doing Gene Ontology (GO) and pathway (KEGG) enrichment annotations.
starBase
starBase [157] (http://stabase.sysu.edu.cn/ ) is a database which contains miRNA-mRNA interaction from Argonaute CLIP-Seq and Degradome-seq data. Argonaute CLIP-seq and degradome sequencing (Degradome-seq) which are high-throughput technologies are applied to identify the interaction sites
33
between miRNAs and mRNAs in animals and plants, respectively. 21 CLIP-seq and 10 Degradome-Seq experiments from six organisms are used to identify 1 million Ago-binding clusters in animals and 2 million cleaved target clusters in plants. In animals, TargetScan, PicTar, miRanda, PITA and RNA22 are applied to identify the target sites in detected Ago-binding clusters. Approximate 400000 miRNA-mRNA interactions are identified between 1348 miRNAs and 26296 genes. In plants, approximate 6600 miRNA-target regulatory relationships in 25579 genes and 856 miRNAs are identified by using the CleaveLand program. User can easily obtain various results such as mapped reads, predicted and known miRNA targets, ncRNAs, protein-coidng genes, target-peaks and target-plots at the web site of starBase. Function analysis of miRNA target genes are offered by combining pathways (KEGG and BioCarta) and Gene Ontology (GO). starBase also provides the interface to allow users to predict miRNA target sites in defined sequencing clusters in animals or plants.
34
3.5 Transcriptional regulation related database and tools
miRStartmiRStart (http://mirstart.mbc.nctu.edu.tw/ ) is the repository of human miRNA TSSs (transcription start sites). Three published experimental evidences are used for identifying TSSs of miRNAs. The first is Cap-analysis gene expression (CAGE) tags [158]. Cap-analysis gene expression (CAGE) tags are ~20 nts sequences derived from the 5’ terminal of cDNA. CAGE tags can be generated using biotinylated cap-trapper with specific linker sequence to ensure the sequence after 5’ cap of cDNA was reserved. The CAGE tags contain the first base of 5’ terminal sequence, that is, the transcription start site of RNA polymerase II transcripts. The second is ChIP-Seq of histone methylation [159]. ChIP-Seq, a massive parallel signature sequencing technique, offers a high-resolution profiling of histone methylations in the human genome. For example, H3K36me3 and H3K20me1 are associated with actively transcribed regions and support powerful evidence for TSS identification. The third is illumina Solexa tags from DBTSS [160]. Illumina Solexa tags were derived using a new-generation and high-throughput sequencing technology, which DNA templates are immobilized on a special surface fluorescently labeled nucleotides with specific enzyme. The genomic position of Solexa tags in the DBTSS could be directly mapped to the upstream flanking region of intergenic miRNA precursors to support evidence for the detection of miRNA TSSs. The SVM (Support Vector Machine) model is used for incorporating three evidences to identify high-confidence TSSs of miRNAs. Moreover, ESTs (Express short tags) are also provided for reconfirmation.
35
TRANSFAC
TRANSFAC [161] is a database which collects transcription factors and their binding sites in various organisms. TRANSFAC collects the sequences of TFBS (transcription factor binding site) for each transcription factor (TF). Then, for each TF, the binding profiles called as PWMs (Position Weight Matrix) are generated. For each PWM, the consensus sequence is generated based on IUPAC code. The definition of the consensus sequence is that in the possible type of nucleotides at each position. For example, the consensus is “TACNAYACTTG” from 5’end to 3’end. The nucleotide at position 5 is A (not T, G or C). The nucleotide ate position 6 is C or T (not A or T). The external database annotations of TFs are also provided such as Genbank, EMBL, SWISSPORT and PIR. Users can use the binding profiles to scan whether TFBSs locate in the promoter sequences. TRANFAC is only for economical using now.
JASPAR
JASPAR [162] (http://jaspar.genereg.net) is the open-access database which collects 457 non-redundant matrix profiles. These profiles represent the DNA-binding sequences of transcription factors and other protein-DNA interacting patterns. These profiles are generated by extracting from Chip-seq and Chip-chip experiments. Chip-seq and Chip-chip offers high-throughput and whole genome screening protein-DNA interacting sites. JASPAR also collects 840 profiles which are found by literature searching and other databases such as PBM, PBM_HOMEO and PBM_HLH. Users can download the binding profiles for checking the relationships between TFs and their interested sequences (the promoter of the gene). Users also can use the web interface to easily reach this aim. JASPAR also provides the standardized system for the classification of TFs
36
and grouping into families based on the similarity of binding profiles. User can find easily the relationships in different TFs by this system.
MATCH
MATCH [163] is a tool which is designed for searching putative transcription factor binding sites in DNA sequences. MATCH constructed the scoring system and threshold profiles for each transcription factor binding profiles (PWMs). For the scoring system, the matrix similarity score (MSS) and the core similarity score (CSS) are used for measuring the degree of similarity between the DNA sequences and the matrix. The range of MSS and CSS is 0.0 to 1.0. The definition of the core of the matrix is the first five most conserved continuous positions in the matrix. For the threshold profile, the different cut-off values of two scores are set for each matrix. Three threshold profiles are supported for different purposes. They are for minimizing false positive (over-prediction error), minimizing false negative e (under-prediction error) and minimizing the sum of both errors. MATCH also offers users to transform their own binding sequences into the PWM and construct the default threshold profile. The public version of
MATCH can be free downloaded at http://www.gene-regulation.com/pub/programs.
37
3.6 Other related resources
Gene OntologyGene Ontology (http://www.geneontology.org/ ) is the repository for the annotation of gene products properties. Gene Ontology (GO) contains three major domains. The first is celluar component (cc) which represents the part of a cell or gene’s extracellular environment. The second is molecular function (mf) which means the elemental activities of the gene product at the molecular level. The third is biological process (bp) which represents the operations or sets of molecular events with a defined beginning and end, pertinent to the functioning of integrated living units (cells, tissues, organs and organisms). The tree structure is used to define the scope of each GO term. The node at top of the tree is more global and contains more involved genes. The node at bottom of the tree is more specific and contains fewer involved genes. For example, cell cycle is more global and regulation of meiotic cell cycle is more specific. The description of each GO term and the the tree structure of GO terms can be freely downloaded at the website. The GO annotated gene sets in various species are also available.
KEGG
KEGG [15] (Kyoto Encyclopedia of Genes and Genomes) is the bioinformatics repository including molecular interaction networks (pathways and complexes), the information of genes and proteins, chemical compounds and chemical reactions in various organisms. There are over 6000 drawn pathways in KEGG. The pathway is the protein interaction network which contains three types of interactions such as enzyme-enzyme reaction, direct protein-protein interaction and transcription factors with their target genes. The pathways are categorized into seven classes such as metabolism, genetic information processing,
38
environmental information processing, cellular processes, organismal systems, human disease and drug development. Users can easily find the roles of their interested genes by observing the function of the pathways which these genes involve. KEGG (http://www.genome.jp/kegg/ ) also offers users to download the data.
Vienna RNA Package
Vienna RNA package is the free and stand-alone software for RNA secondary structure prediction and comparison. Vienna RNA package can offer users to: 1. predict minimum energy RNA secondary structures; 2. compare RNA secondary structures; 3. predict hybrid structure of two structures and possible hybridization sites; 4. predict the consensus RNA secondary structure from several aligned sequences; 5. draw RNA secondary structures; 6. predict the RNA-RNA interaction sites by using accessibilites. Users can also use these function at Vienna RNA WebServers (http://rna.tbi.univie.ac.at/ ).
Rfam
Rfam [164] (http://rfam.sanger.ac.uk/ ) is the repository which collects 1446 RNA families. RNA families contain three function classes such non-coding RNAs, structured cis-regulatory elements and self-splicing RNAs. Rfam offers users to browse the multiple sequence alignments, consensus RNA secondary structures and covariance models (CMs) for each RNA family. Users can also search RNA families by keywords, their interested sequence sets, taxonomy ID and the classes of miRNAs (snRNA, miRNA, cis-regulatory elements…etc).
39
RNALogo
RNALogo [165] (http://ranlogo.mbc.nctu.edu.tw/ ) is a web-based tool for generating the graphical representation of RNA consensus secondary structure. Users can upload their interested sequence sets (aligned or not aligned). Then, RNALogo gives the reports which contain conversation of each position by different font size and different colors for the conversation in base-pairing. Users can easily find the key regions of their interested sequence sets from these graphical reports. Moreover, RNALogo supports the preprocessed reports for known regulatory RNAs in Rfam. Users can compare their interested sequence sets with known regulatory RNAs.