Score-Matched Patients With Peritoneal Dialysis and
Hemodialysis in Taiwan
Yu-Kang Chang, MS, Chih-Cheng Hsu, MD, DrPH, Shang-Jyh Hwang, MD, Pei-Chun Chen, PhD, MSPH,
Chiu-Chin Huang, MD, Tsai-Chung Li, PhD, MS, and Fung-Chang Sung, PhD, MPH
Abstract:Studies comparing mortality for Asian populations with end-stage renal disease (ESRD) on hemodialysis (HD) and peritoneal dialysis (PD) are limited. We compared mortality between patients treated with PD and HD in Taiwan, the population with the highest incidence of ESRD worldwide. Using the population-based insurance claims data of Taiwan from 1997 to 2006, we identified 4721 patients treated with PD and randomly selected 4721 patients treated with HD who were frequency-matched to the PD patients based on their propensity scores. In follow-up analyses we measured mortalities and hazard ratios asso-ciated with comorbidities in 2 different 5-year cohorts (1997Y2001 and 2002Y2006).
In the 10-year period from 1997 to 2006, the overall mortality rates were similar in patients treated with PD and in patients treated with HD (12.0 vs. 11.7 per 100 person-years, respectively), with a PD-to-HD hazard ratio of 1.02 (95% confidence intervalECI^, 0.96Y1.08). In the first 5-year period (1997Y2001), the hazard ratio for mortality was higher for PD (1.33; 95% CI, 1.21Y1.46), but there was no difference between PD and HD in the 2002Y2006 cohort. Of note, younger patients who received PD had better survival than younger patients who received HD; this was especially true for patients aged younger than 40 years.
In summary, in this Asian population, no significant survival differ-ences were noted between propensity score-matched PD and HD patients. The selection of a dialysis modality must be tailored to the individual patient. Studies in which patients who are appropriate for either modality are randomly assigned to HD or PD may provide helpful information to clinicians and patients.
(Medicine 2012;91: 144Y151)
Abbreviations: CI = confidence interval, CCI = Charlson Comorbidity Index score, DM = diabetes mellitus, ESRD = end-stage renal disease, HD = hemodialysis, NHI = National Health Insurance, NHRI = National Health Research Institute, PD = peritoneal dialysis.
INTRODUCTION
E
nd-stage renal disease (ESRD) has emerged as a disease with a high medical burden worldwide. The disease is most preva-lent in Taiwan, the United States, Germany, and Japan.6,13,26,31Since 2002, Taiwan has had the highest incidence and prevalence of the disease in the world.6In the United States, approximately 112,000 people are diagnosed with ESRD annually. Most patients with ESRD undergo chronic dialysis, either hemodialysis (HD) or peritoneal dialysis (PD).4The preference for using HD or PD varies considerably among patients.5Y7,12,21
In 2006, HD was used for 92.4% of dialysis patients in Taiwan,791.7% in the United States,5and 18.7% in Hong Kong.
There has been considerable interest in evaluating the treatment effectiveness of PD and HD in the past 2 decades, and many observational studies have been conducted.4,14,17,18,21,23,25,28,35
Several studies have reported that PD appears to be associated with equal or better survival during the first year17,19,22Y25,31,34 or the first 2 years of dialysis compared with HD.4,14,18,28 Studies comparing the length of survival of patients on HD and PD have yielded conflicting results,1,4,11,14,17,18,21,25,27,28,32,33
particularly because of the absence of similar comorbidity bur-dens in the 2 groups.
McDonald et al22analyzed the population-based registries of Australia and New Zealand and found that treatment with PD is more effective than HD in year 1 during a 5-year follow-up period. Several studies have compared PD patients with propen-sity score-matched HD patients for survival probability.8,27,35 Weinhandl et al35used the propensity score-matching technique to establish retrospective study cohorts and performed PD-to-HD survival comparison. Their population-based study suggests better survival for patients treated with PD than those treated with HD.
Comparative studies on HD and PD survival for Asian populations using population data for a longer period are lim-ited. To the best of our knowledge, comparisons of secular trends in mortality between PD and HD using a propensity score-matched design have not been reported for Asian patients. There-fore, we used a propensity score-matched design to identify PD and HD patients from the universal insurance claims data of Taiwan to investigate the temporal change in mortality in pa-tients in 2 sets of 5-year cohorts (1997Y2001 and 2002Y2006). We measured the PD-to-HD hazard ratios for mortality in the follow-up years to compare the trend between these 2 cohorts. We also investigated the role of comorbidities, particularly dia-betes mellitus (DM), in association with the survival differences between PD and HD treatments over time.23
METHODS Study Design and Patient Selection
We conducted a historical retrospective cohort study using claims data from 1997 to 2006 obtained from the Taiwan National From the Institute of Population Health Sciences (YKC, CC Hsu), National
Health Research Institutes, Zhunan, Taiwan; Department of Public Health (YKC, PCC, FCS), Division of Nephrology (CC Huang), and Institute of Biostatistics (TCL), China Medical University and Hospital, Taichung, Taiwan; and Division of Nephrology (SJH), Kaohsiung Medical University Hospital, Kaohsiung, Taiwan.
Presented in part in abstract form at the Annual Meeting of the American Society of Nephrology, San Diego, CA, October 27-November 1, 2009. Funding and conflicts of interest: This study was supported by grants NSC
98-2621-M-039-001, CMUH 1MS1, DOH100-TD-B-111-004, and DOH100-TD-C-111-005 of Taiwan.
The authors have no other funding or conflicts of interest to disclose. Reprints: Professor Fung-Chang Sung, PhD, MPH, China Medical University
College of Public Health, 91 Hsueh-Shih Road, Taichung 404, Taiwan (e-mail: [email protected]).
Copyright* 2012 by Lippincott Williams & Wilkins ISSN: 0025-7974
Health Insurance. This is a reformed universal insurance pro-gram that unified 13 insurance systems in March 1995 and covered more than 96% of all Taiwan residents in 1996. The study popu-lation comprised patients with newly diagnosed ESRD who re-ceived dialysis treatment between January 1, 1997, and December 31, 2006. Mortality was through December 31, 2006. PD and HD patients were identified by special treatment codes registered with and defined by the Taiwan National Health Insurance: treat-ment codes for HD were 58001C, 58014C, 58019C-58025C, and 58027C; and treatment codes for PD were 58002C, 58009A, 58009B, 58010A, 58010B, 58011A, 58011B, 58011AB, 58011C, 58012A, 58012B, 58017B, 58017C, and 58026C.
We identified 60,369 dialysis patients, and excluded pa-tients who had received kidney transplantation (n = 917). Of the remaining 59,452 patients, 3443 (5.8%) were on PD, 54,370 (91.5%) were on HD, 1278 (2.1%) switched from PD to HD, and 361 (0.6%) switched from HD to PD. All HD patients were in-center patients who received the dialysis treatment in hospitals or clinics.
Propensity Score Matching
Only 7.9% (4721/59,452) of the patients with ESRD had been treated with PD. Patients treated with PD were different
from patients treated with HD in terms of health status, partic-ularly comorbidities, which are important covariates associ-ated with survival. Thus, we established study cohorts that were frequency-matched with propensity scores. Based on patients treated only or initially with PD (n = 4721), we randomly se-lected 4721 patients treated with HD who were frequency-matched to PD patients by propensity score. The propensity score was estimated using a logistic regression model including covariates generally considered to be important factors associ-ated with survival.8,14,22,27,35These covariates included the
base-line information on age, sex, DM, hypertension, coronary artery disease, congestive heart failure, ischemic heart disease, cerebro-vascular disease, malignancy, and anemia. We identified all illnesses using the International Classification of Diseases, 9th Revision, Clinical Modification (ICD-9-CM). All baseline covariates were extracted from the same year the subjects were identified. Predictive performance of the model was assessed using the c-statistic.3Nearest-neighbor algorithm was applied to construct matched pairs, assuming that the proportion of 0.95 to 1.0 is perfect.2After the frequency-matching, an HD
cohort was formed. The 1639 patients switching between PD and HD were combined with the initial intent-to-treat group for data analysis before the HD cohort was selected.
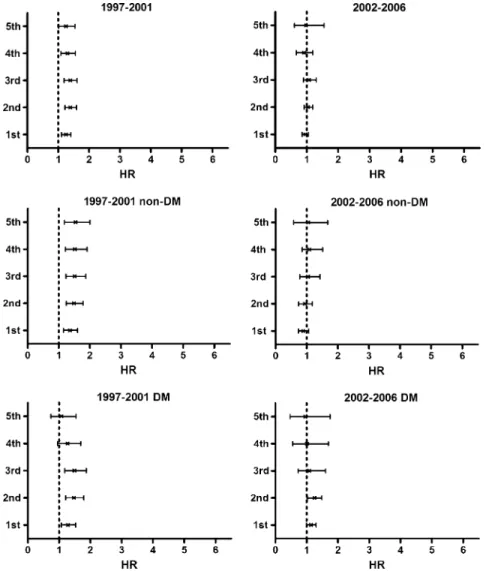
FIGURE 1. Peritoneal dialysis-to-hemodialysis hazard ratio (HR) for mortality by diabetes mellitus (DM) status in the periods 1997Y2001 and 2002Y2006.
Charlson Comorbidity Index Score
We estimated the Charlson Comorbidity Index score10 (CCI) for each patient using 4 weighted scores. Diseases with 1 point each were myocardial infarction, congestive heart failure, peripheral vascular disease, dementia, cerebrovascular disease, chronic pulmonary disease, connective tissue disease, peptic ulcer disease, and mild liver disease. Diseases with 2 points were hemiplegia, moderate or severe renal disease (which all patients had by definition), DM, any kind of tumor, leukemia, and lym-phoma. Moderate or severe liver disease scored 3 points, and metastatic solid tumor scored 4 points.
Statistical Analysis
Recent studies have suggested that age, time (duration of dialysis), and presence of comorbidities, particularly DM, are the factors affecting dialysis modality and mortality.22,23,35The
difference between the effectiveness of PD and HD treatments may decrease over time.23Based on the dates the patients were identified, we stratified the study subjects into 2 cohorts for the 5-year periods of 1997Y2001 and 2002Y2006 to observe the changes over time.23We also compared the mortality differences associated with demographic characteristics, CCI, and comorbid-ities between PD and HD patients based on intent-to-treat analysis. The sample distributions used the chi-square test to verify the matching efficiency. The group of PD patients combined
with those who switched from PD to HD was compared with the group of HD patients combined with those who switched from HD to PD. Entry age was defined as the age at the be-ginning of dialysis. Exit age was defined as the date of the last claim, death, loss to follow-up, or end of follow-up. Person-years of follow-up were determined by calculating the time between the date of the start of dialysis and the date of death, censor, or end of follow-up. Mortality rates were calculated and com-pared between PD and HD patients by demographic status, CCI, and baseline comorbidity for the 1997Y2001 cohort and the 2002Y2006 cohort.
We used the Cox proportional hazard method to estimate the PD-to-HD hazard ratio for mortality and the 95% confidence interval (CI), and examined the assumption using the Schoenfeld residuals test.15Further data analysis was performed to examine
the change in hazard ratios over time. The Cox proportional hazard method measured the age-specific (agedG40, 40Y65, and Q65 yr) and CCI-specific PD-to-HD hazard ratios for mortality. The analyses accounted for time dependency, depicting the an-nual PD-to-HD mortality hazard ratios, from the first year to the fifth year of follow-up, by DM status controlling for sex and age (Figure 1). The Kaplan-Meier model was used to compare sur-vival between patients on PD and those on HD by DM status (Figure 2). Additional effects of hypertension and cardiovas-cular disease, controlling for sex and age, were also measured
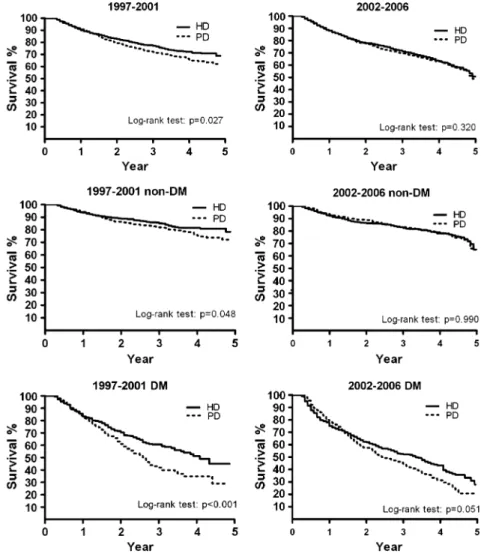
FIGURE 2. Kaplan-Meier survival curves for peritoneal dialysis (PD) and hemodialysis (HD) patients by diabetes mellitus (DM) status in the periods 1997Y2001 and 2002Y2006.
(Figure 3). The nearest-neighbor algorithm procedure was con-ducted using the STATA v. 8.1 software package (StataCorp, College Station, TX). Other analyses were conducted using the SAS v. 9.13 software package (SAS Institute Inc., Cary, NC).
Ethical Considerations
The insurance claims data were linked using scrambled patient identification to ensure confidentiality and to prevent ethical violations. The current study was exempted from full review by the institutional review board of the National Health Research Institute, Taiwan.
RESULTS
BASELINE CHARACTERISTICS OF THE STUDY POPULATION
There were no significant differences between PD and HD patients in both the 1997Y2001 and the 2002Y2006 cohorts for
distributions of sex, follow-up years, and income (Table 1). The mean age of HD patients was slightly, but significantly, higher than that of PD patients in the 2002Y2006 cohort. PD and HD patients were also similar in distributions of CCIs, and in most comorbidities, such as DM, hypertension, ischemic heart dis-ease, congestive heart disdis-ease, and cancer (Table 2). However, cerebrovascular disease was more prevalent in HD patients than in PD patients in the 2002Y2006 cohort, whereas congestive heart failure was more prevalent in PD patients than in HD patients in the 1997Y2001 cohort.
Hazard Ratios of PD Cohort Compared to HD Cohort
The overall mortality rate was slightly, but not significantly, lower in the HD cohort than in the PD cohort (11.7 vs. 12.0 per 100 person-years, respectively). The hazard ratio of PD vs. HD was 1.02; 95% CI, 0.96Y1.08 (Table 3). The multivariable Cox model-measured PD-to-HD hazard ratio declined from 1.33 (95% CI, 1.21Y1.46) in the 1997Y2001 cohort to 0.99 (95% CI, 0.87Y1.14) in the 2002Y2006 cohort. The stratified age-specific analysis shows that the PD-to-HD hazard ratio decreased with age in the 1997Y2001 cohort, whereas it increased with age in the 2002Y2006 cohort. The hazard ratio of PD patients in both cohorts vs. the HD patients in both cohorts increased with age from 0.85 (95% CI, 0.70Y0.97) among those aged less than 40 years to 1.20 (95% CI, 1.05Y1.31) among those aged 65 years and older.
There was little change in the death rate in PD patients aged less than 40 years in the different 5-year cohorts (3.7 per 100 person-years in 1997Y2001 vs. 4.0 per 100 person-years in 2002Y2006), whereas there was a large increase in the death rate of younger HD patients over time (3.2 per 100 person-years in 1997Y2001 vs. 10.2 per 100 person-years in 2002Y2006). By contrast, there was little change in the death rate in older HD patients (aged Q65 yr) in the different 5-year cohorts (26.7 per 100 person-years in 1997Y2001 vs. 27.7 per 100 person-years in 2002Y2006), whereas there was a large increase in the death rate of older PD patients over time (21.8 per 100 person-years in 1997Y2001 vs. 32.1 per 100 person-years in 2002Y2006).
The PD-to-HD hazard ratios by CCI in the 2002Y2006 co-hort were generally lower than those in the 1997Y2001 cohort (Table 4). For elderly patients, PD patients had a higher risk of death, except those with the CCI of 2 or less in the 2002Y2006 cohort.
PD-to-HD Hazard Ratios by Cohort Period and Comorbidity
In Figure 1 we compare the PD-to-HD hazard ratios for mortality of patients whose disease progressed from the first to fifth year based on the cohort period and DM status. The hazard ratios in the 1997Y2001 cohort were significantly higher for patients without DM (‘‘non-DM’’) in all 5 years or for DM patients in the first 3 years. The PD patients were generally no longer at higher risk of mortality compared with the HD patients in the 2002Y2006 cohort. The Kaplan-Meier analysis revealed that HD patients had better survival than PD patients in the 1997Y2001 period (Figure 2). The survival probabilities of PD and HD patients were similar in the 2002Y2006 period. The hazard ratio for PD versus HD patients increased annually with comorbidity (Figure 3). The effect was stronger for patients si-multaneously affected with DM, hypertension, and cardiovas-cular disease. For patients without these comorbidities, those on PD had better survival than those on HD in the 2002Y2006 FIGURE 3. Peritoneal dialysis-to-hemodialysis (PD-to-HD) hazard
ratio for mortality by comorbidity of diabetes mellitus (DM), hypertension (HP), and cardiovascular disease (CVD) for patients in the 1997Y2001 cohort and 2002Y2006 cohort (*p for trendG0.05).
cohort; the beneficial effect was significant in the first year (hazard ratio, 0.62; 95% CI, 0.44Y0.80).
DISCUSSION
In the current study, fewer than 10% (4721/59,452; 7.9%) of ESRD patients had been treated with PD, and approxi-mately one-third of these patients switched to HD treatment. This study was conducted based on the number of available patients treated with PD. Thus, our study cohorts involved propensity score-matched patients treated with PD and HD and all avail-able patients who switched treatment, with 78.0% (1278/1639)
switching from PD to HD. Although there was a higher hazard ratio for mortality for patients treated with PD compared to those treated with HD in the 1997Y2001 cohort, this was not observed in the 2002Y2006 cohort. In the combined group for the 10 years between 1997 and 2006, there was no difference in survival be-tween patients treated with PD or HD. However, younger pa-tients who received PD experienced better survival than younger patients who received HD; this was especially true among those aged younger than 40 years.
These age-specific results are consistent with results of a Dutch study20 that found that PD is associated with greater
survival of patients aged in their 40s and 50s, particularly those
TABLE 1. Sociodemographic Characteristics of PD and HD Patients in 2 Different 5-Year Cohorts
1997Y2001 (%) 2002Y2006 (%) Combined (%)
PD HD PD HD PD HD Variable (n = 2134) (n = 2107) P* (n = 2587) (n = 2614) P* (n = 4721) (n = 4721) P* Sex, male 39.7 38.9 0.46 41.2 39.8 0.10 40.5 39.4 0.48 Age, yr G40 25.8 23.5 0.23 20.1 17.6 0.08 22.5 21.8 0.21 40Y64 52.8 54.5 55.6 56.4 54.3 54.7 65+ 21.4 22.0 24.3 26.0 22.9 23.5 MeanT SD, yr 50.9T 16.4 51.6T 15.6 0.18 53.0T 16.0 54.0T 15.2 0.03 52.3T 16.1 52.7T 15.6 0.05 Follow-up, yr (meanT SD) 4.2T 2.3 4.2T 2.3 0.14 3.0T 1.4 3.0T 1.4 0.20 3.5T 2.3 3.5T 2.4 0.31 Income, NTD† 928,800 33.9 32.9 0.11 32.9 31.7 0.23 33.5 32.1 0.43 19,200Y28,800 40.5 41.2 42.1 43.5 41.2 42.3 G19,200 25.6 25.9 25.0 24.8 25.3 25.6
*Chi-square test for PD and HD patients.
†NTD = New Taiwan Dollars; 1 US dollar is about 30Y34 NTD.
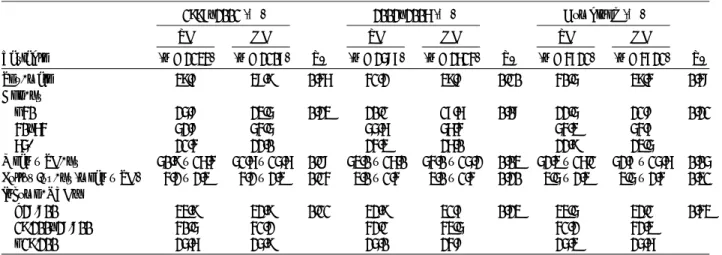
TABLE 2. Comorbidity of PD and HD Patients in 2 Different Cohorts
1997Y2001 (%) 2002Y2006 (%) Combined (%)
PD HD PD HD PD HD Variable (n = 2134) (n = 2107) P* (n = 2587) (n = 2614) P* (n = 4721) (n = 4721) P* CCI† e2 26.2 26.3 0.66 15.8 15.5 0.07 20.5 20.3 0.11 3Y5 32.4 32.4 32.9 29.9 32.7 31.0 6Y9 27.1 26.4 31.7 34.9 29.6 31.1 10+ 14.3 14.9 19.6 19.8 17.2 17.6 Diabetes 31.7 33.4 0.08 35.0 37.1 0.05 33.5 34.7 0.10 Hypertension 72.8 72.9 0.44 74.4 72.2 0.08 74.1 72.5 0.14 Cerebrovascular disease 7.2 7.5 0.50 14.7 17.2 0.01 11.3 12.9 0.14 Ischemic heart disease 13.8 12.7 0.14 23.8 24.7 0.22 19.3 19.2 0.86 Congestive heart failure 11.4 9.2 0.03 18.9 19.5 0.26 15.5 14.9 0.34 Anemia 36.6 35.0 0.14 38.1 37.3 0.23 37.5 36.3 0.45 Cancer 4.6 4.5 0.69 7.3 8.1 0.13 6.1 6.5 0.53 Stomach malignancy 0.1 0.1 0.97 0.2 0.2 0.83 0.1 0.2 0.83 Kidney malignancy 1.1 1.1 0.86 1.2 1.5 0.26 1.1 61.3 0.37 Bladder malignancy 0.5 0.7 0.54 0.7 1.0 0.13 0.6 30.8 0.25
Abbreviations: CCI = Charlson Comorbidity Index score. *Chi-square test for PD and HD patients.
in their 40s in the first 15 months of treatment. This beneficial effect begins to disappear for diabetic patients in their 60s. The results of the beneficial effect of PD in relation to the length of treatment are also consistent with the Dutch study,19but only for nondiabetic young patients. The mortality advantage of PD treatment also appears in young patients during the 90Y365 day treatment period in the Australia and New Zealand Dialysis and Transplant Registry.22 In a United States propensity-matched comparison, Weinhandl et al35 found that PD improved the survival rate of patients agedG65 years, particularly those without comorbidities. The Dutch study did not use a propensity-matched
design,19whereas the studies from the United States and from Australia and New Zealand did.22,35
Consistent with studies in Western populations, we found that PD is associated with lower mortality for younger patients and those with a lower number of comorbid conditions16,34in the first year17,19,22,25,31,34or the first 2 years4,14,18,28after the start of therapy. Diabetes is a well-known comorbid condition in patients with ESRD.1,4,16,19,21,25,29,32,34 Cross-classifying DM and age or sex reveals that mortality risk was significantly lower in PD patients than in HD patients in younger groups without DM. The opposite effect was observed in elderly DM
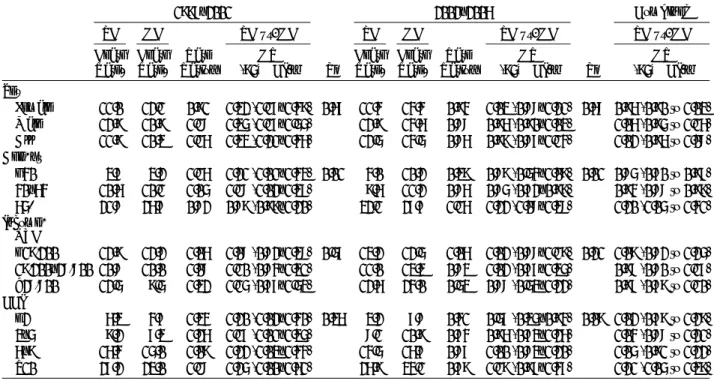
TABLE 3. Mortality Rates of PD and HD Patients and Multivariable Cox Model-Measured PD-to-HD Hazard Ratios in 2 Different Cohorts
1997Y2001 2002Y2006 Combined PD HD PD vs. HD PD HD PD vs. HD PD vs. HD Death Rate* Death Rate* Rate Ratio† HR (95% CI)‡ P§ Death Rate* Death Rate* Rate Ratio† HR (95% CI)‡ P§ HR (95% CI)‡ Sex
Female 11.0 12.1 0.91 1.32 (1.17Y1.49) 0.67 11.4 14.4 0.94 1.03 (0.88Y1.21) 0.68 0.96 (0.90 to 1.03) Male 12.9 10.9 1.18 1.35 (1.17Y1.55) 12.9 14.6 0.88 0.96 (0.90Y1.03) 1.06 (0.95 to 1.16) All 11.9 10.3 1.16 1.33 (1.21Y1.46) 12.5 14.5 0.86 0.99 (0.87Y1.14) 1.02 (0.96 to 1.08) Age, yr
G40 3.7 3.2 1.16 1.21 (1.01Y1.43) 0.01 4.0 10.2 0.39 0.89 (0.54Y1.09) 0.01 0.85 (0.70 to 0.97) 40Y64 10.6 10.1 1.05 1.18 (1.02Y1.37) 9.6 11.2 0.86 0.85 (0.72Y0.99) 0.94 (0.88 to 0.99) 65+ 21.8 26.7 0.82 0.89 (0.99Y1.20) 32.1 27.7 1.16 1.22 (1.08Y1.38) 1.20 (1.05 to 1.41) Income,
NTD
G19,200 12.9 12.2 1.06 1.08 (0.82Y1.38) 0.57 13.2 12.5 1.06 1.02 (0.88Y1.19) 0.21 1.09 (0.82 to 1.25) 19,200Y28,800 10.8 10.0 1.08 1.10 (0.84Y1.31) 11.0 13.3 0.83 1.02 (0.77Y1.35) 0.98 (0.80 to 1.17) 928,800 12.5 9.5 1.32 1.15 (0.77Y1.53) 12.6 24.0 0.53 0.88 (0.53Y1.22) 0.97 (0.79 to 1.10) CCI
e2 6.3 4.7 1.34 1.20 (1.02Y1.40) 0.36 3.2 7.8 0.41 0.57 (0.35Y0.94) 0.09 1.02 (0.79 to 1.29) 3Y5 9.2 7.3 1.26 1.17 (1.01Y1.35) 8.1 10.9 0.74 0.96 (0.73Y1.26) 1.04 (0.88 to 1.21) 6Y9 16.4 15.0 1.09 1.22 (1.03Y1.44) 14.5 16.7 0.87 1.00 (0.83Y1.20) 1.05 (0.91 to 1.22) Q10 27.2 23.0 1.18 1.25 (1.00Y1.61) 26.9 34.1 0.79 1.19 (0.97Y1.47) 1.21 (1.05 to 1.39)
Abbreviations: See previous tables. HR = hazard ratio. *Per 100 person-years.
†PD vs. HD.
‡Level-specific hazard ratio. §P for interaction.
TABLE 4. Multivariable Cox Model-Measured PD-to-HD Hazard Ratios by CCI and Age in 2 Different Cohorts 1997Y2001 2002Y2006
G40 yr 40Y65 yr Q65 yr G40 yr 40Y65 yr Q65 yr CCI HR (95% CI) HR (95% CI) HR (95% CI) HR (95% CI) HR (95% CI) HR (95% CI) 2 0.93 (0.57Y1.51) 1.95 (1.41Y2.71)* 1.21 (0.76Y1.91) 0.96 (0.41Y2.23) 0.50 (0.24Y1.03) 0.48 (0.12Y1.33) 3Y5 0.92 (0.56Y1.51) 1.45 (1.13Y1.85)* 1.36 (1.01Y1.83)* 0.81 (0.57Y1.85) 0.82 (0.56Y1.20) 1.56 (0.98Y2.49) 6Y9 0.79 (0.39Y1.60) 1.18 (0.95Y1.48) 1.45 (1.10Y1.90)* 0.71 (0.49Y1.74) 0.74 (0.55Y0.99)* 1.34 (1.03Y1.74)* 10+ 0.89 (0.31Y2.56) 1.22 (0.92Y1.62) 1.47 (1.15Y1.88)* 1.30 (0.37Y2.51) 0.94 (0.65Y1.35) 1.36 (1.05Y1.75)*
Abbreviations: See previous tables.
Note: All groups are adjusted for sex, age, year, and income. *PG 0.05.
patients. However, previous registry studies in the Netherlands and Canada reported no significant difference in survival rate between patients undergoing PD and HD among older diabetic patients.14,28The Canadian study comprised 25% DM patients
with 10 years of follow-up, whereas the Netherlands study had 19% DM patients also with 10 years of follow-up. In the current study we followed patients for 1Y10 years, and nearly 35% of dialysis patients were diabetic at baseline. This step allowed for more reliable statistical power to compare the mortality risk between PD and HD treatment in elderly patients with DM. Diabetes was also prevalent in dialysis patients in the United States registry studies (36%Y39%).32,34The PD patients in the
United States studies had higher mortality than HD patients in the older group, similar to our observations.
We further compared the results of the Cox model pro-pensity score-matched and -unmatched analyses and found no significant difference in the overall PD-to-HD mortality (hazard ratio, 1.02 and 0.98, respectively) (data not shown for un-matched design). In the un-matched design, the treatment effec-tiveness differed among patient subgroups stratified by age, CCI, and DM status. However, the unmatched model yielded a higher PD-to-HD mortality risk than the matched model among older patient subgroups, and among those with DM and other comorbidities. The possible reason for this finding is the dis-parity in inclination toward treatment modality among patient subgroups. Patients with older age or more comorbidities tend to choose HD as their initial dialysis modality, resulting in an associated greater mortality risk. This finding is consistent with that of other studies.28
In the current study, the discrepancy between PD and HD treatments progressively decreased over time in the second 5<year cohort. The Kaplan-Meier model compared the survival trends of PD and HD patients, indicating that the survival dif-ferences for elderly patients or patients with DM also progres-sively became attenuated in the 2002Y2006 period compared with the 1997Y2001 period. This change can be observed in the mortality by CCI. The mortality rates in PD patients changed little in the 2002Y2006 cohort compared with those in the 1997Y2001 cohort. The corresponding mortality in HD patients increased in the 2002Y2006 cohort. The discrepancy was greater in patients with low CCIs. Further analysis shows the difference was mainly contributed by the younger patients, indicating im-provement in relative risk. These results demonstrate a trend similar to the findings in the study reported by Mehrotra et al.23 Patients treated initially with HD or PD may have similar out-comes over time.
The strength of the present study is the use of 2 sets of 5<year cohorts obtained from representative population-based data on patients undergoing dialysis to observe the mortality trend over the follow-up period. The PD and HD cohorts were homogenous in sociodemographic characteristics and comorbid medical conditions at the baseline because of the propensity score-matched design, which reduces the selection bias of sam-ples and potential confounding effect.3,9This observation sug-gests that the use of the design strengthens the validity of PD-to-HD hazard measures. To the best of our knowledge, the present study is the only cohort study in an Asian population with a high prevalence of ESRD using a propensity score-matched design to compare survival between PD and HD patients in 2 consecutive 5-year cohorts.
Limitations
The current study has a few limitations. First, we used a retrospective study to ascertain information on causes and effects from existing claims data. Information on clinical tests,
anthro-pometric and laboratory examinations, and health behavior of patients, to name a few things, was not available in the claims data. Thus, we were unable to use laboratory markers, such as hemoglobin or albumin levels, to predict mortality. However, the existing claims data enabled us to perform a natural history study on other comorbidities that may be associated with the effec-tiveness of PD and HD.
As a second limitation, we were unable to link some non-hospital deaths, thus we had to define the date of cancellation of health insurance as the date of death. Our small subset of data linking the real death registration shows that, on average, most cancellation dates were within 1 week of the real death registration for dialysis patients. Third, patients who had swit-ched between PD and HD in the present study were more likely PD patients than HD patients. Therefore, the outcome may have underestimated the benefit of PD.30Finally, the HD patients se-lected in this study were those who matched with the propensity score of PD patients. The selected sample may differ from the general population of HD patients in some characteristics. Nev-ertheless, we selected PD patients and HD patients with similar characteristics to avoid selection bias.
Conclusion
ESRD patients treated with PD had greater overall risk of death than patients treated with HD in the first 5-year period of the current study. No difference between PD and HD was ob-served in the second 5-year period of this study or in the 10-year combined period. Younger ESRD patients with low CCI or without DM benefited most from PD treatment. However, this beneficial effect may last for only a limited period. In summary, in the current study in an Asian population, no significant sur-vival differences were noted between propensity score-matched PD and HD patients. The selection of a dialysis modality must be tailored to the individual patient. Studies in which patients who are appropriate for either modality are randomly assigned to HD or PD may provide helpful information to clinicians and patients.
REFERENCES
1. Antolin A, Miguel A, Perez J, Gomez C, Zurriaga O, Blasco MJ, Garcia R. Analysis of survival in dialysis: hemodialysis versus peritoneal dialysis and the significance of comorbidity. Nefrologia. 2002;22:253Y261.
2. Ash AS, Shwartz M. Evaluating the performance of risk-adjustment methods: dichotomous outcomes. In: Iezzoni LI, ed. Risk Adjustment for Measuring Health Care Outcomes. 2nd ed, Chicago: Health Administration Press; 1997:471Y516.
3. Brookhart MA, Schneeweiss S, Rothman KJ, Glynn RJ, Avorn J, Sturmer T. Variable selection for propensity score models. Am J Epidemiol. 2006;163:1149Y1156.
4. Collins AJ, Hao W, Xia H, Ebben JP, Everson SE, Constantini EG, Ma JZ. Mortality risks of peritoneal dialysis and hemodialysis. Am J Kidney Dis. 1999;34:1065Y1074.
5. Collins AJ, Kasiske B, Herzog C, Chen SC, Everson S, Constantini E, Grimm R, McBean M, Xue J, Chavers B, Matas A, Manning W, Louis T, Pan W, Liu J, Li S, Roberts T, Dalleska F, Snyder J, Ebben J, Frazier E, Sheets D, Johnson R, Li S, Dunning S, Berrini D, Guo H, Solid C, Arko C, Daniels F, Wang X, Forrest B, Gilbertson D, St Peter W, Frederick P, Eggers P, Agodoa L. USRDS 2006 Annual Data Report: Atlas of End-Stage Renal Disease in the United States. Bethesda, MD: National Institutes of Health, National Institute of Diabetes and Digestive and Kidney Diseases; 2006;12:e230. 6. Collins AJ, Kasiske B, Herzog C, Chen SC, Everson S, Constantini E,
Louis T, Pan W, Liu J, Li S, Roberts T, Dalleska F, Snyder J, Ebben J, Frazier E, Sheets D, Johnson R, Li S, Dunning S, Berrini D, Guo H, Solid C, Arko C, Daniels F, Wang X, Forrest B, Gilbertson D, St Peter W, Frederick P, Eggers P, Agodoa L. USRDS 2004 Annual Data Report: Atlas of End-Stage Renal Disease in the United States. Bethesda, MD: National Institutes of Health, National Institute of Diabetes and Digestive and Kidney Diseases; 2004.
7. Collins AJ, Kasiske B, Herzog C, Chen SC, Everson S, Constantini E, Grimm R, McBean M, Xue J, Chavers B, Matas A, Manning W, Louis T, Pan W, Liu J, Li S, Roberts T, Dalleska F, Snyder J, Ebben J, Frazier E, Sheets D, Johnson R, Li S, Dunning S, Berrini D, Guo H, Solid C, Arko C, Daniels F, Wang X, Forrest B, Gilbertson D, St Peter W, Frederick P, Eggers P, Agodoa L. USRDS 2008 Annual Data Report: Atlas of End-Stage Renal Disease in the United States. Bethesda, MD: National Institutes of Health, National Institute of Diabetes and Digestive and Kidney Diseases; 2008;12:e193. 8. D’Agostino RB Jr. Propensity score methods for bias reduction
in the comparison of a treatment to a non-randomized control group. Stat Med. 1998;17:2265Y2281.
9. Foley RN. Comparing the incomparable: hemodialysis versus peritoneal dialysis in observational studies. Perit Dial Int. 2004;24:217Y221. 10. Fried L, Bernardini J, Piraino B. Charlson comorbidity index as a
predictor of outcomes in incident peritoneal dialysis patients. Am J Kidney Dis. 2001;37:337Y342.
11. Ganesh SK, Hulbert-Shearon T, Port FK, Eagle K, Stack AG. Mortality differences by dialysis modality among incident ESRD patients with and without coronary artery disease. J Am Soc Nephrol. 2003;14:415Y424.
12. Gokal R, Figueras M, Olle A, Rovira J, Badia X. Outcomes in peritoneal dialysis and haemodialysisVa comparative assessment of survival and quality of life. Nephrol Dial Transplant. 1999;14(Suppl 6):24Y30.
13. Grassmann A, Gioberge S, Moeller S, Brown G. ESRD patients in 2004: global overview of patient numbers, treatment modalities and associated trends. Nephrol Dial Transplant. 2005;20:2587Y2593. 14. Heaf JG, Lokkegaard H, Madsen M. Initial survival advantage of
peritoneal dialysis relative to haemodialysis. Nephrol Dial Transplant. 2002;17:112Y117.
15. Hosmer DW Jr, Lemeshow S, May S. Applied Survival Analysis: Regression Modeling of Time to Event Data. 2nd ed. New York: John Wiley; 2008:196Y216.
16. Huang CC, Cheng KF, Wu HD. Survival analysis: comparing peritoneal dialysis and hemodialysis in Taiwan. Perit Dial Int. 2008;28(Suppl 3):S15YS20.
17. Jaar BG, Coresh J, Plantinga LC, Fink NE, Klag MJ, Levey AS, Levin NW, Sadler JH, Kliger A, Powe NR. Comparing the risk for death with peritoneal dialysis and hemodialysis in a national cohort of patients with chronic kidney disease. Ann Intern Med. 2005;143:174Y183.
18. Keshaviah P, Collins AJ, Ma JZ, Churchill DN, Thorpe KE. Survival comparison between hemodialysis and peritoneal dialysis based on matched doses of delivered therapy. J Am Soc Nephrol. 2002;13(Suppl 1):S48YS52.
19. Liem YS, Wong JB, Hunink MG, de Charro FT, Winkelmayer WC. Comparison of hemodialysis and peritoneal dialysis survival in The Netherlands. Kidney Int. 2007;71:153Y158.
20. Liem YS, Wong JB, Hunink MM, de Charro FT, Winkelmayer WC. Propensity scores in the presence of effect modification: a case study using the comparison of mortality on hemodialysis versus peritoneal dialysis. Emerg Themes Epidemiol. 2001;7:e1.
21. Maiorca R, Cancarini GC, Brunori G, Zubani R, Camerini C, Manili L, Movilli E. Comparison of long-term survival between hemodialysis and peritoneal dialysis. Adv Perit Dial. 1996;12:79Y88.
22. McDonald SP, Marshall MR, Johnson DW, Polkinghorne KR. Relationship between dialysis modality and mortality. J Am Soc Nephrol. 2009;20:155Y163.
23. Mehrotra R, Chiu YW, Kalantar-Zadeh K, Bargman J, Vonesh E. Similar outcomes with hemodialysis and peritoneal dialysis in patients with end-stage renal disease. Arch Intern Med. 2011;171:110Y118. 24. Muller-Krebs S, Kihm LP, Zeier B, Gross ML, Deppisch R,
Wieslander A, Henle T, Penndorf I, Oh J, Reiser J, Nawroth PP, Zeier M, Schwenger V. Renal toxicity mediated by glucose degradation products in a rat model of advanced renal failure. Eur J Clin Invest. 2008;38:296Y305.
25. Murphy SW, Foley RN, Barrett BJ, Kent GM, Morgan J, Barre P, Campbell P, Fine A, Goldstein MB, Handa SP, Jindal KK, Levin A, Mandin H, Muirhead N, Richardson RM, Parfrey PS. Comparative mortality of hemodialysis and peritoneal dialysis in Canada. Kidney Int. 2000;57:1720Y1726.
26. Rennke HG, Denker BM. Renal Pathophysiology: The Essentials. 2nd ed. Philadelphia: Lippincott Williams & Wilkins; 2007:e365. 27. Rubin DB. Estimating causal effects from large data sets using
propensity scores. Ann Intern Med. 1997;127(8 Pt 2):757Y763. 28. Schaubel DE, Morrison HI, Fenton SS. Comparing mortality rates on
CAPD/CCPD and hemodialysis. The Canadian experience: fact or fiction? Perit Dial Int. 1998;18:478Y484.
29. Selgas R, Cirugeda A, Fernandez-Perpen A, Sanchez-Tomero JA, Barril G, Alvarez V, Bajo MA. Comparisons of hemodialysis and CAPD in patients over 65 years of age: a meta-analysis. Int Urol Nephrol. 2001;33:259Y264.
30. Shih YC, Guo A, Just PM, Mujais S. Impact of initial dialysis modality and modality switches on Medicare expenditures of end-stage renal disease patients. Kidney Int. 2005;68:319Y329.
31. Song YS, Jung H, Shim J, Oh C, Shin GT, Kim H. Survival analysis of Korean end-stage renal disease patients according to renal replacement therapy in a single center. J Korean Med Sci. 2007;22:81Y88.
32. Stack AG, Molony DA, Rahman NS, Dosekun A, Murthy B. Impact of dialysis modality on survival of new ESRD patients with congestive heart failure in the United States. Kidney Int. 2003;64:1071Y1079. 33. Stack AG, Murthy BV, Molony DA. Survival differences between
peritoneal dialysis and hemodialysis among ‘‘large’’ ESRD patients in the United States. Kidney Int. 2004;65:2398Y2408.
34. Vonesh EF, Snyder JJ, Foley RN, Collins AJ. The differential impact of risk factors on mortality in hemodialysis and peritoneal dialysis. Kidney Int. 2004;66:2389Y2401.
35. Weinhandl ED, Foley RN, Gilbertson DT, Arneson TJ, Snyder JJ, Collins AJ. Propensity-matched mortality comparison of incident hemodialysis and peritoneal dialysis patients. J Am Soc Nephrol. 2010;21:499Y506.