Letter
https://doi.org/10.1038/s41586-018-0475-6GAPDH inhibits intracellular pathways during
starvation for cellular energy homeostasis
Jia-Shu Yang1, Jia-Wei Hsu1, Seung-Yeol Park1, Jian Li1, William M. Oldham2, Galina V. Beznoussenko3, Alexander A. Mironov3, Joseph Loscalzo4 & Victor W. Hsu1*
Starvation poses a fundamental challenge to cell survival. Whereas the role of autophagy in promoting energy homeostasis in this setting has been extensively characterized1, other mechanisms
are less well understood. Here we reveal that glyceraldehyde 3-phosphate dehydrogenase (GAPDH) inhibits coat protein I (COPI) transport by targeting a GTPase-activating protein (GAP) towards ADP-ribosylation factor 1 (ARF1) to suppress COPI vesicle fission. GAPDH inhibits multiple other transport pathways, also by targeting ARF GAPs. Further characterization suggests that this broad inhibition is activated by the cell during starvation to reduce energy consumption. These findings reveal a remarkable level of coordination among the intracellular transport pathways that underlies a critical mechanism of cellular energy homeostasis.
The activation of ADP-ribosylation factor (ARF) small GTPases initiates vesicular transport by recruiting coat proteins to intracellular membrane compartments for vesicle formation2. In the case of vesicle formation by the COPI complex, the GAP that de-activates ARF1— known as ARFGAP1—is also an ARF effector, acting as a coat com-ponent3,4. To gain further insight into how ARFGAP1 acts in COPI transport, we sought to identify new interacting proteins. By incubat-ing ARFGAP1 with cytosol in a pull-down experiment, we identified GAPDH as one such protein (Extended Data Table 1). Although it is well known for acting in glycolysis, GAPDH is also known to have multiple non-glycolytic roles5. Therefore, to investigate whether it has a role in COPI transport, we initially performed a COPI transport assay as described6–8. In cells treated with small interfering RNA (siRNA) against GAPDH, we observed enhanced COPI transport (Fig. 1a, Extended Data Fig. 1a). Targeting specificity was confirmed by a rescue experiment (Fig. 1a, Extended Data Fig. 1b), and by treatment with an unrelated siRNA sequence (Extended Data Fig. 1c). The siRNA treat-ments were limited to two days to maintain cell viability (Extended Data Fig. 1d). Consistent with the effect of reducing GAPDH level, GAPDH overexpression had the opposite effect of inhibiting COPI transport (Fig. 1b, Extended Data Fig. 1e). The expression levels of GAPDH in the different treatment conditions were also documented (Extended Data Fig. 1f). These initial results suggested that GAPDH acts as a negative regulator of COPI transport.
We next investigated COPI vesicle formation from Golgi membrane using a reconstitution system6–8. The addition of purified GAPDH to this in vitro assay inhibited vesicle formation (Fig. 1c). This effect was specific to GAPDH, as several other metabolic enzymes did not have a similar effect (Fig. 1c). We also performed electron microscopy, and found that GAPDH induced the accumulation of buds with constricted necks on the Golgi membrane (Fig. 1d). These results suggested that GAPDH inhibits COPI transport by targeting the fission stage of vesicle formation.
We next found that GAPDH binds directly to ARFGAP1 (Extended Data Fig. 1g) and interacts with ARFGAP1 in cells (Extended Data Fig. 1h). Thus, we performed a GAP assay, which showed that GAPDH—but not other metabolic enzymes—inhibits the catalytic
activity of ARFGAP1 (Fig. 1e). Complementing this finding, we found that a mutant ARFGAP1 that is deficient in catalytic activity could not promote COPI vesicle fission (Fig. 1f). ARFGAP1 also acts as a coat component by promoting coat polymerization and cargo sorting3,4. However, GAPDH did not affect the interaction of ARFGAP1 with coatomer (Extended Data Fig. 1i) or with COPI cargo proteins (Extended Data Fig. 1j). Therefore, we concluded that GAPDH inhibits COPI vesicle fission by targeting the GAP activity of ARFGAP1. This role of GAPDH did not require its catalytic activity (Supplementary Information, and Extended Data Fig. 1k, l).
We then sought to understand how GAPDH could be recruited to the Golgi to inhibit COPI transport. Prompted by the observation that starvation redistributes GAPDH from the cytosol to the nucleus9, we performed a subcellular fractionation experiment and found that starvation also redistributed GAPDH to cytoplasmic membranes (Extended Data Fig. 2a). Confocal microscopy revealed that this redis-tribution involved the Golgi (Extended Data Fig. 2b), the trans-Golgi network (TGN) (Extended Data Fig. 2c), early endosomes (Extended Data Fig. 2d) and the late endocytic compartments (Extended Data Fig. 2e). We also detected a pool of GAPDH at the endoplasmic retic-ulum (ER), but the level of this ER pool was not affected by starvation (Extended Data Fig. 2f).
We next examined whether GAPDH also inhibits other intracellular pathways. Performing a quantitative screen of the major pathways, as previously described10, we found that siRNA against GAPDH did not affect transport from the ER to the Golgi (Fig. 2a, Extended Data Fig. 2g), but enhanced transport from the Golgi to the plasma mem-brane (Fig. 2b, Extended Data Fig. 2h). All three major endocytic routes were also enhanced, including endocytic recycling (Fig. 2c, Extended Data Fig. 2i), endocytic transport to the Golgi (Fig. 2d, Extended Data Fig. 2j) and endocytic transport to the lysosome (Fig. 2e, Extended Data Fig. 2k). Fluid-phase uptake was also enhanced by the siRNA treatment against GAPDH (Fig. 2f, Extended Data Fig. 2l). However, clathrin- mediated endocytosis (Fig. 2g) and two types of non-clathrin endo-cytosis (Extended Data Fig. 2m, n) were not affected. Moreover, similar to the case of COPI transport, we found that GAPDH overexpression had the opposite effect of inhibiting the affected pathways (Fig. 2a–g). The specificity of our detection of GAPDH and organelle markers were also confirmed (Supplementary Information and Extended Data Figs. 2o–r, 3a–l).
We then examined whether GAPDH inhibits these additional path-ways also by targeting ARF GAPs. ARF6 and its cognate GAP, ACAP1, act in endocytic recycling11; GAPDH inhibited the GAP activity of ACAP1 towards ARF6 (Fig. 2h). ARF1 and its cognate GAP, AGAP1, act in endocytic transport to the lysosome12; GAPDH also inhibited the GAP activity of AGAP1 towards ARF1 (Fig. 2i). Moreover, other meta-bolic enzymes did not have similar effects (Extended Data Fig. 3m, n). In the case of exit from the ER, Sec23p is the cognate GAP for the ARF-like small GTPase Sar1p13. Consistent with our finding above that GAPDH does not inhibit this pathway, we found that GAPDH also did 1Division of Rheumatology, Immunology and Allergy, Department of Medicine, Brigham and Women’s Hospital and Harvard Medical School, Boston, MA, USA. 2Division of Pulmonary and Critical Care Medicine, Department of Medicine, Brigham and Women’s Hospital and Harvard Medical School, Boston, MA, USA. 3The FIRC Institute of Molecular Oncology, Milan, Italy. 4Cardiovascular Division, Department of Medicine, Brigham and Women’s Hospital and Harvard Medical School, Boston, MA, USA. *e-mail: [email protected]
1 3 S e P t e M B e r 2 0 1 8 | V O L 5 6 1 | N A t U r e | 2 6 3 © 2018 Springer Nature Limited. All rights reserved.
Letter
reSeArCH
not inhibit the GAP activity of Sec23p towards Sar1p (Fig. 2j). GAPDH bound directly to ACAP1 (Extended Data Fig. 3o) and AGAP1 (Extended Data Fig. 3p), but not to Sec23p (Extended Data Fig. 3q). Therefore, these results suggest that GAPDH inhibits the transport
pathways by targeting ARF GAPs. Moreover, led by the consideration that the catalytic domain in ARFGAP1 is conserved across many ARF GAPs, but not for Sec23p, we found that GAPDH bound to the catalytic domain of ARFGAP1 (Extended Data Fig. 3r), which suggests why GAPDH does not interact with Sec23p, and therefore does not inhibit exit from the ER. We also examined transferrin endocytosis and the results further supported that GAPDH inhibits the transport pathways by targeting ARF GAPs (Supplementary Information and Extended Data Figs. 3s–v).
We then examined the effect of starvation on the transport pathways. Cells were incubated with a general starvation medium (Fig. 3a–h), which lacks glucose and amino acids, Hank’s medium (Extended Data Fig. 4a–h), which lacks amino acids and serum, or media that lack either glucose (Extended Data Fig. 4i–p) or amino acids (Extended Data Fig. 4q–x). In all cases, the same pathways were inhibited, and nota-bly, these effects were reversed by siRNA against GAPDH (Fig. 3a–h and Extended Data Fig. 4a–x).
We then considered that vesicular transport consumes substan-tial cellular energy. We therefore hypothesized that the GAPDH-mediated transport inhibition enables the cell to conserve energy during starvation. In support of this hypothesis, we found that siRNA against GAPDH exacerbated the starvation-induced reduction in total ATP level, whereas GAPDH overexpression had the opposite effect (Fig. 3i, Extended Data Fig. 5a–c). Moreover, siRNA against GAPDH enhanced starvation-induced cell death, whereas GAPDH overexpres-sion had the opposite effect (Fig. 3j). We ruled out that these effects could be attributed to the conventional role of GAPDH in glycolysis (Supplementary Information and Extended Data Fig. 5d–f). We also confirmed the key findings regarding how GAPDH acts in another cell type (Supplementary Information and Extended Data Fig. 5g–x).
We pursued another line of investigation that further supported GAPDH-mediated transport inhibition acting in energy homeostasis. AMPK has a central role in energy homeostasis, acting by sensing an energy deficit and then coordinating a wide range of cellular processes to restore energy homeostasis14. Treating cells with siRNA against
AMPKα1 (also known as PRKAA1), we found that starvation could
no longer inhibit the transport pathways (Extended Data Fig. 6a–h); this was confirmed with a rescue experiment (Extended Data Fig. 6i, j), and with treatment using a different siRNA sequence (Extended Data Fig. 6k–s). Complementing these findings, we found that siRNA against
a 0 20 40 60 80 100 0 20 40 60
VSVG–KDELR/giantin colocalization (%) VSVG–KDELR/giantin colocalization (%) Time (min)
No treatment
GAPDH siRNA
GAPDH siRNA + WT GAPDH* **
0 20 40 60 80 100 0 20 40 60 Time (min) No treatment GAPDH overexpression b * c d + – + GAPDH – – + –++++ + * e f * */** * ARFGAP10 5 10 15 20 25
GAP activity (AU
) 0 50 100 Vesicle formation WT R50K 0 100 200
Vesicles per mesh
0 100 200
ARFGAP1
Vesicles per mesh
None GAPDH GAPD H GDH GDH LDH LDH GPDH GPD H
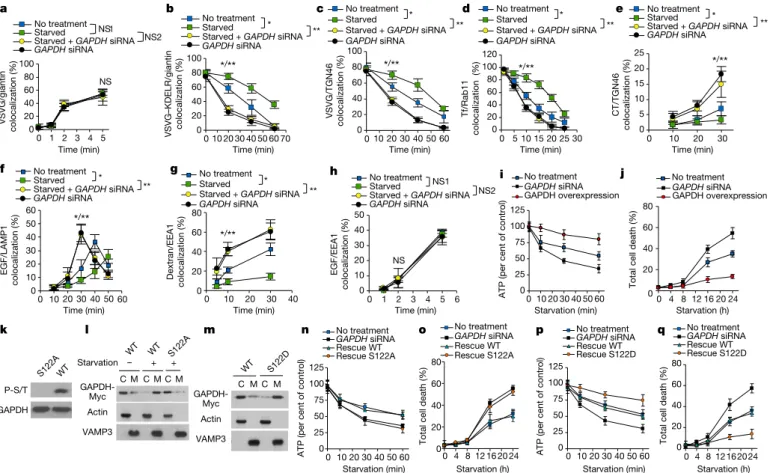
Fig. 1 | GAPDH inhibits COPI vesicle fission by targeting the GAP activity of ARFGAP1. a, b, COPI transport in HeLa cells. *P = 9.8 × 10⁻⁷, **P = 9.2 × 10⁻⁹ (a); *P = 6.8 × 10⁻⁶ (b). c, Vesicle reconstitution system using Golgi membrane and purified proteins, with added metabolic enzymes as indicated. GDH, glutamate dehydrogenase; LDH, lactate dehydrogenase; GPDH, glycerol-3-phosphate dehydrogenase. d, Vesicle reconstitution system, with added purified proteins as indicated. Left, electron microscopy image of a Golgi membrane. Right, vesicle quantification. *P = 8.9 × 10⁻⁷. e, GAP assay using ARF1 and ARFGAP1, with added metabolic enzymes as indicated. f, Vesicle reconstitution system, with added ARFGAP1 form as indicated. Left, electron microscopy image of Golgi membrane. Right, vesicle quantification. *P = 6.2 × 10⁻⁶. In
a and b, a representative experiment of three independent experiments is
shown, data are mean ± s.d. of 10 fields of cells examined. In c and e, data are mean ± s.d. from a representative experiment of three independent experiments. In d and f, a representative experiment of three independent experiments is shown, data are mean ± s.d. of 10 electron microscopy meshes. P values determined by two-tailed t-test. Scale bars, 50 nm.
a 0 25 50 75 100 0 20 40 60 VSVG/TGN46 colcoalization (%) Time (min) No treatment GAPDH siRNA GAPDH overexpression b 0 20 40 60 80 100 120 0 5 10 15 20 25 30 Tf/RAB11 colcoalization (%) Time (min) No treatment GAPDH siRNA GAPDH overexpression * ** c 0 5 10 15 20 0 10 20 30 10 20 30 40 50 CT/TGN46 colocalization (% ) Time (min) No treatment GAPDH siRNA GAPDH overexpression d 0 10 20 30 40 50 0 60 EGF/LAMP1 colocalization (% ) Time (min) No treatment GAPDH siRNA GAPDH overexpression e 0 20 40 60 80 0 10 20 30 Dextran/EEA1 colocalization (% ) Time (min) No treatment GAPDH siRNA GAPDH overexpression f 0 10 20 30 40 50 60 0 1 2 3 4 5 6 EGF/EEA1 colocalization (% ) Time (min) g h i * ** * * ** * ** j 0 10 20 30 40 50 60 ARF6 + + + ACAP1 – + + GAPDH – – +
GAP activity (AU) 0
10 20 30 ARF1 + + + AGAP1 – + + GAPDH – – +
GAP activity (AU) 0
1 2 3 4 5 6 7 Sar1 + + + ++ + Sec 23 – GAPDH – –
GAP activity (AU)
*/** 0 20 40 60 80 100 0 1 2 3 4 5 VSVG/giantin colcoalization (%) Time (min) No treatment GAPDH siRNA GAPDH overexpression NS1 NS2 No treatment GAPDH siRNA GAPDH overexpression NS1 NS2 NS NS */** * /** */** */** **
Fig. 2 | GAPDH inhibits other intracellular pathways also by targeting ARF GAPs. a–g, Transport assays in HeLa cells. a, Transport of vesicular
stomatitis virus G protein (VSVG) from the ER to the Golgi. P = 0.625 (NS1); P = 0.438 (NS2). b, Transport of VSVG from the Golgi to the plasma membrane. *P = 7.6 × 10⁻⁸, **P = 5.4 × 10⁻⁶. c, Endocytic recycling of transferrin (Tf) from the early endosome to the plasma
epidermal growth factor (EGF) from the plasma membrane to the lysosome. *P = 1.6 × 10⁻⁸, **P = 7.2 × 10⁻⁷. f, Endocytosis of dextran. *P = 1.1 × 10⁻¹⁰, **P = 1.8 × 10⁻⁶. g, EGF endocytosis. P = 0.9997 (NS1);
P = 0.418 (NS2). h–j, GAP assays using ARF6 and ACAP1 (h), ARF1 and
AGAP1 (i), or Sar1p and Sec23p (j). In a–g, one representative experiment of three independent experiments is shown, data are mean ± s.d. of 10
AMPKα1 prevented starvation from redistributing GAPDH to
mem-brane compartments (Extended Data Figs. 7a–e).
We also activated AMPK in the normal (non-starved) condition by treating cells with 5-aminoimidazole-4-carboxamide ribonucleo-tide (AICAR), and found that it reproduced the effect of starvation in suppressing the identical transport pathways, and this effect was also reversed by siRNA against GAPDH (Extended Data Fig. 7f–m). This result was further confirmed using A769662, a more specific activator of AMPK (Extended Data Fig. 7n–u). Moreover, AICAR treatment in the normal condition was sufficient to redistribute GAPDH to mem-brane compartments (Extended Data Fig. 8a–e). Thus, the collective results suggested that starvation acts through AMPK and then GAPDH to inhibit the transport pathways.
To examine how AMPK affects GAPDH, we were initially led by a previous observation that AMPK phosphorylates GAPDH at ser-ine 1229. We confirmed this finding, observing that AMPK did not phosphorylate GAPDH(S122A) (Fig. 3k, Extended Data Fig. 8f, g). GAPDH was phosphorylated less efficiently when compared to acetyl-CoA carboxylase, a well-established substrate of AMPK (Extended Data Fig. 8h–k), possibly because the sequence surrounding the S122 residue does not represent an optimal consensus site for AMPK phos-phorylation15. We also pursued cell-based studies, confirming that starvation activates AMPK in cells (Extended Data Fig. 8l). Starvation also increased the phosphorylation of GAPDH S122, and this effect was prevented by the S122A mutation (Extended Data Fig. 8m). Moreover, this phosphorylation was prevented by siRNA against AMPKα1
(Extended Data Fig. 8n). Similar results were also seen in HEK293 cells (Extended Data Fig. 8o–q). Starvation also did not redistribute cytosolic GAPDH(S122A) to membranes (Fig. 3l). Consistent with this result, GAPDH(S122A) also prevented starvation from inhibiting the transport pathways (Extended Data Fig. 9a–h). When GAPDH S122 was mutated to aspartate (S122D), which mimics constitutive phospho-rylation at this site9, we found that simply expressing GAPDH(S122D) in the non-starved condition was sufficient to redistribute cytosolic GAPDH to membranes (Fig. 3m). The expression of this mutant in the normal condition was also sufficient to inhibit the transport pathways (Extended Data Fig. 9i–p).
The effects of mutating the S122 residue in GAPDH suggested yet another way of confirming that GAPDH-mediated inhibition of trans-port acts in energy homeostasis. Replacing the endogenous GAPDH with the S122A mutant in cells exacerbated the decline in both the total ATP level and cell viability induced by starvation (Fig. 3n, o). By contrast, replacing endogenous GAPDH with the S122D mutant had the opposite effect of increasing the ATP level (Fig. 3p) and cell viability (Fig. 3q) during starvation.
AMPK phosphorylation of the S122 residue in GAPDH has previ-ously been found to induce the translocation of GAPDH to the nucleus, where it stimulates sirtuin 1 (SIRT1) activity to activate a transcription program that promotes autophagy9. We confirmed that our general starvation medium (which lacks glucose and amino acids) activated autophagy (Fig. 4a, b), and found that the recruitment of GAPDH to the Golgi—which is needed to inhibit COPI transport—began immediately
j 0 4 8 12 16 20 24 0 20 40 60 80 No treatment GAPDH siRNA GAPDH overexpression Starvation (h)
Total cell death (%
) GAPDH-Myc VAMP3 m Actin P-S/T GAPDH k l C M C M C M C M C M Starvation – + + n 0 10 20 30 40 50 60 0 25 50 75 100 125 No treatment Rescue S122A Rescue WT GAPDH siRNA Starvation (min)
ATP (per cent of control)
p o 0 4 8 12 16 20 24 0 20 40 60 80 No treatment GAPDH siRNA Rescue WT Rescue S122A Starvation (h)
Total cell death (%
) 0 10 20 30 40 50 60 0 25 50 75 100 125 No treatment GAPDH siRNA Rescue S122D Rescue WT Starvation (min)
ATP (per cent of control)
q 0 4 8 12 16 20 24 0 20 40 60 80 No treatment GAPDH siRNA Rescue S122D Rescue WT Starvation (h)
Total cell death (%)
0 20 40 60 80 100 0 1 2 3 4 5 VSVG/giantin
colocalization (%) VSVG–KDELR/giantin colocalization (%) Time (min)
No treatment Starved
Starved + GAPDH siRNA GAPDH siRNA 0 20 40 60 80 100 0 70 No treatment Starved
Starved + GAPDH siRNA GAPDH siRNA 0 20 40 60 80 100 0 VSVG/TGN46 colocalization (%) Time (min) a b c 0 20 40 60 80 100 120 0 5 30 Tf/Rab11 colocalization (%) Time (min) No treatment Starved
Starved + GAPDH siRNA GAPDH siRNA d 0 5 10 15 20 25 0 10 20 30 CT/TGN46 colocalization (%) Time (min) No treatment Starved
Starved + GAPDH siRNA GAPDH siRNA e 0 10 20 30 40 50 60 0 10 60 EGF/LAMP1 colocalization (% ) Time (min) No treatment Starved
Starved + GAPDH siRNA GAPDH siRNA f 0 20 40 60 80 0 10 20 30 40 20 30 40 50 Dextran/EEA1 colocalization (%) Time (min) g 0 10 20 30 40 50 0 1 2 3 4 5 6 EGF/EEA1 colocalization (%) Time (min) No treatment Starved
Starved + GAPDH siRNA GAPDH siRNA h NS1 NS2 NS * ** * ** NS 0 10 20 30 40 50 60 0 25 50 75 100 125 No treatment GAPDH siRNA GAPDH overexpression Starvation (min)
ATP (per cent of control)
i * ** * ** No treatment Starved
Starved + GAPDH siRNA GAPDH siRNA * ** NS1 NS2 Time (min) No treatment * Starved
Starved + GAPDH siRNA GAPDH siRNA ** */** */** */** */** */** */** GAPDH-Myc VAMP3 Actin WT WT WT S122 A S122 A WT S122 D 10 20 30 4050 60 10 15 20 25 10 20 30 40 50 60
Fig. 3 | AMPK phosphorylates GAPDH to inhibit the transport pathways for energy homeostasis. Treatments as indicated. a–h, Transport assays in HeLa cells. a, ER to Golgi. P = 0.7084 (NS1),
P = 0.175 (NS2). b, Golgi to ER. *P = 5.7 × 10⁻⁶, **P = 6.3 × 10⁻¹⁵.
c, Golgi to plasma membrane. *P = 5.4 × 10⁻⁶, **P = 4.3 × 10⁻¹¹. d, Early endosome to plasma membrane, *P = 5.5 × 10⁻⁹, **P = 1.2 × 10⁻¹².
e, Plasma membrane to Golgi. *P = 5.4 × 10⁻⁴, **P = 6.2 × 10⁻⁶. f, Plasma membrane to lysosome, *P = 1.7 × 10⁻³, **P = 1.9 × 10⁻⁸. g, Dextran endocytosis. *P = 7.8 × 10⁻⁸, **P = 2.1 × 10⁻¹². h, EGF endocytosis.
P = 0.9994 (NS1), P = 0.7437 (NS2). i, Total ATP level. j, Cell death.
k, AMPK phosphorylation of GAPDH assessed by an in vitro kinase assay.
Representative blot of three independent experiments. p-S/T, phospho-serine/threonine. l, m, Distribution of GAPDH in membranes (M) and cytosol (C). Representative gels of two independent experiments.
n, p, Total ATP level. o, q, Cell death. In a–h, one representative
experiment of three independent experiments is shown, data are mean ± s.d. of 10 fields of cells examined. In i, j, n, p, o, q, data are mean ± s.d. from a representative experiment of three independent experiments. P values determined by two-tailed t-test.
1 3 S e P t e M B e r 2 0 1 8 | V O L 5 6 1 | N A t U r e | 2 6 5 © 2018 Springer Nature Limited. All rights reserved.
Letter
reSeArCH
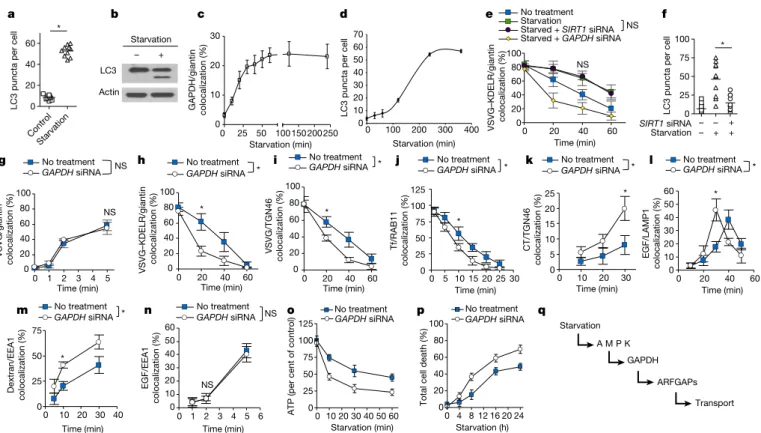
upon starvation (Fig. 4c). By contrast, LC3 puncta formation, which tracks autophagosome formation, started more slowly (Fig. 4d). Further distinguishing between the roles of GAPDH in transport inhibition and autophagy, we found that siRNA against SIRT1 did not have an appreciable effect on starvation-induced inhibition of COPI transport (Fig. 4e), but prevented starvation from inducing autophagy (Fig. 4f).
We also examined mouse embryonic fibroblasts (MEFs) derived from Atg5-deficient mice, which cannot undergo autophagy16, and found that GAPDH could still inhibit the identical transport pathways as those seen in autophagy-competent cells (Fig. 4g–n). Moreover, siRNA against GAPDH could still exacerbate the decline of total ATP (Fig. 4o) and cell viability (Fig. 4p) during starvation. In another approach, we modified GAPDH so that its redistribution to the nucleus was prevented, but its recruitment to cytoplasmic mem-brane compartments was preserved. This form of GAPDH could still inhibit the transport pathways, and increased ATP level and cell via-bility during starvation (Supplementary Information and Extended Data Fig. 10a–u). Therefore, multiple lines of evidence all point to the roles of GAPDH in transport inhibition and autophagy being distinct.
In summary, we have defined a new mechanism of energy home-ostasis that is critical for the cell to survive during starvation. Mechanistically, this involves the activation of AMPK to induce the redistribution of cytosolic GAPDH to multiple membrane compart-ments, which then targets ARF GAPs to inhibit different transport pathways (Fig. 4q). As the cell encounters starvation in many settings, considerable effort has been devoted to elucidating mechanisms of cell
energy consumption. These fundamentally distinct mechanisms com-plement each other to promote energy homeostasis during starvation. Another notable distinction between the two mechanisms is that the transport inhibition by GAPDH occurs more rapidly than autophagy. This more rapid mechanism is likely to enable the cell to stave off the lethal consequences of starvation while longer-term solutions, such as autophagy, are being mobilized.
Online content
Any methods, additional references, Nature Research reporting summaries, source data, statements of data availability and associated accession codes are available at https://doi.org/10.1038/s41586-018-0475-6.
Received: 17 November 2016; Accepted: 12 July 2018; Published online 12 September 2018.
1. Singh, R. & Cuervo, A. M. Autophagy in the cellular energetic balance. Cell
Metab. 13, 495–504 (2011).
2. Donaldson, J. G. & Jackson, C. L. ARF family G proteins and their regulators: roles in membrane transport, development and disease. Nat. Rev. Mol. Cell Biol. 12, 362–375 (2011).
3. Yang, J. S. et al. ARFGAP1 promotes the formation of COPI vesicles, suggesting function as a component of the coat. J. Cell Biol. 159, 69–78 (2002). 4. Lee, S. Y., Yang, J. S., Hong, W., Premont, R. T. & Hsu, V. W. ARFGAP1 plays a
central role in coupling COPI cargo sorting with vesicle formation. J. Cell Biol. 168, 281–290 (2005).
5. Sirover, M. A. On the functional diversity of glyceraldehyde-3-phosphate dehydrogenase: biochemical mechanisms and regulatory control. Biochim.
Biophys. Acta 1810, 741–751 (2011). 0 20 40 60 80 100 0 1 2 3 4 5 VSVG/giantin colocalization (%) Time (min) No treatment GAPDH siRNA g NS NS 0 10 20 30 40 50 60 0 1 2 3 4 5 6 EGF/EEA1 colocalization (% ) Time (min) No treatment GAPDH siRNA n NS NS o 0 10 20 30 40 50 60 0 25 50 75 100 125 No treatment GAPDH siRNA Starvation (min)
ATP (per cent of control)
p 0 4 8 12 16 20 24 0 20 40 60 80 100 No treatment GAPDH siRNA Starvation (h)
Total cell death (%)
q c b a 0 25 50 0 10 20 30 100150200250 Starvation (min) GAPDH/giantin colocalization (%) Starvation (min) 0 100 200 300 400
LC3 puncta per cell
0 10 20 30 40 50 60 70 0 20 40 60 80 100 0 20 40 60 VSVG–KDELR/giantin colocalization (%) Time (min) No treatment Starvation
Starved + SIRT1 siRNA Starved + GAPDH siRNA
e f NS NS * d 0 20 40 60 80 100 0 20 40 60 VSVG–KDELR/giantin colocalization (%) Time (min) No treatment GAPDH siRNA h 0 20 40 60 80 100 0 20 40 60 VSVG/TGN46 colocalization (% ) Time (min) No treatment GAPDH siRNA i 0 25 50 75 100 125 0 5 10 15 20 25 30 Tf/RAB11 colocalization (%) Time (min) No treatment GAPDH siRNA j 0 5 10 15 20 25 0 10 20 30 CT/TGN46 colocalization (% ) Time (min) No treatment GAPDH siRNA k 0 10 20 30 40 50 60 0 20 40 60 EGF/LAMP1 colocalization (% ) Time (min) No treatment GAPDH siRNA 0 25 50 75 0 10 20 30 40 Dextran/EEA1 colocalization (% ) Time (min) No treatment GAPDH siRNA m * * * * * * * * * * l – + LC3 Actin Starvation * * Starvation A M P K GAPDH ARFGAPs Transport * 0 20 40 60
LC3 puncta per cell
0 25 50 75 100 SIRT1 siRNA Starvation + ++
LC3 puncta per cel
l – – – Contro l Starvation
Fig. 4 | The roles of GAPDH in transport and autophagy are distinct. a, b, Autophagy in HeLa cells following starvation, assessed by LC3 puncta
formation (a; *P = 0.000152) or LC3 gel shift (b). c, GAPDH recruitment to the Golgi in HeLa cells with the indicated conditions. d, LC3 puncta formation in HeLa cells. e, COPI transport assay in HeLa cells. P = 0.8490 (NS). f, LC3 puncta formation in HeLa cells. *P = 0.00174. g–n, Transport assays in ATG5-deficient MEFs. g, ER to Golgi. P = 0.25 (NS). h, Golgi to ER. *P = 9.9 × 10⁻⁸. i, Golgi to plasma membrane. *P = 5.9 × 10⁻⁷. j, Early endosome to plasma membrane. *P = 6.4 × 10⁻⁵. k, Plasma membrane to Golgi. *P = 7.6 × 10⁻⁷. l, Plasma membrane to lysosome. *P = 3.2 × 10⁻⁷.
m, Dextran endocytosis. *P = 1.2 × 10⁻⁹. n, EGF endocytosis. P = 0.9994 (NS). o, Total ATP level. p, Cell death. q, Summary of how inhibition of transport by GAPDH promotes cellular energy homeostasis. A representative experiment of one (d), two (a, f) or three (e, g–n) independent experiments is shown, data are mean ± s.d. of 10 fields of cells examined. In b, the gel is representative of two independent experiments. In c, data are mean ± s.d. of 6 fields of cells examined in one experiment. In o and p, data are mean ± s.d. from three independent experiments.
8. Park, S. Y., Yang, J. S., Schmider, A. B., Soberman, R. J. & Hsu, V. W. Coordinated regulation of bidirectional COPI transport at the Golgi by CDC42. Nature 521, 529–532 (2015).
9. Chang, C. et al. AMPK-dependent phosphorylation of GAPDH triggers Sirt1 activation and is necessary for autophagy upon glucose starvation. Mol. Cell 60, 930–940 (2015).
10. Bai, M. et al. ARFGAP1 promotes AP-2 dependent endocytosis. Nat. Cell Biol. 13, 559–567 (2011).
11. Li, J. et al. An ACAP1-containing clathrin coat complex for endocytic recycling.
J. Cell Biol. 178, 453–464 (2007).
12. Nie, Z. et al. Specific regulation of the adaptor protein complex AP-3 by the ARF GAP AGAP1. Dev. Cell 5, 513–521 (2003).
13. Barlowe, C. et al. COPII: a membrane coat formed by Sec proteins that drive vesicle budding from the endoplasmic reticulum. Cell 77, 895–907 (1994).
14. Hardie, D. G., Ross, F. A. & Hawley, S. A. AMPK: a nutrient and energy sensor that maintains energy homeostasis. Nat. Rev. Mol. Cell Biol. 13, 251–262 (2012).
15. Schaffer, B. E. et al. Identification of AMPK phosphorylation sites reveals a network of proteins involved in cell invasion and facilitates large-scale substrate prediction. Cell Metab. 22, 907–921 (2015).
16. Kuma, A. et al. The role of autophagy during the early neonatal starvation period. Nature 432, 1032–1036 (2004).
Acknowledgements This work was supported by grants from the US National Institutes of Health to V.W.H. (GM058615 and GM115683), J.Lo. (HL61795,
HL119145, HG007690 and GM107618) and W.M.O. (HL128802), and a grant from the American Heart Association to J.Lo. (D700382).
Reviewer information Nature thanks D. Hardie and the other anonymous reviewer(s) for their contribution to the peer review of this work.
Author contributions J.-S.Y., J.-W.H., S.-Y.P. and J.Li performed colocalization studies. J.-S.Y. performed vesicle reconstitution studies with help from G.V.B. and A.A.M. W.H. performed membrane fractionation studies. S.Y. and J.-W.H. performed ATP and cell death assays. W.M.O. performed metabolic studies with supervision by J.Lo. All authors participated in experimental design and data analysis. V.W.H. supervised the project and wrote the manuscript with input from all other authors.
Competing interests The authors declare no competing interests. Additional information
Extended data is available for this paper at https://doi.org/10.1038/s41586-018-0475-6.
Supplementary information is available for this paper at https://doi.org/ 10.1038/s41586-018-0475-6.
Reprints and permissions information is available at http://www.nature.com/ reprints.
Correspondence and requests for materials should be addressed to V.W.H. Publisher’s note: Springer Nature remains neutral with regard to jurisdictional claims in published maps and institutional affiliations.
1 3 S e P t e M B e r 2 0 1 8 | V O L 5 6 1 | N A t U r e | 2 6 7 © 2018 Springer Nature Limited. All rights reserved.
Letter
reSeArCH
MEthodS
Chemicals, proteins and cells. AICAR, chloroquine diphosphate, methyl
pyru-vate, protease inhibitor cocktail and phosphatase inhibitor cocktail were obtained from Sigma. AMPK activator A-769662 was obtained from Cayman. Alexa Fluor 546-conjugated transferrin, and Alexa Fluor 555-conjugated forms of EGF, dextran and cholera toxin were obtained from Invitrogen.
Purification of coatomer, ARF1, ARFGAP1, BARS, Golgi-enriched membrane and cytosol have been described3,17. Purification of ARF6, ACAP1, and AGAP1 have also been described11,12. Purified mammalian Sar1p and Sec23p were obtained from J. Goldberg, Memorial Sloan-Kettering Cancer Center. Purified forms of GAPDH, glutamate dehydrogenase (GDH), glycerol-3-phosphate dehydrogenase (GPDH), and lactate dehydrogenase (LDH) were obtained from Sigma. AMPK and the SAMS peptide (HMRSAMSGLHLVKRR) were obtained from (Promega).
For the purification of recombinant GAPDH, the pET30-2-GAPDH plasmid was transformed into BL21 competent cells. Isopropyl β-d-1-thiogalactopyranoside (0.1mM) was added to induce protein expression. Bacteria were then resuspended in 5 ml lysis buffer (20 mM Tris pH 8.0, 100 mM NaCl, 10 mM imidazole, 1 mg/ml lysozyme, and protease inhibitors cocktail). After gentle agitation at 4 °C for 30 min, the suspension was sonicated on ice 6 times for 10 s each, and then centrifuged at 12,000g for 20 min. The supernatant was recovered and then added to 0.5 ml Ni-beads (50% slurry), followed by incubation at 4 °C for 1 h. Beads were then washed with 10 ml washing buffer (20 mM Tris pH 8.0, 100 mM NaCl, 10 mM imidazole). Bound proteins were then eluted with elution buffer (20 mM Tris pH 8.0, 100 mM NaCl, 250 mM imidazole).
HeLa, BSC-1, COS-7, CHO and HEK293 cells have previously been described10,18,19. Wild-type and ATG5-deficient MEF cells were obtained from N. Mizushima, University of Tokyo. Cells were cultured in Dulbecco’s Modified Eagle Medium (DMEM) with 10% fetal bovine serum and supplemented with glutamine. Cells had been free of mycoplasma contamination upon their receipt, but were not tested immediately prior to use. Unless stated otherwise, starvation involves incubating cells in a medium consisting of phosphate-buffered saline (PBS) with 10% dialysed bovine serum.
Mass spectrometry. Cytosol was purified from rat liver by homogenization in lysis
buffer (1 mM Tris pH 7.4, 800 mM sucrose, 5 mM EDTA and protease inhibitors) at 4 °C, followed by centrifugation at 80,000g for 90 min. The resulting superna-tant was dialysed against dialysis buffer (25mM Tris at pH 8.0, 50mM KCl and 1mM DTT), followed by centrifugation at 150,000g for 90 min at 4 °C. Aliquots were stored at −80 °C. Pull-down experiments were performed by incubating glutathione S-transferase (GST) or GST–ARFGAP1 on beads (5 μg) with 50 μg rat liver cytosol in traffic buffer (25 mM HEPES pH 7.2, 50 mM KCl and 2.5 mM Mg(OAc)2) for 1 h followed by extensive washing. Samples were separated by SDS– PAGE and then stained with Coomassie blue, followed by gel excision for protein identification by mass spectrometry (Taplin Mass Spectrometry Facility, Harvard Medical School). Those proteins (having at least five identified peptides) that inter-acted with GST–ARFGAP1 but not GST were considered specific.
Plasmids and antibodies. Mammalian expression vectors that contain
tempera-ture-sensitive mutants (ts-045) of VSVG and VSVG–KDELR have been described7. GAPDH for mammalian expression was subcloned into pcDNA3.1 and pEG-FP-N1. GAPDH for bacterial expression (pET30-2-GAPDH) was obtained from Addgene (83910). Mutant forms of GAPDH were generated using QuikChange Site-Directed-Mutagenesis (Stratagene). The sequences of oligonucleotides used for mutagenesis are listed in Supplementary Table 1. The pEGFP-NES-GAPDH construct was obtained from W. Liu (Zhejiang University). IL2R-β tagged with haemagglutinin (HA) and Venus (HA-Venus-IL2R-β) was obtained from T. Waldman and O. Hurtaldo (NIH). ARFGAP1, Wbp1 and GST-KDELR have been described3,17.
Antibodies against ARF1, ARFGAP1, β-COP, calnexin, cellubrevin, coatomer, giantin, GM130, LAMP1, Sec61p, TGN46 VSVG, TGN46, HA tag and Myc tag have previously been described10,17,19. The following antibodies were also used: AMPKα (Cell Signaling, 2603S), β-actin (Ambion, AM4302), GFP (Invitrogen, GF28R), LC3 (Sigma, L7543), p62 (Santa Cruz, 28359), p172-AMPKα (Cell Signaling, 2531S), RAB11 (BD Biosciences, 610656), SIRT1 (Cell Signaling, 2493S), and Flag tag M2 (Sigma, F1804). Antibodies against GAPDH were obtained from three sources: Ambion (AM4300), Santa Cruz (FL335), and Sigma (G9545). Anti-pS/pT was obtained from Abcam (117253) and conjugated antibodies were obtained from Jackson ImmunoResearch, including Cy2- or Cy3-conjugated don-key antibodies against mouse or rabbit IgG, and horseradish peroxidase-conjugated donkey antibodies against mouse or rabbit IgG.
Transfections and siRNA. Transfection of DNA plasmids was performed using
FuGene6 (Roche). Transfection of siRNA was performed using Lipofectamine RNAiMAX (Invitrogen). Sequences used for siRNA against GAPDH and AMPKα1,
We found that siRNA against GAPDH for 2 days was optimal for reducing the endogenous level while maintaining cell viability. Rescue of siRNA against
GAPDH involved the transfection of siRNA-resistant GAPDH for 12 h to achieve
limited GAPDH expression. GAPDH overexpression involved the transfection of GAPDH for 48 h.
In vivo transport assays. A quantitative microscopy-based approach, which
involves the colocalization of model cargoes with organelle markers coupled with kinetic analysis was performed as previously described8,10.
For anterograde transport from ER to Golgi, cells were transfected with pROSE-VSVG-ts045-Myc for 1 day, and then incubated at 39 °C for 4 h to accumulate VSVG in the ER. Cells were then shifted to 32 °C for different times as indicated in figures. Cells were then stained for giantin, followed by confocal microscopy to assess the arrival of VSVG to the Golgi.
For retrograde transport from the Golgi to the ER, cells were transfected with pROSE-VSVG-ts045-KDELR-Myc for 1 day, and then incubated at 32 °C for 8 h to achieve steady-state distribution at the Golgi. Cells were then shifted to 39 °C for different times as indicated in the figures. Cells were then stained for giantin, fol-lowed by confocal microscopy to assess the exit of VSVG-KDELR from the Golgi. For anterograde transport from the Golgi to the plasma membrane, cells were transfected with pROSE-VSVG-ts045-Myc for 1 day, and then incubated at 20 °C for 2 h to accumulate VSVG at the TGN. Cells were then shifted to 32 °C for differ-ent times as indicated in the figures. Cells were then stained for TGN46, followed by confocal microscopy to assess the exit of VSVG from the Golgi.
For the recycling of transferrin from the early recycling endosome to the plasma membrane, cells were incubated with Alexa 546-conjugated transferrin (5 μg/ml in DMEM) at 37 °C for 2 h to allow the steady-state accumulation of transferrin in endosomes. Subsequently, cells were incubated with medium without transferrin for different times as indicated in the figures. Cells were then stained for RAB11, followed by confocal microscopy to assess the exit of transferrin from the early recycling endosome.
For the retrograde transport of cholera toxin from the plasma membrane to the Golgi, cells were incubated with Alexa 555-conjugated cholera toxin for 30 min at 4 °C (0.5 μg/ml in DMEM). After washing to clear unbound cholera toxin, cells were shifted to 37 °C for different times as indicated in the figures. Cells were then stained for TGN46, followed by confocal microscopy to assess the arrival of cholera toxin to the Golgi.
For endocytic transport of EGF to the lysosome, cells were incubated with Alexa 555-conjugated EGF (1 μg/ml in DMEM) for 1 h at 4 °C. Cells were then washed to clear unbound EGF, followed by shifting to 37 °C for times indicated in the figures. Cells were stained for LAMP1, followed by confocal microscopy to assess the arrival of EGF to the lysosome.
For the fluid-phase uptake of dextran, cells were incubated with Alexa 555-con-jugated dextran (0.2 mg/ml) at 37 °C for different times as indicated in the figures. Cells were then stained for EEA1, followed by confocal microscopy to assess the arrival of dextran to the early endosome.
For the endocytosis of EGF, cells were incubated with Alexa 555-conjugated EGF (1 μg/ml in DMEM) for 1 h at 4 °C. Cells were then washed to clear unbound EGF, fol-lowed by shifting to 37 °C for times indicated in the figures. Cells were stained for EEA1, followed by confocal microscopy to assess the arrival of EGF to the early endosome.
For the endocytosis of transferrin, cells were incubated with Alexa 546-conju-gated transferrin (5 μg/ml in DMEM) for 1 h at 4 °C. Cells were then washed to clear unbound transferrin, followed by shifting to 37 °C for times indicated in the figures. Cells were stained for EEA1, followed by confocal microscopy to assess the arrival of transferrin to the early endosome.
For the endocytosis of cholera toxin, cells were incubated with Alexa 555- conjugated cholera toxin for 30 min at 4 °C (0.5 μg/ml in DMEM). Cells were then washed to clear unbound cholera toxin, followed by shifting to 37 °C for different times as indicated in the figures. Cells were stained for EEA1, followed by confocal microscopy to assess the arrival of cholera toxin to the early endosome.
For the endocytosis of IL2R-β, cells were transfected with pCDH-HA-Venus-IL2R-β for 1 day at 37 °C. Cells were then incubated with anti-HA antibody at 4 °C for 1 h to label the surface pool of the receptor. Cells were washed to clear unbound antibody, followed by shifting to 37 °C for different times as indicated in the figures. Cells were then stained for EEA1, followed by confocal microscopy to assess the arrival of IL2R-β to the early endosome.
Confocal microscopy. Colocalization studies were performed with either a Nikon
or a Zeiss system. The Nikon system is equipped with the Nikon Eclipse TE2000U Inverted Microscope having a Plan Apo 60×/1.40 oil objective, Nikon D-Eclipse C1 confocal package with a 488 Laser (having 515/30 emission filter) and a 543 Laser (having 590/50 emission filter), and Nikon EZ-C1 v.3.90 acquisition software. The Zeiss system is equipped with the Zeiss Axio Observer Z1 Inverted Microscope
For quantification of colocalization, ten fields of cells were examined, with each field typically containing about 5 cells. Images were imported into the NIH ImageJ v.1.50e software, and then analysed through a plugin software (https://imagej.net/ Coloc_2). Under the ‘image’ tab, the ‘split channels’ option was selected. Under the ‘plugins’ tab, ‘colocalization analysis’ option was selected, and within this option, the ‘colocalization threshold’ option was selected. Colocalization values were then calculated by the software, and expressed as the fraction of protein of interest (cargo or GAPDH) colocalized with an organelle marker.
In vitro reconstitution of COPI vesicle formation. The reconstitution was
performed essentially as described17. In brief, Golgi membrane (0.2 mg/ml) was washed with 3 M KCl, and then incubated with ARF1 (6 μg/ml) and coatomer (6 μg/ml) for the first-stage incubation that reproduces the ARF-dependent recruit-ment of coatomer onto Golgi membrane. The Golgi membrane was re-isolated and then incubated with ARFGAP1 (2 μg/ml), BARS (2 μg/ml) for the second stage that results in vesicle formation. GAPDH (1 μg/ml) was added at the second stage. Electron microscopy examination of Golgi membrane using the whole-mount technique has previously been described3. Quantification involves the examination of 10 meshes per condition.
Fractionation of the cytoplasm to obtain total membrane versus cytosol. Cells
were washed with PBS, resuspended in homogenization buffer (0.25 M sucrose, 1 mM EDTA, and 20 mM HEPES-KOH, pH 7.4 and protease inhibitor cocktail) and then disrupted by passing through 28-gauge needles. After low-speed cen-trifugation (800g for 6 min) to spin out nuclei and unbroken cells, the resulting post-nuclear supernatant was centrifuged at 100,000g for 1 h to obtain cytosol and total membrane fractions.
Other in vitro assays. For pull-down assays, GST fusion proteins were bound
to glutathione beads, then incubated with purified proteins. For the GAP assay, recombinant forms of ARF small GTPase were first loaded with GTP and then incubated with different ARF GAPs in the presence of liposomes. GTP hydrolysis was then quantified by detecting the generation of free phosphate (ATPase/GTPase Activity Assay Kit, Sigma). The in vitro kinase assay was performed by incubat-ing AMPK (0.1 μg) with the SAMS peptide (a sequence derived from acetyl-CoA carboxylase) (3 μg) or different GAPDH proteins (40 μg) in 50 μl reaction buffer (25 mM MOPS, pH 7.2, 12.5 mM β-glycero-phosphate, 25 mM MgCl2, 5 mM EGTA, 2 mM EDTA, 0.25 mM DTT, 100 μM AMP and 50 μM ATP) at 30 °C for times as indicated. Phosphorylation of the substrate was then quantified using the ADP-Glo Kinase assay (Promega), which detects ADP generated from ATP in the kinase reaction.
Other in vivo assays. Cellular ATP level was detected using ATPlite Luminescence
Detection Assay System (Perkin Elmer), and was performed according to the
manufacturer’s instructions, with final values normalized for cell number. Cell death was assessed by incubating cells with propidium iodide (1 ng/μl), and then quantifying for positively stained cells by flow cytometry. Lactate level was meas-ured using a colorimetric assay kit (Biovision). Oxygen consumption rate (OCR) was measured using an XFe24 Extracellular Flux Analyzer (Seahorse Biosciences), as previously described20. SIRT1 activity was measured using SIRT1 Direct Fluorescent Screening Assay Kit (Cayman), as previously described9. Autophagy was assessed through LC3 lipidation, using either confocal microscopy to quan-tify LC3 puncta formation, or western blotting to detect LC3 mobility shift, as previously described9.
Experimental replicates. All colocalization studies are shown as 10 technical
rep-licates from a representative experiment, with 3 independent experiments having been performed. Metabolic studies involving oxygen consumption rate are per-formed as 5 technical replicates, with 2 independent experiments having been performed. The result from a representative replicate is shown. All other studies show a representative experiment with the number of independent experiments indicated in the figure legend.
Statistical analysis. Sample size is noted in the figure legends. No statistical
meth-ods were used to predetermine sample size. Statistical significance was determined using Excel or Prism software for the two-tailed Student’s t-test. No inclusion or exclusion criteria were pre-established. The experiments were not randomized. The investigators were not blinded to the group allocation during experiments and in outcome assessment.
Reporting summary. Further information on research design is available in
the Nature Research Reporting Summary linked to this paper.
Data availability.. The data that support the findings of this study are available
from the corresponding author upon reasonable request. The following figures have associated raw data: Figs. 1a, b, 2a–g, 3a–j, n–q, 4c–e, g–p; Extended Data Figs. 1c, k, 2m,n, s–v, 3 s–v, 4a–x, 5a–c, g–x, 6a–h, j, l–s, 7f–u, 9a–p, 10h–u. For gel source data, see Supplementary Fig. 1.
17. Yang, J. S. et al. A role for BARS at the fission step of COPI vesicle formation from Golgi membrane. EMBO J. 24, 4133–4143 (2005).
18. Aoe, T. et al. The KDEL receptor, ERD2, regulates intracellular traffic by recruiting a GTPase-activating protein for ARF1. EMBO J. 16, 7305–7316 (1997).
19. Dai, J. et al. ACAP1 promotes endocytic recycling by recognizing recycling sorting signals. Dev. Cell 7, 771–776 (2004).
20. Oldham, W. M., Clish, C. B., Yang, Y. & Loscalzo, J. Hypoxia-mediated increases in l-2-hydroxyglutarate coordinate the metabolic response to reductive stress.
Cell Metab. 22, 291–303 (2015).
Letter
reSeArCH
Extended Data Fig. 1 | Further characterization of GAPDH inhibition of COPI transport. a, b, The COPI transport assay was performed
on HeLa cells that were treated as indicated. A confocal image from a representative experiment (out of three) is shown. Green, VSVG–KDELR; red, giantin. Scale bar, 10 μm. Line-scan analysis for each image is also shown. c, The COPI transport assay was performed on HeLa cells that were treated as indicated. Quantification of a representative experiment (out of three) is shown, n = 10 fields of cells examined. Data are mean ± s.d. *P = 2.8 × 10⁻⁷, **P = 8.2 × 10⁻⁷. d, HeLa cells were treated as indicated, and cell death was quantified by flow cytometry. Data are mean ± s.d. from n = 10 independent experiments. P = 0.7314 (NS).
e, HeLa cells were treated as indicated, and the COPI transport assay was
performed. A confocal image from a representative experiment (out of three) is shown. Green, VSVG–KDELR; red, giantin. Scale bar, 10 μm. Line-scan analysis for each image is also shown. f, HeLa cells were treated as indicated, and whole-cell lysates were immunoblotted for proteins as indicated. Representative blot from three independent experiments.
g, GST fusion proteins were incubated with purified GAPDH in a
pull-down experiment, followed by immunoblotting as indicated. Representative blot from three independent experiments. h, HeLa
cells were transfected with constructs as indicated, followed by immunoprecipitation using the Myc tag and then immunoblotting for GAPDH. Representative blot from two independent experiments.
i, GST fusion proteins as indicated were bound to beads and then
incubated with purified coatomer in a pull-down experiment, followed by immunoblotting to detect β-COP or Coomassie staining to detect GST fusion proteins. Representative results from three independent experiments. j, The indicated cytoplasmic tails of cargo proteins were fused to GST, bound to beads, and then incubated with ARFGAP1, followed by immunoblotting with antibody against ARFGAP1 or Coomassie staining to detect GST fusion proteins. Representative results from two independent experiments. k, HeLa cells were treated as indicated, and assayed for COPI transport. Quantification of a representative experiment (of three) is shown. Data are mean ± s.d. from n = 10 fields of cells examined. *P = 1.4 × 10⁻⁶. l, HeLa cells were transfected with GAPDH constructs as indicated. ARFGAP1 immunoprecipitates were immunoblotted for the different forms of GAPDH as indicated. Representative blot from two experiments. P values determined by two-tailed t-test.
Letter
reSeArCH
Extended Data Fig. 2 | Further characterizing how GAPDH affects other pathways. a, HeLa cells were treated as indicated, fractionated into
cytosol (C) and total membrane (M), and immunoblotted for proteins as indicated. Representative blot from two independent experiments.
b–f, HeLa cells were treated as indicated, and examined for the
colocalization between GAPDH and different organelle markers. A confocal image from a representative experiment (out of three) is shown. Scale bar, 10 μm (left); quantification of colocalization (right). Data are mean ± s.d. of n = 10 fields of cells examined. Colocalization of GAPDH (red) with giantin (green), *P = 2.9 × 10⁻⁴ (b); colocalization of GAPDH (red) with TGN46 (green), *P = 1.5 × 10⁻⁴ (c); colocalization of GAPDH (red) with EEA1 (green), *P = 1.9 × 10⁻³ (d); colocalization of GAPDH (red) with LAMP1 (green), *P = 7.2 × 10⁻⁴ (e); colocalization of GAPDH (red) with Sec61p (green), P = 0.8531 (f). g–l, Transport assays were performed in HeLa cells. A confocal image from a representative experiment (out of three) is shown. Scale bar, 10 μm. Line-scan analysis
for the representative image is also shown. Transport from the ER to the Golgi (g; green, VSVG; red, giantin), transport from the Golgi to the plasma membrane (h; green, VSVG; red, TGN46), transport from the early endosome to the plasma membrane (i; red, transferrin; green, RAB11), transport from the plasma membrane to the Golgi (j; red, cholera toxin; green, TGN46); transport from the plasma membrane to the lysosome (k; red, EGF; green, LAMP1), transport from the plasma membrane to the early endosome (l; red, dextran; green, EEA1). m, n, Transport assays in HeLa cells; a representative experiment (out of three) is shown, n = 10 fields of cells examined. Data are mean ± s.d. Cholera toxin endocytosis (m), P = 1 (NS1); P = 0.3205 (NS2); interleukin-2 receptor beta subunit (IL2R-β) endocytosis (n), P = 0.063 (NS1), P = 0.9264 (NS2). o–r, HeLa cells were treated as indicated followed by immunofluorescence microscopy using different antibodies against GAPDH (o, q) or imaging of GFP-tagged GAPDH (p, r). Image from a representative experiment of two is shown. Scale bar, 10 μm. P values determined by two-tailed t-test.
Letter
reSeArCH
Extended Data Fig. 3 | Additional characterization of GAPDH and its effects on the transport pathways. a–d, The distribution of
different organelle markers in CHO (a), COS-7 (b), HeLa (c) or MEF (d) cells were assessed by immunofluorescence microscopy. Image from a representative experiment of two experiments is shown. Scale bar, 10 μm. e–h, Comparison of the distribution of two markers against the same intracellular compartment using confocal microscopy. ER markers Sec61p (green) and calnexin (red) (e); Golgi markers giantin (green) and GM130 (red) (f); early endosome markers EEA1 (green) and RAB5 (red) (g); lysosome markers LAMP1 (green) and CD63 (red) (h). Images are representative of two experiments. Scale bar, 10 μm. i–l, Confirming the staining specificity of organelle markers using model cargoes that reside at specific intracellular compartments using confocal microcopy: GFP-tagged VSVG at the ER (green) and Sec61p (red) (i); GFP-GFP-tagged VSVG at the Golgi (green) and giantin (red) (j); fluorescently labelled transferrin
(green) and EEA (red) (k); fluorescently labelled dextran (green) and LAMP1 (red) (l) Images are representative of two experiments. Scale bar, 10 μm. m, n, The GAP assay was performed using ARF6 and ACAP1 (m) or ARF1 and AGAP1 (n), in the presence of different metabolic enzymes as indicated. One experiment of three independent experiments is shown.
o–r, Pull-down studies to detect GAPDH binding directly to: ACAP1 (o),
AGAP1 (p), Sec23p (q) or different portions of ARFGAP1 as indicated (r). Representative blot from three experiments. s–v, HeLa (s, u) or BSC-1 (t, v) cells were treated as indicated, followed by transport assay for transferrin endocytosis. Quantification of a representative experiment (out of three) is shown, n = 10 fields of cells examined. Data are mean ± s.d. In s: P = 0.4646 (NS1); P = 0.6973 (NS2). In t: *P = 1.8 × 10⁻⁴. In u:
P = 0.8073 (NS). In v: *P = 3.6 ×10 −5, **P = 1.7 × 10⁻⁶. P values
Extended Data Fig. 4 | See next page for caption.
Letter
reSeArCH
Extended Data Fig. 4 | Different ways of starving cells lead to identical pathways being inhibited and inhibition requires GAPDH.
a–h, Transport assays were performed following incubation of HeLa
cells in Hank’s medium. Quantification of one experiment (out of three) is shown. Data are mean ± s.d. of n = 10 fields of cells examined. Transport of VSVG from the ER to the Golgi, P = 0.1944 (NS1), P = 0.05 (NS2) (a); COPI transport of VSVG–KDELR from the Golgi to the ER, *P = 2.4 × 10⁻⁶, **P = 4.2 × 10⁻¹⁰ (b); transport of VSVG from the Golgi to the plasma membrane, *P = 1.7 × 10⁻⁵, **P = 6.7 × 10⁻⁸ (c); transport of transferrin from the early endosome to the plasma membrane, *P = 2.9 × 10⁻⁵, **P = 6.9 × 10⁻⁹ (d); transport of cholera toxin from the plasma membrane to the Golgi, *P = 2.4 × 10⁻³, **P = 7.8 × `10−7 (e); transport of EGF from the plasma membrane to the lysosome, *P = 1.9 × 10⁻⁶, **P = 1.5 × 10⁻² (f); transport of dextran from the plasma membrane to the early endosome, *P = 7.8 × 10⁻³, **P = 3.4 × × 10−7 (g); transport of EGF from the plasma membrane to the early endosome,
P = 0.1485 (NS1), P = 0.6378 (NS2) (h). i–p, HeLa cells were incubated
in medium without glucose, and then transport assays were performed. Quantification of one experiment (out of three) is shown. Data are mean ± s.d. from n = 10 fields of cells examined. Transport of VSVG from the ER to the Golgi, P = 0.6921 (NS1), P = 0.5648 (NS2) (i); COPI transport of VSVG–KDELR from the Golgi to the ER, *P = 4.4 × 10⁻⁴, **P = 6.5 × 10⁻⁷ (j); transport of VSVG from the Golgi to the plasma membrane, *P = 1.6 × 10⁻², **P = 6.7 × 10⁻⁵ (k); transport of transferrin
from the early endosome to the plasma membrane, *P = 1.9 × 10⁻⁴, **P = 2.8 × 10⁻⁹ (l); transport of cholera toxin from the plasma membrane to the Golgi, *P = 7.4 × 10⁻⁴, **P = 4.2 × 10⁻⁵ (m); transport of EGF from the plasma membrane to the lysosome, *P = 7.6 × 10⁻³, **P = 3.2 × 10⁻⁹ (n); transport of dextran from the plasma membrane to the early endosome, *P = 2.2 × 10⁻³, **P = 1.6 × 10⁻⁵ (o); transport of EGF from the plasma membrane to the early endosome, P = 0.8648 (NS1), P = 0.8946 (NS2) (p). q–x, HeLa cells were incubated in medium without amino acids, and transport assays were performed. Quantification of a representative experiment (out of three) is shown. Data are mean ± s.d. of n = 10 fields of cells examined. Transport of VSVG from the ER to the Golgi, P = 0.1419 (NS1), P = 0.3379 (NS2) (q); COPI transport of VSVG–KDELR from the Golgi to the ER, *P = 1.9 × 10⁻⁵, **P = 1.1 × 10⁻⁶ (r); transport of VSVG from the Golgi to the plasma membrane, *P = 1.1 × 10⁻³, **P = 6.6 × 10⁻⁷ (s); transport of transferrin from the early endosome to the plasma membrane, *P = 7.2 × 10⁻⁵, **P = 8.4 × 10⁻⁷ (t); transport of cholera toxin from the plasma membrane to the Golgi, *P = 1.1 × 10⁻⁵, **P = 1.8 × 10⁻⁶ (u); transport of EGF from the plasma membrane to the lysosome, *P = 1.1 × 10⁻², **P = 9.3 × 10⁻⁸ (v); transport of dextran from the plasma membrane to the early endosome, *P = 7.8 × 10⁻³, **P = 1.2 × 10⁻⁸ (w); transport of EGF from the plasma membrane to the early endosome, P = 0.9731 (NS1), P = 0.8159 (NS2) (x). P values determined by two-tailed t-test.
Extended Data Fig. 5 | See next page for caption.
Letter
reSeArCH
Extended Data Fig. 5 | Further characterizing the effects of starvation and GAPDH. a–c, HeLa cells were starved using Hank’s medium (a),
medium lacking glucose (b), or medium lacking amino acids (c), and the total ATP level was measured. Results of one experiment representative of three independent experiments are shown. d, Lactate production, measured in HeLa cells treated as indicated. Results of one experiment representative of three independent experiments are shown. e, Oxygen consumption rate in HeLa cells treated as indicated. Results of one experiment representative of three independent experiments is shown.
f, Relative abundance of glycolytic enzymes in HeLa cells. Data are
derived from https://pax-db.org; glucose-6-phosphate isomerase (https:// pax-db.org/protein/1860535); phosphofructokinase (https://pax-db. org/protein/1852972); fructose-bisphosphate aldolase (https://pax-db. org/protein/1851945); GAPDH (https://pax-db.org/protein/1843185); phosphoglycerate kinase (https://pax-db.org/protein/1848799); phosphoglycerate mutase (https://pax-db.org/protein/1855378); enolase (https://pax-db.org/protein/1850612); pyruvate kinase (https://pax-db. org/protein/1852273). g–n, Transport assays were performed on HEK293 cells that were treated as indicated. Quantification of one representative experiment (out of three) is shown. Data are mean ± s.d. from n = 10 fields of cells examined. Transport of VSVG from the ER to the Golgi,
P = 0.6468 (NS1), P = 0.2133 (NS2) (g); COPI transport of VSVG–KDELR
from the Golgi to the ER, *P = 4.3 × 10⁻⁷, **P = 1.3 × 10⁻³ (h); transport of VSVG from the Golgi to the plasma membrane, *P = 2.1 × 10⁻³, **P = 1.9 × 10⁻⁵ (i); transport of transferrin from the early endosome to
the plasma membrane, *P = 6.3 × 10⁻⁵, **P = 4.7 × 10⁻⁴ (j); transport of cholera toxin from the plasma membrane to the Golgi, *P = 6.5 × 10⁻⁴, **P = 1.5 × 10⁻² (k); transport of EGF from the plasma membrane to the lysosome, *P = 7.8 x 10⁻⁷, **P = 6.5 × 10⁻⁸ (l); transport of dextran from the plasma membrane to the early endosome, *P = 3.6 × 10⁻⁶, **P = 3.4 × 10⁻² (m); transport of EGF from the plasma membrane to the early endosome, P = 0.2375 (NS1), P = 0.5291 (NS2) (n). o–v, Transport assays were performed on HEK293 cells that were treated as indicated. Quantification of a representative experiment (out of three) is shown. Data are mean ± s.d. from n = 10 fields of cells examined. Transport of VSVG from the ER to the Golgi, P = 0.6649 (NS1), P = 0.84 (NS2) (o); COPI transport of VSVG–KDELR from the Golgi to the ER, *P = 4.6 × 10⁻³, **P = 2.5 × 10⁻⁶ (p); transport of VSVG from the Golgi to the plasma membrane, *P = 7.1 × 10⁻⁵, **P = 1.1 × 10⁻⁶ (q); transport of transferrin from the early endosome to the plasma membrane, *P = 7.2 × 10⁻⁶, **P = 6.5 × 10⁻⁹ (r); transport of cholera toxin from the plasma membrane to the Golgi, *P = 5.6 × 10⁻³, **P = 8.8 × 10⁻⁹ (s) transport of EGF from the plasma membrane to the lysosome, *P = 1.1 × 10⁻², **P = 2.9 × 10⁻⁸ (t); transport of dextran from the plasma membrane to the early endosome, *P = 2.4 × 10⁻⁴, **P = 2.4 × 10⁻⁶ (u); transport of EGF from the plasma membrane to the early endosome, P = 0.7924 (NS1), P = 0.4675 (NS2) (v). w, x, HEK293 cells were treated as indicated, followed by starvation and quantification of total ATP level (w) or cell death (x). Data are mean ± s.d. of n = 3 experiments. P values determined by two-tailed t-test.
Extended Data Fig. 6 | See next page for caption.
Letter
reSeArCH
Extended Data Fig. 6 | Inhibition of transport pathways by starvation and AMPK. a–h, HeLa cells were starved using a general starvation
medium (lacking glucose and amino acids), and transport assays were performed. Quantification of a representative experiment (out of three) is shown. Data are mean ± s.d. from n = 10 fields of cells examined. Transport of VSVG from the ER to the Golgi, P = 0.3506 (NS1), P = 0.9126 (NS2) (a); COPI transport of VSVG–KDELR from the Golgi to the ER, *P = 8.6 × 10⁻⁴, **P = 5.8 × 10⁻⁷ (b); transport of VSVG from the Golgi to the plasma membrane, *P = 1.0 × 10⁻⁷, **P = 4.4 × 10⁻⁹ (c); transport of transferrin from the early endosome to the plasma membrane, *P = 4.2 × 10⁻⁵, **P = 4.4 × 10⁻¹⁰ (d); transport of cholera toxin from the plasma membrane to the Golgi, *P = 2.6 × 10⁻⁴, **P = 9.5 × 10⁻⁷ (e); transport of EGF from the plasma membrane to the lysosome, *P = 2.0 × 10⁻⁴, **P = 2.2 × 10⁻¹³ (f); transport of dextran from the plasma membrane to the early endosome, *P = 1.4 × 10⁻⁴, **P = 1.6 × 10⁻⁶ (g); transport of EGF from the plasma membrane to the early endosome, P = 0.1085 (NS1), P = 0.1408 (NS2) (h). i, HeLa cells were treated as indicated and cell lysate was immunoblotted for proteins as indicated. Blot is representative of two independent experiments.
j, HeLa cells were starved, and the COPI transport assay was performed.
Quantification of a representative experiment (out of three) is shown. Data are mean ± s.d. of n = 10 fields of cells examined. *P = 1.1 × 10⁻⁴, **P = 3.5 × 10⁻⁶. k, HeLa cells were treated as indicated and the whole-cell lysate was immunoblotted for proteins as indicated. Representative blot of two independent experiments. l–s, HeLa cells were starved, and transport assays were performed. Quantification of a representative experiment (out of three) is shown. Data are mean ± s.d. from n = 10 fields of cells examined. Transport of VSVG from the ER to the Golgi, P = 0.6077 (NS1),
P = 0.5535 (NS2) (l); COPI transport of VSVG–KDELR from the Golgi to
the ER, *P = 3.5 × 10⁻⁶, **P = 3.6 × 10⁻¹⁰ (m); transport of VSVG from the Golgi to the plasma membrane, *P = 4.1 × 10⁻³, **P = 4.4 × 10⁻⁶ (n); transport of transferrin from the early endosome to the plasma membrane, *P = 3.7 × 10⁻⁶, **P = 1.1 × 10⁻⁹ (o); transport of cholera toxin from the plasma membrane to the Golgi, *P = 7.6 × 10⁻⁴, **P = 8.7 × 10⁻¹¹ (p) transport of EGF from the plasma membrane to the lysosome, *P = 3.1 × 10⁻⁸, **P = 1.3 × 10⁻² (q) transport of dextran from the plasma membrane to the early endosome, *P = 1.1 × 10⁻⁶, **P = 3.7 × 10⁻¹⁰ (r) transport of EGF from the plasma membrane to the early endosome,
P = 0.228 (NS1), P = 0.1738 (NS2) (s). P values determined by two-tailed t-test.
Extended Data Fig. 7 | See next page for caption.
Letter
reSeArCH
Extended Data Fig. 7 | Effects of AMPK on GAPDH distribution and transport pathways. a–e, HeLa cells were treated as indicated,
and then examined for colocalization between GAPDH and different organelle markers. A confocal image from a representative experiment (out of three) is shown. Scale bar, 10 μm (left). quantification is also shown (right). Data are mean ± s.d. of n = 10 fields of cells examined. Colocalization of GAPDH (red) with giantin (green), *P = 2.9 × 10⁻³,
P = 0.6397 (NS) (a); colocalization of GAPDH (red) with TGN46 (green),
*P = 6.5 × 10⁻³, P = 0.6413 (NS) (b); colocalization of GAPDH (red) with EEA1 (green), *P = 3.5 × 10⁻³, P = 0.8793 (NS) (c); colocalization of GAPDH (red) with LAMP1 (green), *P = 9.4 × 10⁻⁴, P = 0.551 (NS) (d); colocalization of GAPDH (red) with Sec61p (green), P = 0.5361 (NS1), P = 0.4243 (NS2) (e). f–m, HeLa cells were treated as indicated, and transport assays were performed. Quantification of a representative experiment (out of three) is shown. Data are mean ± s.d. from n = 10 fields of cells examined. Transport of VSVG from the ER to the Golgi,
P = 0.5250 (NS1), P = 0.8291 (NS2) (f); COPI transport of VSVG–KDELR
from the Golgi to the ER, *P = 4.6 × 10⁻⁵, **P = 2.9 × 10⁻⁸ (g); transport of VSVG from the Golgi to the plasma membrane, *P = 1.4 × 10⁻⁴, **P = 6.9 × 10⁻¹⁰ (h); transport of transferrin from the early endosome to the plasma membrane, *P = 2.0 × 10⁻⁷, **P = 1.0 × 10⁻¹¹ (i) transport
of cholera toxin from the plasma membrane to the Golgi, *P = 4.0 × 10⁻⁴, **P = 3.9 × 10⁻⁸ (j); transport of EGF from the plasma membrane to the lysosome, *P = 7.1 × 10⁻⁴, **P = 4.2 × 10⁻⁸ (k); transport of dextran from the plasma membrane to the early endosome, *P = 1.4 × 10⁻⁷, **P = 1.9 × 10⁻⁹ (l); transport of EGF from the plasma membrane to the early endosome, P = 0.6088 (NS1), P = 0.4061 (NS2) (m). n–u, HeLa cells were treated as indicated, and transport assays were performed. Quantification of a representative experiment (out of three) is shown. Data are mean ± s.d. from n = 10 fields of cells examined. Transport of VSVG from the ER to the Golgi, P = 0.5559 (NS1), P = 0.8576 (NS2) (n); COPI transport of VSVG–KDELR from the Golgi to the ER, *P = 4.1 × 10⁻⁵, **P = 2.3 × 10⁻⁹ (o); transport of VSVG from the Golgi to the plasma membrane, *P = 4.2 × 10⁻³, **P = 6.3 × 10⁻⁵ (p); transport of transferrin from the early endosome to the plasma membrane, *P = 7.2 × 10⁻⁴, **P = 3.7 × 10⁻¹¹ (q) transport of cholera toxin from the plasma membrane to the Golgi, *P = 2.3 × 10⁻⁴, **P = 3.0 × 10⁻⁸ (r); transport of EGF from the plasma membrane to the lysosome, *P = 2.9 × 10⁻³, **P = 5.8 × 10⁻⁶ (s), transport of dextran from the plasma membrane to the early endosome, *P = 2.9 × 10⁻², **P = 1.6 × 10⁻⁸ (t) transport of EGF from the plasma membrane to the early endosome, P = 0.6856 (NS1),
Extended Data Fig. 8 | Further characterizing how AMPK acts on GAPDH. a–e, HeLa cells were treated as indicated, and then examined
for colocalization between GAPDH and different organelle markers. A confocal image from a representative experiment (out of three) is shown (left) and quantified (right). Scale bar, 10 μm. Data are mean ± s.d. from
n = 10 fields of cells examined. Colocalization of GAPDH (red) with
giantin (green), *P = 1.5 × 10⁻⁴ (a); colocalization of GAPDH (red) with TGN46 (green), *P = 2.2 × 10⁻⁴ (b); colocalization of GAPDH (red) with EEA1 (green), *P = 2.1 × 10⁻³ (c); colocalization of GAPDH (red) with LAMP1 (green), *P = 7.1 × 10⁻⁵ (d); colocalization of GAPDH (red) with Sec61p (green), P = 0.9933 (NS) (e). f, Purity of GAPDH forms assessed by Coomassie gel staining. Representative gel from two independent
experiments. g, Purity of AMPK complex assessed by Coomassie gel staining. Representative gel from two independent experiments.
h–j, AMPK was incubated with wild-type GAPDH (h), GAPDH(S122A)
(i), or SAMS, a peptide derived from acetyl-CoA carboxylase (j) in the in vitro kinase assay, and phosphorylation was measured over time. Data are mean ± s.d from a representative experiment of three independent experiments. k, Calculation of the stoichiometry of phosphorylation from the results shown in h–j. l–q, Whole-cell lysates, from HeLa (l–n) or HEK293 (o–q) cells, were treated as indicated and immunoblotted for proteins as indicated. Blots are representative of two independent experiments. P values determined by two-tailed t-test.