A Platform for Simulation of Critical Infrastructures Protection
Li-Jung Kuo
1Chin-Feng Fan
1Swu Yih
2Yung-Yu Kao
11Dept. of Computer Science and Engineering, Yuan-Ze University, Taiwan
2 Dept. of Computer Science and Information Engineering, Ching Yun University, Taiwan
1[email protected] 2[email protected]
Abstract
- Many countries have developed simulation tools to assess the performance of Critical Infrastructure Protection (CIP). But there are no common processes and components to simulate different protection targets. This paper describes a proposed platform for simulation and analysis of critical infrastructure protection. We defined a process along with common components to modularize CIP simulation tools so as to simplify their development. We have applied this platform to the implementation of a simulator for physical infrastructure protection and a simulator for critical materials transportation. These simulators can simulate potential combinations of attack scenarios and compute the probabilities of successful defense. By comparing different scenarios, we can identify the vulnerabilities of the examined CIP, and then improvement can be designed.Keywords: Critical Infrastructures Protection, BBN, EASI model, simulation platform.
1. Introduction
Facilities which provide essential services of our daily life are called Critical Infrastructures (CI), such as power plants, water supply, transportation, etc. Once they are out of service, both security and economy of the society will be affected. Therefore, the protection of critical infrastructures is an important issue. After September 11, 2001 terrorists attacks on the USA, many countries view anti-terrorists attacks as part of national defense. Various kinds of methods and tools were developed to simulate possible attack scenarios on critical infrastructure protection (CIP) and to identify defense vulnerabilities [8]. Generally, CIP may be replaced by the term CIIP (Critical Information Infrastructure Protection) since most critical infrastructures use computers or are connected through network. However, an integrated simulation framework is desired to
evaluate the effectiveness of CIP/CIIP.
Our research proposed a general simulator platform for CIP/CIIP. The platform is suitable for different kinds of critical infrastructures. Three kinds of protection targets are considered: (1) physical critical infrastructure protection, (2) critical materials transportation security, (3) interdependencies between CIs. Our laboratory has conducted related research such as CIIP-CMM [5], interdependencies of multiple critical infrastructures be under attack [6]. This research followed the previous work, and proposed a simulation platform for the above three kinds of CIs. This paper will describe the proposed platform and processes, along with its application to the construction of two simulators, namely a simulator for a physical protection system and a simulator for transportation security.
2. Background
Related background includes CIIP Handbooks [2,3], Morphological Analysis[9], BBN[7], and EASI model[1,4].
2.1. CIIP Handbooks
“International Critical Information Infrastructure Protection (CIIP) Handbook” [2,3] has been referred to as the Bible of the infrastructure protection practices. The handbook provides a CIIP country survey and an overview of related issues including models, methods, and analysis. The first version, published in 2002, addressed national protection activities in eight countries; the 2004 version surveyed fourteen countries; the 2006 version surveyed twenty countries. Current CIIP practices in major countries, along with methods, analysis models, plans, and related legal issues can be found in these handbooks.
2.2. Morphological Analysis
Morphological analysis [9] is an analysis method developed by Swedish astrophysicist, Fritz
Zwicky. This is a systematic combination method which can express all set relations of multi-dimensional, non-quantifiable complex problems. Morphological analysis is an extension of attribute listing method. Imaging that, you have a product. And this product can be made from three possible materials, can be made in six possible shapes, and may use four kinds of mechanical equipment. It has 72 (3x6x4) kinds of combination results in theory. Some of them may already exist, others do not, or are unrealistic. But those do not exist may yield new ideas for products. Morphological analysis is used in our simulation platform to form all the possible combinations of the attacker or the defense profiles.
2.3. BBN
Bayesian Belief Network [7] is an acyclic graph used for modeling and reasoning with uncertainties. Each node in a BBN represents a random variable, whose state is usually expressed in discrete numbers or ranges. Each edge in the graph represents the causal influence between connected nodes. A Conditional Probability Table (CPT) is associated with each node to denote such causal influence. CPT's are filled by experts or inferred from statistical data. Once new evidence is obtained, it can be plugged in the graph to update the states of the related nodes. The calculation is propagated from parent nodes to child nodes and vice versa. A BBN graph can be expanded into an influence diagram by adding decision nodes and utility nodes. Decision nodes are shown by rectangles. Utility nodes, representing costs or profit functions, are depicted by diamonds. Figure 1 is a sample BBN example, whose CPT is shown in Table 1. BBN will be used for computation in our transportation simulator.
Manager capability
Developer capability
Product quality Product performance Training
Training Cost
Fig.1 BBN example
Table 1. Sample CPT for Product quality
Manager capability High Low
Developer capability High Low High Low
Pr(‘Product quality’ =
‘High’) 0.9 0.85 0.35 0.15
Pr(‘Product quality’ =
‘Low’) 0.1 0.15 0.65 0.85
2.4. EASI model
EASI (Estimate of Adversary Sequence Interruption) [1,4] is a model for physical protection developed by Sandia Lab during 1970s. It has been implemented using Microsoft Excel during 1980s. EASI is a path-level model using detection, delay, response, and communication values to compute the probability of interruption (PI). PD is the product of the probability that the
detector will sense abnormal activities by the adversary (PS), the probability that an alarm
indication will be transmitted to an evaluation or assessment point (PT), and the probability of
accurate assessment of the alarm (PA). That is, PD=
PS*PT*PA.. The probability of interruption PI in a
simple case can be PI = PC*PD where PC is
probability of successful communication to the response force. Details can be found [1,4 ]. EASI model computation is used in our physical protection simulator.
3. The Simulation Platform
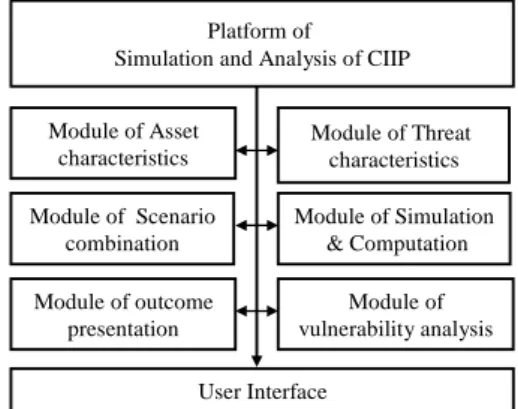
We propose that a generic CIIP/CIP simulator includes the components shown in Fig. 2. First, the platform has two major parts: the user interface part and the computation part. The computation part consists of several modules: asset characteristics, threat characteristics, scenario combination, scenario simulation, outcome presentation, and vulnerability analysis. These components communicate with each other through parameter passing.
Platform of Simulation and Analysis of CIIP
Module of Asset characteristics Module of Threat characteristics Module of Scenario combination Module of Simulation & Computation Module of outcome presentation Module of vulnerability analysis User Interface
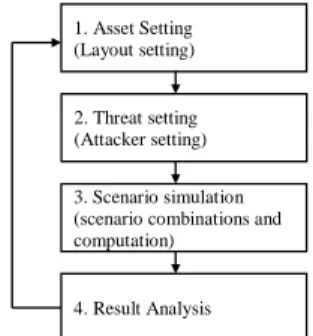
Fig. 2 Model of our simulation platform The process of this simulation platform has four major steps: asset setting, threat setting, scenario simulation, and results analysis. These steps shown in Fig. 3 are explained below.
Step 1 is asset setting. A complete attack scenario includes asset characteristics and attacker profiles. For example, for physical CIP the asset
may include the asset characteristics and its layers of protection elements such as sensors, windows, fences, as well as the guard/police/army man power. Related parameters such as response time or detection time need to be set as input.
1. Asset Setting (Layout setting)
2. Threat setting (Attacker setting) 3. Scenario simulation (scenario combinations and computation)
4. Result Analysis
Fig. 3 The generic process of CIIP simulators
At Step 2, threat setting is also needed as input. There are many kinds of threats including natural disasters, or man-made accidents. We focused on malicious terrorists attacks. Threat factors may include: attacker group size, number of groups, their equipment, vehicles, locations, plans, etc. Potential threat information can be obtained from past cases or expert judgment.
At Step 3, scenario simulation is generated. First all the combination of asset settings and threat settings are produced. We used the morphological analysis to combine all possible defense and attack profiles, with undesired/conflicting pairs deleted. In general, two simulation modes are implemented; that is, a single scenario mode and a production run mode. The former can show detailed progress of the simulation. The later can automatically compute probabilities of all possible scenarios, and identify the best and the worst cases so that the vulnerabilities of the protection can be recognized. In the simulation, related formulae can be used. For example, for the physical CIP simulator, EASI[1,4] formulae can be used. For the transportation case, we use BBN to model the causal relations between input factors.
At the last step, result analysis is performed. After simulation, the user can check information of each attack scenario, such as scenario id, attacker profile, asset layout, and the probability of successful defense. The list of simulated scenarios can be sorted by the probabilities of successful defense. Then, the decision maker may use the information to identify the CIIP’s vulnerabilities and perform modifications. The simulation details are shown in Fig. 4.
Defense Scenario Combination (Morphological Analysis ) Attack Scenario Combination (Morphological Analysis ) Result Assessment Threat Setting Asset Setting
Scenario Combination
Production run Single scenario
Simulation Probability analysis
Fig. 4 Combination and simulation details 4. A Simulator for Critical Materials Transportation
We have applied this platform to the implementation of two simulators, namely, a simulator for critical materials transportation and a simulator for a physical protection system. The former is described first.
This simulator is implemented using Borland C++ Builder 6 along with TMS components and Google Maps API. In the simulator, critical materials, such as chemical materials or nuclear waste, are assumed to be transported by a truck between two locations, and terrorists attacks are to be prevented. The above platform structures and process steps are used.
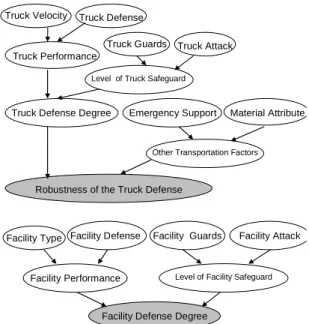
The first step will be asset setting. In this case, inputs are required for the three components: the Truck, the Path, and Facilities along the route. The related factors of the truck include types of its transported materials (explosive, polluting, or non-hazardous), defense power (high, mid, or bad), guards number (some, many), guard attack power (high, mid, or low), and radius with emergency support, as well as truck velocity, etc. A sample of the input screen is shown in Fig. 5. Appropriate formulae can be used in the simulator to calculate probabilities of transport success. Instead, in this tool we used BBNs to do it since there are many related factors, and their relationship may not all be precisely quantitative. Thus, the data in asset settings can be used as the input (starting) nodes to form a BBN to predict the robustness of the truck defense, as shown at the top part in Fig. 6. Conditional Probability Tables (CPTs) are given for calculation. For example, one possible CPT for the node “Truck Defense Degree” can be as that in Table 2, assuming that both internal nodes “level of truck safeguard” and “truck performance” contain two possible values (high, low).
Similarly, characteristics of facilities along the path are also assigned. Facilities refer to such
places like bridges, gas stations, tunnels, police stations, or army camps. It is easier to attack the truck around some of these facilities; and it is more difficult around other facilities. The related factors include facility types, facility defense level, guards, and facility attack power. These factors in turn can be used to determine facility defense degree as shown in Fig. 6.
Path setting is performed on the Google map. The locations of path and facilities are clicked on the map to get a coordinate of latitude and longitude, which will be used to measure the distance for routing. A sample is shown in Fig. 7. In the implementation, besides the source and destination nodes, we also mark intermediate levels of potential nodes; thus, several possible paths can be generated. Routing in Google Maps is used.
The next step is threat setting. The factors include attackers’ weapons, vehicles, defense power, number of attackers, and the attacker location, etc. The factors can also be used as inputs to form a BBN for the degree of impact from the threat, as shown in Fig. 8.
At the simulation step, morphological style of combinations will be used first to form both the potential combinations of attacker profiles and those of defense profiles. A sample of such a morphological analysis is shown in Fig. 9; in which the unneeded combinations are marked with a check mark. BBNs are then used to calculate the probability of successful transportation. The final BBN is shown in Fig. 10. When the truck entered the attack range of an attacker, the truck will be under attack. Every time truck is under
Fig. 5. Truck setting
Truck Velocity Truck Defense
Truck Performance
Truck Guards Truck Attack
Level of Truck Safeguard
Truck Defense Degree Emergency Support Material Attribute
Other Transportation Factors
Robustness of the Truck Defense
Facility Type Facility Defense
Facility Performance
Facility Guards Facility Attack
Level of Facility Safeguard
Facility Defense Degree
Fig. 6 Asset setting used in BBNs
Table 2. CPT for node “Truck Defense Degree”
Level of truck safeguard
high low Truck performance high low high low
high 1.0 0.5 0.5 0.0
low 0.0 0.5 0.5 1.0
Attacker number Weapon
Attack Power
attacker Defense Vehicle
Attacker Defense Degree
Attacker Performance Element Defense Degree
Impact from the Threat
Fig. 8 Impact from the threat
Fig. 9 Morphological analysis
Robustness of the truck defense
Impact from the threat
Successful transportation
Fig. 10 Successful transportation
attack the computation of the BBNs will be performed once. Final success probability is the product of all the attack events; i.e.
∏ = n i i P 0
where
Pi is the success probability of the i-th attack alongthe transportation route.
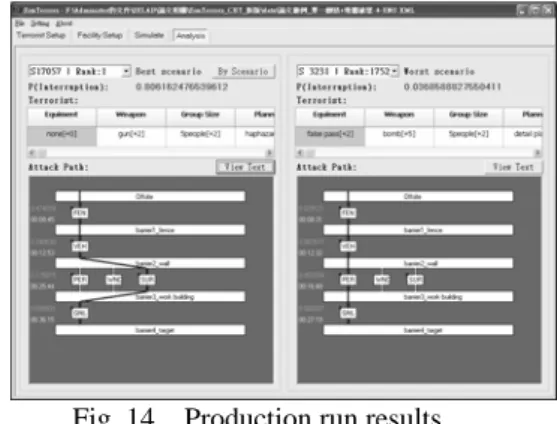
At the single scenario mode, the simulator will show the motion of the entire trip, as shown in Fig. 11. At the production run mode, calculation will be performed at the background. The best and the worst scenarios along with their routes on the map will be shown as results. Figure 12 is the results of a sample run.
There are three factors, namely, threat, truck, and path, which can be varied in this case. If we want to observe one of them, just fix the other two.
Fig. 11 Single scenario mode simulation
Fig. 12. Production run result analysis We have used this simulator to test several hypothetical cases, including transportation of nuclear waste. It yielded reasonable results. For example, the less points to be attacked, the better success probability will be; or, when the attackers are more powerful, the success probability goes down.
5. Physical Protection Simulator
The proposed platform can also be applied to the implementation of a physical critical infrastructure protection system. The CI is assumed to be surrounded by layers of physical protection element such as fence, window, or sensors, etc.
At step 1, asset setting has the similar screen like that in Fig. 5. Every layer has one or more protection elements, such as fence (FEN), vehicle portal (VEH), personal portal (PER), window (WND), and so on, as shown in Fig. 13. The delay time and deviations of these protection elements need to be set as inputs.
At Step 2, we perform threat settings in a similar fashion as that used in the above simulator. Threat setting includes attackers’ weapon,
equipment, group sizes, plans, strategies, etc. Weights for these factors are assigned. Attackers come form outside and try to get through each layer toward the target. Attackers need time to pas each layer; if a sensor on the protection element detects the attacker, the guards must interrupt the attack.
At Step 3, the morphological analysis is performed as that shown in Fig. 9 to generate the combination of attack paths as well as the combination of the attacker profiles. Conflicting pairs are deleted. The attack paths are obtained from the asset setting, i.e., the layers and their protection elements. Then simulation scenarios can be produced by combining the attack paths and the attacker profiles. The number of potential scenarios is the product of the number of attack paths and that of the attacker profiles. The simulator then calls the EASI tool by feeding it with the initial parameters. The EASI tool will output the probability of interruption to the simulator to display. Similarly, both a single scenario mode and a production run mode can be used. Results of a sample production run with the best and worst scenarios are shown in Fig. 14.
Several cases have been run on this simulator successfully. In one sample run, the result indicated a window without sensors is a vulnerable point. Results show that this simulator is quite efficient even with a large amount of attack scenarios. With morphological analysis for scenario combination, some rare/unexpected but dangerous scenarios are reveled.
Fig. 13 A physical protection system
5. Conclusion
This paper described a general platform for CIP/CIIP simulators. A process along with common components was presented to make the development easier. We have applied this platform to the implementation of two simulators. Both simulators work successfully and demonstrate that the proposed platform is general and valid.
However, the computation part of each simulator can be quite different; for example, EASI model versus BBNs. Moreover, the morphological analysis used in scenario generation is effective and systematic; some rare and unexpected weak points are revealed by this approach. Results of these simulators may help decision makers to design further CIP/CIIP improvement.
Fig. 14 Production run results
Acknowledgement
This work was supported in part by National Science Council grant no. NSC 97-2221-E-155-023.
References
[1] H.A. Bennett, “The EASI approach to physical security evaluation,” SAND Report 76500 1977; pp.1-35.
[2] Center for Security Studies (CSSS), ETH Zurich, “International CIIP Handbook 2004,” July 28, 2004.
http://www.isn.ethz.ch/pubs/ph/details.cfm?lng=en& id=452.
[3] Center for Security Studies (CSSS), ETH Zurich, “International CIIP Handbook 2006,” April 4, 2006.
http://www.isn.ethz.ch/pubs/ph/details.cfm?lng=en& id=16156.
[4] L.D. Chapman, and C.P. Harlan, “EASI estimate of adversary sequence interruption on an IBM PC.” SAND Report851105 1985; pp.1-63.
[5] C.W. Chen, S. Yih, C.F. Fan, “Performance Evaluation Model for Critical Information Infrastructure Protection Activities,” ICS 2006, December, 2006.
[6] S.Y. Huang, C. Fan, and S. Yih, “Simulation of Critical Infrastructures Protection,” NCS 2007, pp. 734-741.
[7] F.V. Jensen, An Introduction to Bayesian Networks, Springer, 1996.
[8] P. Pederson, et al., “Critical Infrastructure Interdependency Modeling: A Survey of U.S. and International Research, ” Idaho National Laboratory report INL/EXT-06-11464, August 2006.
[9] T. Ritchey, “Morphological Analysis A general method for non-quantified modeling,” 2006,