A Novel Approach for Handling Missing Values in Microarray Data
Lien-Chin Chen
1Yu-Chia
Lin
1Masanori Arita
2,3Vincent S. Tseng
1,*
1Department of Computer Science and Information Engineering, Institute of Computer Science and Information Engineering,
National Cheng Kung University, Taiwan, R.O.C. 2
Computational Biology Research Center, National Institute of Advanced Industrial Science and Technology,Tokyo 135-0064, Japan,
3
Department of Computational Biology, Graduate School of Frontier Sciences, The University of Tokyo, Kashiwa 277-8561, Japan
[email protected]; smallfat@ idb.csie.ncku.edu.tw; [email protected]; [email protected]
Abstract
- The gene expression microarray is a popular technique to discover significant marker genes for different experimental design. However, missing value may occur during experimental operation or image analysis phase. Effective missing value estimation methods have been proposed to solve the problem. But, most imputation algorithms only consider the expression data in selection process. In this paper, we proposed a novel method, namely Protein and Gene Annotation K Nearest Neighbors (PGAKNN), to impute missing value of microarray gene expression data by using external biological information, like Gene Ontology Semantic Similarity and Ontology-based Protein Similarity between two genes. The experimental results show that PGAKNN provides a higher accuracy of missing value estimation on the two real yeast cDNA microarray datasets.Keywords: Data Mining, Microarray, Gene
Expression Analysis, Missing Value Imputation.
1. Introduction
The cDNA microarray has been widely used in numerous studies over a broad range of biological disciplines including cancer classification. It provides a popular technique to monitor thousands of gene expression level simultaneously under different conditions [6]. There are several applications in microarray analysis such as drug discovery, protein sequencing for instance and identification of genes relevant to a certain diagnosis or therapy [7]. However, microarray gene expression data often contain missing values due to various reasons, e.g. image corruption,
hybridization error, and dust or insufficient1 resolution. It has been proven that missing values may seriously disturb or even prevent the subsequent data analysis [1].
In microarray gene expression analysis, if we ignore or remove the gene expression profile with missing values, then analysis result may not be completed and may lose some interesting information. In the preprocessing phase of microarray analysis, many imputation methods have been developed to recovery the missing values. The concept of imputation of missing values is to provide a predicted value for a missing value based on some known information. These imputation algorithms, such as k-Nearest Neighbor (KNN) [14], Local Least Squares (LLS) [9], Bayesian approach [11], and Gene Ontology k-Nearest Neighbor (GOKNN) [15]. Despite that, all of these imputation algorithms have been shown good performance in dealing with missing values. All of these imputation algorithms, except GOKNN, do not consider biological constraints related to the microarray experiments.
In this paper, we proposed a novel method, namely Protein and Gene Annotation K-Nearest Neighbors (PGAKNN), to impute missing value of microarray gene expression data by using external biological information, like Gene Ontology Semantic Similarity and Ontology-based Protein Similarity between two genes. The semantic similarities of the genes and proteins are calculated by using Gene Ontology (GO) annotations [8]. We combine the semantic similarity with the expression similarity in the KNN imputation algorithm. The results of our imputation algorithm
*
are compared with KNN and GOKNN algorithms under different percent values of missing values on two real yeast micrroarray datasets.
Remaining of this paper is organized as follows. In Section 2, we give a brief review of related work. Our proposed method is shown in details in Section 3. Section 4 shows the experimental results, and the concluding remarks are made in Section 5.
2. Related Work
Given a normalized gene expression matrix, E=[ei,j]m*n, over a set of m genes and n microarray
samples. A missing value αg*,s* is detected in the
position gene g* in sample s*. In this paper, for simplicity of algorithm description, we assume that the target missing value αg*,s* we want to recovery
is in the first position of the first gene.
2.1. The weighted KNN imputation
The weighted KNN-based method, KNNimpute algorithm, imputes missing values by selecting genes with expression profiles similar to the gene of interest [14]. The steps of KNN imputation are as follows.
Step 1: In order to impute the missing value αg*,s*,
KNNimpute algorithm chose k genes that are most similar to the gene g* and with the values in their first positions not missing. In this paper, we take the Euclidian distance method as the similarity measurement to measure the distance between gene g* and other genes.
Given two expression vectors vx = <ex,1,…,
ex,n> and vy = <ey,1,…, ey,n> , the Eculidean
distance between vx and vy can be calculated as
follows:
∑
=−
=
=
n t t y t x y x xydist
v
v
e
e
d
1 2 , ,)
(
)
,
(
(1) Step 2: The missing value is estimated as theweighted average of the corresponding entries, in the first position, in the selected k expression vectors. * , 1 * *, is k i i s g
=
∑
W
×
e
=α
(2)Δ
×
=
)
*,
(
1
i idist
g
g
W
(3) , where∑
==
Δ
k i ig
g
dist
1)
*,
(
.In microarray analysis, the Eculidean distance used by KNN is sensitive to outlier values. A preprocessing of log-transforming the data may
significantly reduce their effects on gene similarity determination [14]. The empirical results have demonstrated by Toyanaska et al. that KNN is insensitive to values of k in the range [14].
2.2. GO-based imputation
2.2.1. Semantic similarity in Gene Ontology
Gene Ontology (GO) is a popular ontology used in Biology. And it provides a structured controlled vocabulary of genes and protein biological roles. It consists of three independent ontologies: 1) molecular function (MF) describes the biochemical activities at the molecular level; 2) biological process (BP) is a series of events accomplished by one or more ordered assemblies of molecular functions and 3) cellular component (CC) identifies the location where a gene product is active in the cell. These three independent ontologies are organized by terms in three directed acyclic graphs (DAG). In other words, each term can have several parent terms and several child terms. Moreover, the terms in the higher and lower layer of ontology structure represent the more general and specific biomedical concepts, respectively. According to the term layer of GO, we can measure the functional similarity between two annotated genes.
The Semantic Dissimilarity algorithm was proposed by Tuikkala et al. [15] to measure the semantic dissimilarity GOSim(gi, gj) between two
gene gi and gj. It consists of four steps as follows:
Step 1: finding the sets ids(gi) and ids(gj) of GO
accession ids (GO ids) for both genes gi and gj
from GO, respectively.
Step 2: for each GO id pair (idi, idj) between ids(gi)
and ids(gj), the set of shared ancestor nodes is
found from the ontology structure.
Step 3: for each GO id pair, the minimum value of the Information Content [13] of shared ancestor nodes is stored in the set P.
Step 4: calculating the mean of P as the final value for semantic dissimilarity of gene gi and gj
[10].
If shared ancestor nodes are not found, then GOSim(gi, gj) = 1. And a smaller semantic
dissimilarity value represents more function similarity on the ontology structure between two annotated genes.
2.2.2. GOKNN imputation
The main goal of GO-based imputation method is to estimate missing gene expression values which are not only close in their expression values but also in function. The GO-based imputation algorithm, namely GOKNN, was proposed by
Tuikkala and his coworker [15]. The combined distance CombSim(g*, gi) is calculated by
combining the Euclidean distance dist(gi, gj) and
the semantic dissimilarity GOSim(gi, gj) between
gene gi and gj.
)
*,
(
)
*,
(
)
*,
(
i i ig
g
dist
g
g
GOSim
g
g
CombSim
×
=
ϖ (4) , where the positive weight parameter ω controls how much the semantic dissimilarity value contributes to the combined distance between the gene g* and gene gi. After all combined similarityvalues are measured with gene g*, the k most similar genes to gene g* will be selected to be applied to the weighted imputation procedure, which is similar to step 2 of KNN imputation in Section 2.1.
2.3. Protein-based imputation
Protein plays an important role in biological domain. Most proteins are annotated by a GO term [2] [3]. The particular functions of a protein in the cell are determined by its amino acid sequence and specific structure which it folds. In addition, it is likely to be affected by other proteins. We calculate the protein similarity [4] [10] between two proteins by using information content (IC). The GO similarity between two proteins, pi and pj,
SimPP(pi, pj), is the average similarity of the GO
terms annotated to them. The similarity measurements between two proteins, one protein and a set of GO terms, and one GO term and a set of GO terms are defined as SimPP(pi, pj),
SimPT(pi,GOT(pj)), and SimTT(ti,GOT(pj)),
respectively, as follows: ( , ) ( , ( )) ( , ( )) 2 i j i j j i SimPP p p
SimPT p GOT p +SimPT p GOT p = (5) ( )
(
,
(
))
( ,
(
))
(
)
x i i j x j t GOT p iSimPT p GOT p
SimTT t GOT p
GOT p
∈=
∑
(6)( ,
(
))
max{
( , ) |
(
)}
i j i y y jSimTT t GOT p
IC t t
t
GOT p
=
∈
(7), where IC(ti,ty) is the information content value
between two GO terms. For more details we refer the reader to [4].
3. The algorithm of PGAKNN
The PGAKNN algorithm consists of three
phases, as shown in Figure 1, 1) Filtering phase, 2) Selection phase, and 3) Imputation phase. In filtering phase, the gene profiles which are with missing values, non-GO-annotated, and non-Protein-annotated information will be filtered out first. And a non-missing and biological informatics dataset is able to be the materials in the following phase. There are three sequential steps in selection phase: i) Distance-based KNN: using distance-based KNN to find s1 size of the most
similar genes (GS1) to gene g* in expression
values, ii) GO-based KNN: for all similar genes gi,
gi∈GS1, calculating the GO-based combined
similarity CombSim(g*, gi) with the genes g* , and
then selecting s2 size of the most similar genes
(GS2), and iii) Protein-based KNN: estimating the
protein-based similarity with the gene g* for each gene in GS2, and keeping s3 size of the most
similar genes (GS3) as the final gene set. Finally,
according to the GS3, an imputation for the missing
value of gene g* in sample s* is then computed as the weighted average, likes Equation (2), by selecting the top k most similar genes in the imputation phase.
Figure 1. The framework of PGAKNN
4. Experimental Evaluation
4.1. Datasets
The two public yeast cDNA microarray datasets are used to evaluate the imputation accuracies of PGAKNN. They are downloaded from the Saccharomyces Genome Database (SGD) website (http://sgdlit.princeton.edu/). The first
dataset, phosphate, is from a phosphate accumulation and polyphosphate metabolism study in Saccharomyces cerevisiae [12]. The second dataset is from a study of temporal gene expression during the metabolic shift from fermentation to respiration in S.cerevisiae [5]. A summary of the characteristics of the two datasets is shown in Table 1.
The GO annotation of genes in the two testing datasets is downloaded from the GO website (http://www.geneontology.org/). The GO annotation of UniProt proteins [2] is collected from the GOA (Gene Ontology Annotation) database [3].
Table 1. The summary of the testing datasets phosphate diauxic M 6015 6068 ' M 5785 5875 ' GO M 5241 5275 ' protein M 5490 5256 N 8 7 A% 90.0 89.7
M is the number of genes in the original data. M' is the number of genes after the filtering phase. MGO' and '
protein M are the number of genes and proteins that have annotations, respectively. N is the number of condition in the testing dataset.
A% is the average percentage of genes with biological
annotations.
4.2. Metric for comparisons
The performance of the missing value estimation is evaluated by the Normalized Root Mean Squared Error (NRMSE) [9]:
2
[(
) ]
[
]
predict known knownmean y
y
NRMSE
std y
−
=
(8) , where ypredict and yknown are the vectors whoseelements are the predict values and the known values, respectively, and std[yknown] is the standard
deviation of the known values.
Moreover, we also investigate the Improvement Rate (IR) of PGAKNN which comparing to traditional kNNimpute (KNN) [14] and GOkNNimpute (GOKNN) algorithm [15].
method PGAKNN method
NRMSE
NRMSE
IR
NRMSE
−
=
(9) , where method∈{KNN, GOKNN}. NRMSEPGAKNNis the NRMSE value of the proposed PGAKNN algorithm.
Table 2 is a summary of parameter setting among the following experiments.
4.3. Experiment 1: the effect of the percent
of missing values
In this experiment, we investigate the effect of various percent values of missing values, which are 1%, 5%, 10%, 15%, and 20%. For example, given a non-missing microarray dataset M' with
m genes under n samples, if the percent of missing value is 20%, then we randomly select m×n×20% elements from the M' to be the missing values.
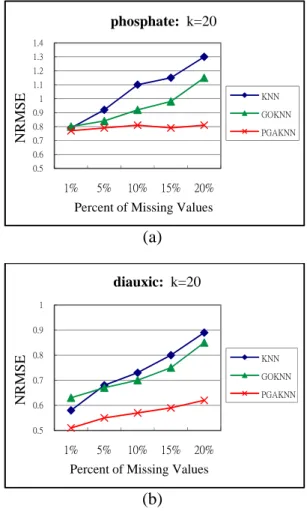
In Figure 2, the NRMSE values are increasing with a high percent of missing values in KNN, GOKNN, and PGAKNN. Nevertheless, the NRMSE value of PGAKNN algorithm is smaller than the results of KNN and GOKNN algorithms. In particular, PGAKNN has a more stable trend of NRMSE values under various percent values of missing values in the phosphate dataset.
(a)
(b)
Figure 2. The effect of the percent of missing
values on (a) the phosphate dataset and (b) the diauxic dataset.
0.5 0.6 0.7 0.8 0.9 1 1.1 1.2 1.3 1.4 1% 5% 10% 15% 20% NR M S E
Percent of Missing Values
phosphate: k=20 KNN GOKNN PGAKNN 0.5 0.6 0.7 0.8 0.9 1 1% 5% 10% 15% 20% NRMS E
Percent of Missing Values
diauxic: k=20
KNN GOKNN PGAKNN
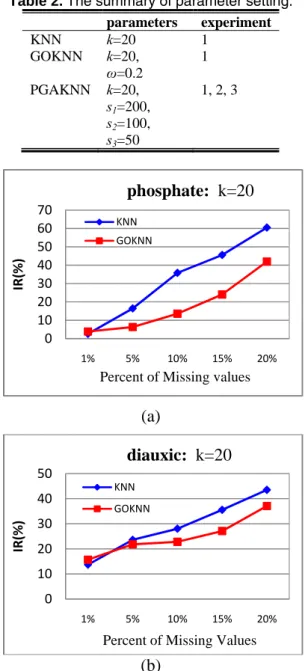
Table 2. The summary of parameter setting. parameters experiment KNN k=20 1 GOKNN k=20, ω=0.2 1 PGAKNN k=20, s1=200, s2=100, s3=50 1, 2, 3
(a)
(b)
Figure 3. The improvement rate (IR) of
NRMSE value for KNN and GOKNN comparing to our PGAKNN method under various percent of missing values.
Figure 3 illustrates the improvement rate (IR) of NRMSE value for KNN and GOKNN comparing to our PGAKNN under various percent of missing values. Overall, we can observe the accuracy of missing value imputation by PGAKNN is better than the other algorithms.
4.4. Experiment 2: the effect of the selection
of the neighborhood size k
Tuikkala et al. [15] suggested that 20 neighbors
are enough for each of their experimental datasets, i.e. k=20. In this experiment, we also investigate the effect of the selection of neighborhood size k in the imputation phase of our PGAKNN algorithm (see Section 3). In the phosphate dataset, we observe the range [17, 21] of the neighborhood size k is the range with best imputation performance. Therefore, in PGAKNN algorithm, we also set the k value to be 20.
Figure 4. The effect of the selection of the
neighborhood size k.
4.5. Experiment 3: the effect of the selection
order of GO and Protein-based KNN
Figure 5 shows the effect of the selection order of GO-based KNN and Protein-based KNN under various percent of missing values. And the result shows it has a better performance by applying GO-based KNN before Protein-based KNN in the diauxic dataset.
Figure 5. The effect of the selection order.
0 10 20 30 40 50 60 70 1% 5% 10% 15% 20% IR( % )
Percent of Missing values
phosphate: k=20
KNN GOKNN 0 10 20 30 40 50 1% 5% 10% 15% 20% IR (% )Percent of Missing Values
diauxic: k=20
KNN GOKNN 0.5 0.6 0.7 0.8 0.9 1 1 5 9 13 17 21 25 29 33 37 41 45 49 NR M S Ethe neighborhood size k
phosphate
PGAKNN 0.5 0.55 0.6 0.65 1% 5% 10% 15% 20% NR M S EPercent of Missing Values
diauxic: k=20 (200-100-50)
GO-->Protein Protein-->GO
5. Conclusions and Future Work
In this paper, we proposed a novel method, namely Protein and Gene Annotation K Nearest Neighbors (PGAKNN), to impute the missing values of microarray gene expression data by using external biological information, like Gene Ontology Semantic Similarity and ontology-based Protein Similarity between two genes. First, the main concept of PGAKNN is to select a set of genes which have similar expression profiles to an interesting gene. Then, we apply a sequential procedure of the biological feature selection. Finally, we can get a set of genes which have similar expression profiles and strong biological relationships with an interesting gene. So, the missing values can be estimated by using the weighted average of final top k most similar genes.
In this study, we used two real yeast microarray dataset, the phosphate and the diauxic, to evaluate the performance of PGAKNN. There are three experiments in the evaluation: 1) the effect of the percent of missing values under various percent of missing values, 2) the effect of the selection of the neighborhood size k, and 3) the effect of the selection order of GO-based KNN and Protein-based KNN. The experiment 1 shows our PGAKNN provides a higher accuracy of missing value imputation than the traditional KNN and GOKNN. The experiment 2 and 3 demonstrate that the k value should be 20 and GO-based KNN should be applied before Protein-based KNN, respectively.
In future work, we will integrate more biological information to impute missing values in microarray datasets.
Acknowledgement
This research was supported by the Landmark Project of National Cheng Kung University and National Science Council, Taiwan, R.O.C., under grant number NSC 96-2221-E-006 -143 -MY3.
References
[1] E. Acuna and C. Rodriguez, The Treatment of
Missing Values and its Effect in The Classifier Accuracy, Classification, Clustering and Data Mining Applications, Springer-Verlag
Berlin-Heidelberg, pp.639-648, 2004.
[2] R. Apweiler, A. Bairoch, C. Wu, W. Barker, B. Boeckmann, S. Ferro, E. Gasteiger, H. Huang, R. Lopez, M. Magrane, M. Martin, D.Natale, C. O’Donovan, N. Redaschi, L. Yeh, “UniProt: the universal protein knowledgebase,” Nucleic Acids
Research, vol. 32 (Databaseissue), pp.D115–D119,
2004.
[3] E. Camon, M. Magrane, D. Barrell, V. Lee, E. Dimmer, J. Maslen, D. Binns, N. Harte, R. Lopez, R. Apweiler, “The Gene Ontology Annotations (GOA) database: sharing knowledge in UniProt with Gene Ontology,” Nucleic Acids Research, vol. 32, pp.262–266, 2004.
[4] F.M. Couto, M.J. Silva, P.M. Coutinho,
“Measuring semantic similarity between Gene Ontology terms,” Data and Knowledge
Engineering, vol.61(1), pp.137-152, 2007. [5] J.L. DeRisi, V.R. Iyer, P.O. Brown, “Exploring the
metabolic and genetic control of gene expression on a genomic scale,” Science, vol. 278, pp.680-686, 1997.
[6] S. Dudoit, Y.H. Yang, M.J. Callow, and T.P.
Speed, “Statistical methods for identifying differentially expressed genes in replicated cDNA microarray experiments,” Statistica Sinica, vol. 12, pp.111-139, 2002.
[7] T.R. Golub, D.K. Slonim, P. Tamayo, C. Huard, M. Gaasenbeek, J.P. Mesirov, H. Coller, M.L. Loh, J.R. Downing, M.A. Caligiuri, C.D. Bloomfield, and E.S. Lander, “Molecular classification of cancer: class discovery and class prediction by gene expression monitoring,” Science, vol. 286, pp.531-537, 1999.
[8] M.A. Harris et al., “The Gene Ontology(GO)
database and informatics resource,” Nuclide Acids
Research, vol. 32, pp. D258-D261, 2004.
[9] H. Kim, G.H. Golub, and H. Park, “Missing value estimation for DNA microarray gene expression data: local least squares imputation,”
Bioinformatics, vol. 21, pp.187-198, 2005.
[10] P.W. Lord, R.D. Stevens, A. Brass and C.A. Goble, “Investigating semantic similarity measures across the Gene Ontology: the relationship between sequence and annotation,” Bioinformatics, vol. 19, pp.1275-1283, 2003.
[11] S. Oba, M. Sato, I. Takemasa, “A Bayesian missing value estimation method for gene expression profile data,” Bioinformatics, vol. 19, pp.2088-2096, 2003.
[12] N. Ogawa, J. DeRisi, P.O. Brown, “New components of a system forphosphate accumulation and polyphosphate metabolism in
Saccharomyces cerevisiae revealed by genomic
expression analysis,” Mol. Biol. Cell, vol. 11, pp.4309-4321, 2000.
[13] P. Resnik, “Semantic similarity in a taxonomy: an information-based measure and its application to problems of ambiguity in natural language,” Artif.
Intelligence Res., vol. 11, pp.95-130, 1999.
[14] O. Troyanskaya, M. Cantor, G. Sherlock, P. Brown, T. Hastie, R. Tibshirani, D. Botstein, R.B. Altman, “Missing value estimation methods for DNA microarrays,” Bioinformatics, vol. 17, pp. 520-525, 2001.
[15] J. Tuikkala, L. Elo, O.S. Nevalainen, T. Aittolallio, “Improving missing value estimation in microarray data with gene ontology,”