DOI: 10.1126/science.1163589
, 1674 (2008);
322
Science
et al.
Kerry Sieh,
Changes Recorded in the Corals of West Sumatra
www.sciencemag.org (this information is current as of September 24, 2009 ):
The following resources related to this article are available online at
http://www.sciencemag.org/cgi/content/full/322/5908/1674
version of this article at:
including high-resolution figures, can be found in the online
Updated information and services,
http://www.sciencemag.org/cgi/content/full/322/5908/1674/DC1
can be found at:
Supporting Online Material
http://www.sciencemag.org/cgi/content/full/322/5908/1674#otherarticles
, 6 of which can be accessed for free:
cites 22 articles
This article
1 article(s) on the ISI Web of Science.
cited by
This article has been
http://www.sciencemag.org/cgi/collection/geochem_phys
Geochemistry, Geophysics
:
subject collections
This article appears in the following
http://www.sciencemag.org/about/permissions.dtl
in whole or in part can be found at:
this article
permission to reproduce
of this article or about obtaining
reprints
Information about obtaining
is a
Science
2008 by the American Association for the Advancement of Science; all rights reserved. The title
Copyright
American Association for the Advancement of Science, 1200 New York Avenue NW, Washington, DC 20005.
(print ISSN 0036-8075; online ISSN 1095-9203) is published weekly, except the last week in December, by the
Science
on September 24, 2009
www.sciencemag.org
rocks rich in organic C relative to carbonate weathering over the past ~13 My (31).
Pre-vious interpretations of87Sr/86Sr,187Os/186Os,
and d7Li records agree with a change in the
nature of weathered material at this time (32).
Many aspects of the biogeochemical Ca2+
cycle need to be constrained better by observa-tional and experimental data and paleoceano-graphic and geologic evidence before a unique interpretation of the causes of the long-term
trend and abrupt transitions in d44/40Caseawateris
possible. Reconstructions of the global CCD
and high-resolution records of seawater Ca2+
concentrations (e.g., from fluid inclusions or other proxies) and of the rate of dolomitization and sea-floor generation are all needed.
Our identification of an abrupt middle
Mio-cene change in the d44/40Caseawaterrecord from
marine barite attests to the dynamic nature of an
element deemed “conservative” in the present
ocean and demonstrates that we cannot assume
that concentrations of Ca2+ in seawater have
been stable over the Cenozoic.
References and Notes
1. H. C. Urey, The Planets, Their Origins and Development (Yale Univ. Press, New Haven, CT, 1952).
2. A. J. Ridgwell, M. J. Kennedy, K. Caldeira, Science 302, 859 (2003).
3. M. I. Budyko, A. B. Ronov, A. L. Yanshin, History of the Earth's Atmosphere (Springer-Verlag, New York, 1987). 4. J. Skulan, D. J. DePaolo, T. L. Owens, Geochim.
Cosmochim. Acta 61, 2505 (1997).
5. P. Zhu, J. D. Macdougall, Geochim. Cosmochim. Acta 62, 1691 (1998).
6. T. K. Lowenstein, M. N. Timofeeff, S. T. Brennan, L. A. Hardie, R. V. Demicco, Science 294, 1086 (2001). 7. J. Horita, H. Zimmermann, H. D. Holland, Geochim.
Cosmochim. Acta 66, 3733 (2002). 8. J. A. D. Dickson, Science 298, 1222 (2002). 9. P. A. Sandberg, Nature 305, 19 (1983). 10. L. A. Hardie, Geology 24, 279 (1996). 11. H. D. Holland, Am. J. Sci. 305, 220 (2005).
12. C. P. Conrad, C. Lithgow-Bertelloni, Geology 35, 29 (2007). 13. The Ca-isotopic composition of a sample is expressed as
the deviation from a standard solution value, using
d-notation in per mil: d44/40
Ca = [(44 Ca/40 Casample– 44 Ca/40Castandard) / 44
Ca/40Castandard] × 1000, where 44
Ca/40
Castandardrefers to the 44
Ca/40
Ca isotopic ratio of seawater.
14. C. L. De La Rocha, D. J. DePaolo, Science 289, 1176 (2000). 15. A. D. Schmitt, F. Chabaux, P. Stille, Earth Planet.
Sci. Lett. 213, 503 (2003).
16. N. G. Sime et al., Geochim. Cosmochim. Acta 71, 3979 (2007).
17. N. Gussone et al., Geochim. Cosmochim. Acta 69, 4485 (2005).
18. M. Amini et al., Geochim. Cosmochim. Acta 72, 4107 (2008). 19. A. Heuser et al., Paleoceanography 20, 10.1029/
2004PA001048 (2005).
20. M. S. Fantle, D. J. DePaolo, Earth Planet. Sci. Lett. 237, 102 (2005).
21. J. Farkaš et al., Geochim. Cosmochim. Acta 71, 5117 (2007).
22. A. Paytan, M. Kastner, E. E. Martin, J. D. Macdougall, T. Herbert, Nature 366, 445 (1993).
23. A. Paytan, M. Kastner, D. Campbell, M. H. Thiemens, Science 304, 1663 (2004).
24. A. V. Turchyn, D. P. Schrag, Science 303, 2004 (2004). 25. E. M. Griffith, E. A. Schauble, T. D. Bullen, A. Paytan,
Geochim. Cosmochim. Acta 72, 5641 (2008). 26. Range of parameters measured include conditions
relevant to the ranges for the measured samples (DSDP-ODP sites): Holocene core-top sample sites include the average annual temperature in the upper 700 m of the water column, where the majority of marine barite is thought to precipitate, 1 to 14°C; the depth of each core-top location, 3175 to 4431 m; water column barite saturation at sea floor, SI = 0.6 to 0.8 and at 700 m, SI = 0.8 to 1.2; average upper (700 m) water column: salinity (34.2 to 34.9), carbonate concentration (86.65 to 139.56 mmol/kg), and dissolved oxygen concentration (1.1 to 6.2 ml/l); bulk sedimentation rate (1.3 to 2.7 cm/thousand years) and barite accumulation
rates (0.7 to 23.4 mg m–2year–1).
27. Materials and methods are available as supporting material on Science Online.
28. A constant residence time in the model requires that
the output flux of Ca2+
and the total amount of dissolved
Ca2+
in the oceans vary together. This is a valid
assumption if changes in Ca2+
concentration occurred
due to changes in the input flux of Ca2+
to the ocean that
are not accompanied with changes in the C cycle. If a
change in Ca2+
input flux was associated with and
compensated by a change in CaCO3sedimentation
through an increase in alkalinity, no change in Ca2+
concentration would result. Increasing or decreasing the residence time by 50% gives similar fluctuations but different magnitudes (peak concentrations range from 180% to 290% of present values) (fig. S5). Modeling the
Ca2+
system with full carbonate chemistry reveals the
sensitivity of the Ca2+
cycle to changes in C on long time scales (>10,000 years) (27). A mechanism for decoupling the two cycles is required in order to result in changes in
Ca2+
concentration. These might include changes in the rate of dolomitization or the Ca:bicarbonate ratio in the riverine flux due to shifts in the weathering regime. 29. A. Holbourn, W. Kuhnt, M. Schulz, H. Erlenkeuser, Nature
438, 483 (2005).
30. M. Lyle, Paleoceanography 18, 10.1029/2002PA000777 (2003).
31. D. A. Hodell, P. A. Mueller, J. A. McKenzie, G. A. Mead, Earth Planet. Sci. Lett. 92, 165 (1989).
32. E. C. Hathorne, R. H. James, Earth Planet. Sci. Lett. 246, 393 (2006).
33. L. Lourens, F. Hilgen, N. J. Shackleton, J. Laskar, D. Wilson, in A Geological Time Scale 2004, F. Gradstein, J. Ogg, A. G. Smith, Eds. (Cambridge Univ. Press, Cambridge, UK, 2004), pp. 409–440.
34. Generated using a smoothing parameter (P = 0.80) and data weighted by its precision in the MATLAB 7.6.0.324 (R2008a) cubic smoothing spline function csaps. 35. J. Zachos, M. Pagani, L. Sloan, E. Thomas, K. Billups,
Science 292, 686 (2001).
36. Samples provided by the Integrated Ocean Drilling Program. We thank A. Eisenhauer, J. Fitzpatrick, W. A. Griffith, R. Jones, and G. Li for analytical assistance. Supported by NSF CAREER Grant OCE-0449732 (A.P.) and by a National Defense Science and Engineering Graduate Fellowship and an NSF Graduate Research Fellowship (E.M.G.).
Supporting Online Material
www.sciencemag.org/cgi/content/full/322/5908/1671/DC1 Materials and Methods
Figs. S1 to S7 Table S1 References
22 July 2008; accepted 7 November 2008 10.1126/science.1163614
Earthquake Supercycles Inferred from
Sea-Level Changes Recorded in the
Corals of West Sumatra
Kerry Sieh,1* Danny H. Natawidjaja,2Aron J. Meltzner,1Chuan-Chou Shen,3
Hai Cheng,4Kuei-Shu Li,3Bambang W. Suwargadi,2John Galetzka,1
Belle Philibosian,1R. Lawrence Edwards4
Records of relative sea-level change extracted from corals of the Mentawai islands, Sumatra, imply that this 700-kilometer-long section of the Sunda megathrust has generated broadly similar sequences of great earthquakes about every two centuries for at least the past 700 years. The moment magnitude 8.4 earthquake of September 2007 represents the first in a series of large partial failures of the Mentawai section that will probably be completed within the next several decades.
L
arge sections of the great arcuate faultbe-neath the eastern flank of the Indian Ocean have failed progressively over the past 8 years in an extraordinary sequence of big
earth-quakes (Fig. 1) (1–4). The largest of these failures
of the Sunda megathrust, in 2004, caused the most devastating tsunami the world has seen in many generations. One question of great humanitarian and scientific importance is which remaining unruptured sections of the megathrust will fail next.
Until late 2007, the largest remaining un-broken Sumatran section had been the 700-km-long Mentawai patch, dormant since two great earthquakes in 1797 and 1833 (5). Modeling of coral and instrumental geodetic data had shown most of the patch to have been highly coupled throughout at least the past half-century (6, 7). That is, overlying and underlying blocks have been locked together, and strains continue to accumulate. These observations had led to con-cerns that the remainder of the Mentawai patch
might rupture soon (8–11). In September 2007,
rapid-fire failure of portions of the Mentawai
patch produced a moment magnitude (Mw) 8.4
earthquake and several large aftershocks (12),
which served to further elevate anxiety.
1Tectonics Observatory, California Institute of Technology, Pasadena, CA 91125, USA.2Research Center for Geotechnol-ogy, Indonesian Institute of Sciences, Bandung, Indonesia. 3
Department of Geosciences, National Taiwan University, Taipei, Taiwan, ROC.4Department of Geology and Geophysics, University of Minnesota, Minneapolis, MN 55455, USA. *To whom correspondence should be addressed at the Earth Observatory of Singapore, Nanyang Technological University, 639798 Singapore. E-mail: sieh@ntu.edu.sg
on September 24, 2009
www.sciencemag.org
This paper shows that the history of the Mentawai section through the past few hundred years implies that the next large failure is likely to occur within the next few decades. We have ex-tracted that history of strain accumulation and re-lief from corals on the fringing coral reefs directly above locked parts of the Sumatran megathrust.
Corals, growing just below the intertidal zone, record in their upper surfaces a history of local
sea level (5, 7, 13–15). Annual lowest tidal
levels limit the highest levels to which the coral
colonies can grow (3), termed the highest level
of survival (HLS) (13). Flat-topped pancake-like
heads record sea-level stability. Heads with HLS surfaces that rise toward colony perimeters re-flect rising sea levels during their decades of growth. This morphology inspired the name “microatolls” (16), diminutive analogs of Darwin’s slowly drowning tropical islands that are
or-namented with an outer band of living coral reef (17). Changes in sea level recorded in microatoll HLS history reflect the lowering and raising of the islands in the course of elastic strain accu-mulation and relief. U-Th disequilibrium dating of coral can yield errors for uplift during
earth-quakes of just a few years (18–20).
Three paleoseismic sites, spanning 110 km of the Mentawai patch in the source region of the September 2007 earthquakes (Fig. 1 and fig. S1), show that major episodes of emergence (21) have occurred four times in the past 700 years.
At Bulasat, the first of the four emergences
occurred in 1347 T 18, the date of death of
microatolls living at this and the Saomang site, a few kilometers to the south (Fig. 2A) [support-ing online material (SOM), includ[support-ing figs. S1 to S7]. Undisturbed microatolls of this vintage rest at an elevation about 110 to 120 cm above our arbitrary datum, HLS in 2002.
The next emergence event occurred in
1607T 4, after decades of rapid submergence.
Direct evidence for emergence in 1797 is not preserved in the corals at the Bulasat site. How-ever, two microatolls at nearby Saomang (SOM,
including figs. S8 to S10) document relative sea-level rise of about 9 mm/year through part of the 17th and 18th centuries. These time series constrain the magnitude of uplifts in 1797 and 1833. Also, a microatoll at Saomang that died in 1833 yields a record for the early 19th century.
This series’ lack of colinearity with the records
from the early 1700s reveals at least one emer-gence between about 1730 and 1810 (Fig. 2A). The most plausible date is 1797, the date of a historical large earthquake that is also clear in
paleoseismic records at nearby sites (5).
Extrap-olation of these records implies emergence of about 1 m in 1797.
A living microatoll and continuous global positioning system (GPS) station at Bulasat yield comparable modern subsidence rates of ~13 and 15 mm/year. The GPS station recorded uplift of
73 cm during the September 2007Mw 8.4 and
7.9 earthquakes (table S1B).
The Bulasat time series (Fig. 2A) resembles a saw blade. The tip of each sawtooth is the date of an emergence that presumably relates to a large earthquake, as in 2007. The back of each tooth is a ramp that slopes down to the date of the
5˚S 0˚ 5˚N 95˚E 105˚E
M 8.4
M 7.9
M 7.0
M 8.4
M 8.4
M 7.9
M 7.9
M 7.0
M 7.0
M 7.0
M 7.0
2007
2007
2007
2004
2004
M 9.2
M 9.2
2004
M 9.2
2004
2004
M 9.2
M 9.2
2004
2004
M 9.2
M 9.2
S U M
A
T R
A
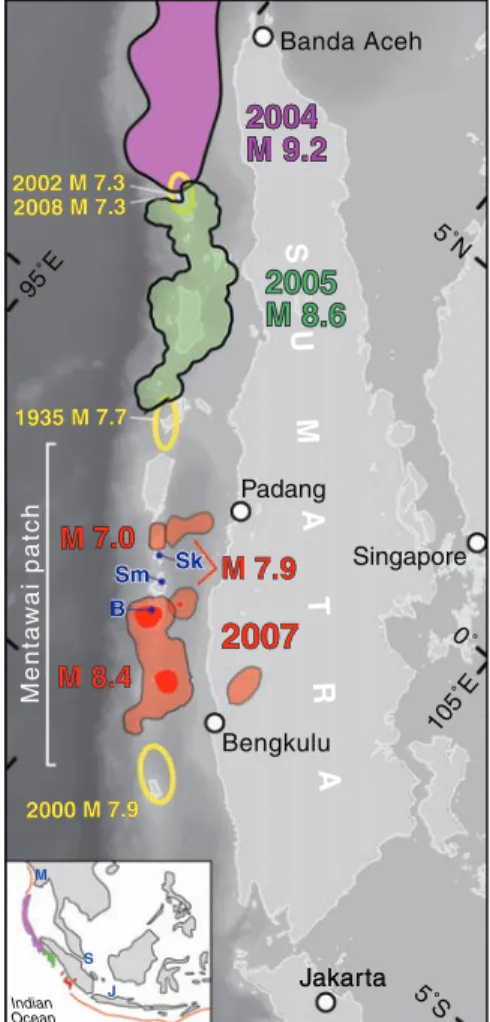
Padang Singapore Bengkulu Jakarta Jakarta Banda Aceh Menta w ai patch 1935 M 7.7 1935 M 7.7 2002 M 7.3 2002 M 7.3 2008 M 7.3 2008 M 7.3 2000 M 7.9 2000 M 7.9 B Sm Sm SkSk B Sm Sk J M S Indian OceanFig. 1. Recent seismic ruptures of the Sunda megathrust, offshore of Sumatra, delineate highly coupled large (pink, green, and orange) and weak-ly coupled small (yellow) patches. The September 2007 sequence involved partial rupture of the Mentawai patch, which last broke in 1797 and 1833. B (Bulasat), Sm (Simanganya), and Sk (Sikici) indicate principal paleoseismic sites. Adapted from
(1, 3, 5, 12, 15). (Inset) M, S, and J are Myanmar,
Singapore, and Java. The red line is the Sunda megathrust. 1675 ± 13 1596 ± 13 1607 ± 4 1613 ± 29 1543 ± 23 1560 ± 3 1347 ± 18 1374 ± 16 1381 ± 9 1797 1833 2007 1300 1350 1400 1450 1500 1550 1600 1650 1700 1750 1800 1850 1900 1950 2000 CE 0 -200 -100 100 13 ± 1 11 ± 2 9.3 ± 1 14.6 ± 2 11.5 ± 2 320 ± 60 (cumulative) 150 ± 25 110 ± 21 250 ± 50 73 3.1°S, 100.3°E BULASAT A A -100 0 100 8.3 ± 1.2 4.8 ± 0.9 6.3 ± 0.4 7.1 ± 0.6 170 ± 20 120 ± 30 10 ± 5 130 ± 30 0 2.6°S, 100.1°E SIMANGANYA B B -100 0 100 ? ? ? ? 4.4 ± 1 4.6 ± 1 3.6 ± 0.2 3 ± 0.4 110 ± 16 80 ± 12 20 ± 5 1 2.3°S, 99.8°E SIKICI C C 1.8 1.2 1.6 Year (AD) Relativ e Sea Le v el (cm) Events Supercycle 1 2 3 4
Fig. 2. Histories of interseismic submergence and coseismic emergence through seven centuries at sites (A) Bulasat, (B) Simanganya, and (C) Sikici. Data constrain solid parts of the curves well (fig.
S4); dotted portions are inferred. Emergence values (in centimeters T 2s) are red. Interseismic
submergence rates (in millimeters per year,T 2s) are blue. Millennial emergence rates are black.
Vertical dashed white lines mark dates of emergences. Red arrows at bottom highlight the timing of the failure sequence for each supercycle.
on September 24, 2009
www.sciencemag.org
previous earthquake. For the most part, the microatolls document the sloping part of the tooth for only a few decades before the earth-quakes. The lack of data immediately after large earthquakes is a consequence of coseismic eleva-tion of the entire reef flat above low tide levels
if emergence is greater than about 1 m (22). At
an interseismic submergence rate of 10 mm/year, one century is needed to bring each vertical meter of the reef flat back below low tide levels and able once again to support coral growth. Thus, we cannot rule out the possibility that the 3.2-m emergence of Bulasat in the mid- to late 1300s could have occurred in more than one closely timed event.
To estimate the magnitude of the pre-instrumental emergences, we extrapolate the in-terseismic subsidence rates back to the dates of the events (dotted sloping lines in Fig. 2A). Coseismic emergences are probably larger than the values given by linear extrapolation, because transient postseismic vertical deformation is com-monly opposite in sign to the coseismic signal (23). However, this correction would probably be small; subsidence at GPS stations that rose 1.7 to 3 m during the great Nias-Simeulue
mega-thrust earthquake of 2005 has been only about 1% of the uplift value. And during the 6 months after the 73 cm of uplift in September 2007, only 2 cm of subsidence occurred at Bulasat.
The Simanganya site is about 60 km north-west of Bulasat, on the northeastern coast of North Pagai island (Fig. 1) (SOM, including figs. S11 to S24). The records at Simanganya and Bulasat are strikingly similar but not iden-tical (Fig. 2).
The oldest large field of microatolls at Simanganya died late in the 14th century (Fig. 2B). The weighted mean date of death of five
colonies is 1381T 9. This emergence appears
to have occurred about one to six decades later than emergence at Bulasat.
The record of events around 1600 is compli-cated. Discordant elevations of 16th-century mi-croatolls hint at significantly variable settling due to seismic shaking at the site. Thus, we use the elevation of the highest microatoll to infer sea
level at the time of the first emergence, 1560T 3.
Two microatolls constrain the magnitude of emergence to ~20 cm. The longest-lived
mi-croatoll records a large emergence in 1613T 29,
preceded by two small emergences of ~10 and
>10 cm about 5 and 25 years earlier. Thus, Simanganya experienced three small emer-gences in the decades before the big event of about 1613.
One of the Simanganya microatolls records emergences that we associate with the 1797 and
1833 earthquakes (5). Its internal stratigraphy
im-plies that emergence was about 10 cm in 1797. A modern specimen yields a record of submer-gence for the latter half of the 20th century. Linear extrapolation of this record back in time yields ~1.7 m of emergence in 1833. During the seismic episode of September 2007, vertical de-formation at Simanganya was nil (table S1A).
At Sikici, on the northeast coast of Sipora island, large emergences occurred in the late 14th century, late in the 16th century, late in the 17th century, and in 1833 and 2007 (Fig. 2C) (SOM, including figs. S25 to S41).
Evidence for emergence in ~1374 appears in three microatolls that represent a large population. Although we chose these three colonies because of their relatively high degree of preservation and their nearly flat, untilted upper surfaces, the tops of these microatolls vary by tens of centimeters in elevation. This implies that their substrate
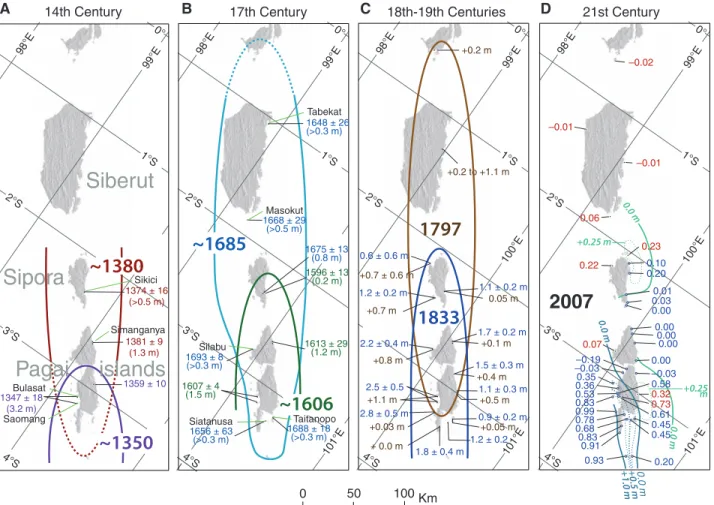
Fig. 3. Four emergence episodes of the past seven centuries. Each episode consists of more than one major event. (A and B) Emergence amounts are below
the year of emergence (T2s); colors indicate proposed event correlations. (C)
Emergences attributed to the 1797 and 1833 earthquakes are brown and blue,
respectively. (D) Uplift values for the 12 to 13 September 2007 sequence are red (GPS) and blue (coral). Contours of uplift in blue and green show the amounts
attributable to theMw8.4 andMw7.9 events, respectively (SOM, including table
S1). The 2007 events probably herald the beginning of the next failure sequence.
on September 24, 2009
www.sciencemag.org
compacted to different degrees (fig. S4 and arrows in Fig. 2C). Compaction probably occurred dur-ing the seismic shakdur-ing associated with emer-gence, because younger microatolls do not display large elevation differences within their popula-tions. The differing elevations of the 14th-century microatolls mean that we can say only that the original elevation of the population relative to modern sea level was at least as high as the highest colony.
Eight sampled Sikici microatolls record events of the 16th and 17th centuries. The best-preserved and dated records show slow sea-level rise from
~1480 to 1590, ~20 cm of emergence in 1596T
13, and a subsequent 80 years of sea-level stability, followed by another large emergence in
1675T 13. The living outer perimeters of four of
the colonies were too thin to survive the 20-cm emergence of ~1596. The best-preserved of these four also show a small (6 cm) emergence 12 to 15 years before death. Such a small emergence could be tectonic, but an oceanographic cause is also plausible.
The 1797 and 1833 events appear in one
sam-ple (5). A 10-cm emergence 36 years before death
appears to represent emergence in 1797. Extrap-olation of a 4.4 mm/year rate of submergence from a modern microatoll (7) implies about 1.1 m of emergence in 1833. Within error, the
magni-tude of uplift (1T 6 cm) in September 2007 is nil
(table S1A).
A few other localities also yielded useful, though shorter and less complete, records. Those that help constrain the 1797 and 1833 events are
described in (5). Six others assist in piecing
to-gether the record before 1797 (SOM, including fig. S1).
The broadly similar sea-level histories of Bulasat, Simanganya, and Sikici imply similar histories of strain accumulation and relief on the underlying megathrust. Throughout the past seven centuries, all three sites have experienced interseismic submergence punctuated by corre-lated episodes of rapid emergence that are com-plex in both space and time.
The first emergence episode comprised two events, which occurred first at Bulasat and a decade or so later at the other two sites (Figs. 2 and 3A). The next episode began in ~1560 with a small emergence at Simanganya (Fig. 2B). In about 1600, all three sites rose suddenly (Figs. 2 and 3B). The largest emergence at Sikici was much later, ~1680. Emergence also occurred at about this time at Silabu, Siantanusa, and Taitanopo but could not have been more than about 10 cm at Saomang. Simanganya may also
have risen in ~1680, but the reef there might have still been too far out of the water to allow corals to be growing on the reef flat. Two microatolls (figs S42 and S43) suggest that this event extended as far north as Masokut and Tabekat.
Zones of emergence associated with both the great 1797 and 1833 earthquakes span all three major sites (Figs. 2 and 3C), but emer-gence in 1797 is much less than in 1833. Up-lift in 2007 was 73 cm at Bulasat but nil at the other two sites.
Because each of the three past episodes of emergence consists of two or more discrete events, we refer to the broad periods of strain accumulation and relief as supercycles rather than merely cycles (Fig. 2). The corals record only the last few decades of supercycle 1 and only the strain-accumulation phase and initial part of the strain-relief phase of supercycle 4, but they capture all of supercycles 2 and 3.
At each site, emergence over each super-cycle varies by no more than 40% (about 1 to 1.2 m at Sikici, 1.2 to 1.8 m at Simanganya, and 1.5 to 3.6 m at Bulasat). Sites with high emergence values are also sites with high rates of interseismic submergence. The largest events at each site are the last events in their failure sequence.
Emergences in 1797, 1833, and 2007 (Figs. 3C and 3D) are well-enough known to model the locations and magnitudes of slip on the mega-thrust. Tilt of the islands away from the trench implies megathrust ruptures under the islands that extend updip to the west (5, 12). The sim-ilarity of emergence values in 1797, 1833, and 2007 to those in earlier centuries suggests that megathrust slip in the earlier episodes was also centered beneath and west of the islands.
At each site, rates of interseismic submer-gence show little variation from supercycle to supercycle. This implies that the pattern of coupling (locking) on the megathrust defined by 20th-century coral and GPS data (6, 7) has persisted through the interseismic periods of the past several supercycles. The only major excep-tion is Sikici’s flat interseismic curve between ~1600 and 1680. This aberration may imply that the megathrust beneath Sikici was largely de-coupled during those eight decades.
At least two of the three ancient failure se-quences began with events that were smaller than their culminating events. Moreover, the mega-thrust rupture of September 2007 is far smaller than the amount of potential slip that has accu-mulated since the 1797-1833 couplet (Fig. 4 and fig. S44).
Failure initiation by smaller ruptures and the emergence of individual sites during both these and culminating large events imply either structural or rheological heterogeneity of the megathrust. As stresses approach failure levels, patches that are slightly more prone to failure yield first. The size of these patches may limit slip to less than the full 10 m or so of ac-cumulated potential slip. Years or decades later, when the stronger patches fail, the remaining potential slip on the weaker patches is relieved in concert with slip on the stronger patches (Fig. 4 and fig. S44A). Thus, the culminating large earth-quake has a larger magnitude than the initiating large earthquake. Because smaller earthquakes
have also preceded some (24, 25), though not all,
large modern ruptures elsewhere, this mechanism may commonly apply.
The 700-year record of Sumatran megathrust
supercycles implies that theMw8.4 earthquake
of 2007 was the beginning of an episode of failure of the Mentawai patch. If previous cycles are indicative of the one now in progress, the earthquakes of 2007 will turn out to be smaller than the culminating earthquake of supercycle 4. In fact, the amount of potential slip that was not relieved in September 2007 is enough to
generate aMw8.8 earthquake.
This event would generate widely distributed strong seismic shaking in western Sumatra and would undoubtedly produce great damage in Padang and neighboring cities and villages. More-over, models based on the rupture of rectangular sources under the Mentawais yield tsunami with several meters of overland flow depth along the coast at Padang and Bengkulu and 1 km or so of inundation distance (26). These results imply that losses of life and property could equal or exceed those in Aceh province in 2004.
Over the past 700 years, three episodes of emergence lasted variously from a few decades to a little over a century. This past variability precludes a precise empirical forecast of the next great earthquake and tsunami. Nonetheless, to
those living in harm’s way on the coasts of
west-ern Sumatra, it should be useful to know that the next great earthquake and tsunami are likely to occur within the next few decades, well within the lifetimes of children and young adults living there now.
References and Notes
1. M. Chlieh et al., Bull. Seismol. Soc. Am. 97, S152 (2007). 2. H. R. DeShon, E. R. Engdahl, C. H. Thurber, M. Brudzinski,
Geophys. Res. Lett. 32, L24307 (2005). 3. R. W. Briggs et al., Science 311, 1897 (2006). 4. R. E. Abercrombie, M. Antolik, G. Ekström, J. Geophys.
Res. 108, 2018 (2003).
5. D. H. Natawidjaja et al., J. Geophys. Res. 111, B06403 (2006). 6. M. Chlieh, J.-P. Avouac, K. Sieh, D. H. Natawidjaja,
J. Galetzka, J. Geophys. Res. 113, B05305 (2008). 7. D. H. Natawidjaja et al., J. Geophys. Res. 112, B02404
(2007).
8. K. Sieh, paper presented at the International Workshop on Tectonics of Plate Convergence Zones: Toward the Seamless Understanding from Earthquake Cycles to Geomorphic Evolution, University of Tokyo, Tokyo, Japan, 28 to 29 September 2006.
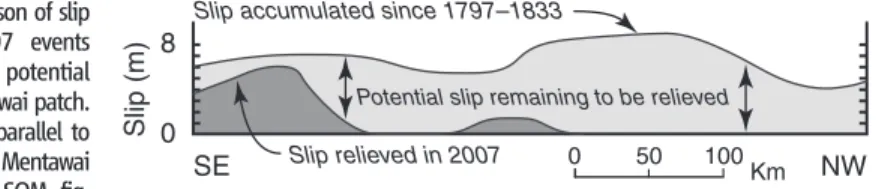
Fig. 4. Comparison of slip during the 2007 events and remaining potential slip on the Mentawai patch. The long axis is parallel to and through the Mentawai island chain. See SOM, fig.
S44, and (12) for more details.
0 50 100 Km 0 8 Slip (m) SE NW
Potential slip remaining to be relieved Slip accumulated since 1797–1833
Slip relieved in 2007
on September 24, 2009
www.sciencemag.org
9. K. Sieh, Philos. Trans. R. Soc. London Ser. A 364, 1947 (2006).
10. K. Sieh, paper presented at the First International Conference of Aceh and Indian Ocean Studies, Banda Aceh, Indonesia, 24 to 26 February 2007. 11. K. Sieh, J. Earthquake Tsunami 1, 1 (2007). 12. O. Konca et al., Nature 456, 631 (2008). 13. J. Zachariasen, K. Sieh, F. W. Taylor, R. L. Edwards,
W. S. Hantoro, J. Geophys. Res. 104, 895 (1999). 14. J. Zachariasen, K. Sieh, F. W. Taylor, W. S. Hantoro,
Bull. Seismol. Soc. Am. 90, 897 (2000).
15. D. H. Natawidjaja et al., J. Geophys. Res. 109, B04306 (2004).
16. D. R. Stoddart, T. P. Scoffin, Atoll Res. Bull. 224, 1 (1979). 17. C. Darwin, The Structure and Distribution of Coral Reefs
(Smith, Elder and Co., London, 1842).
18. R. L. Edwards, F. W. Taylor, G. J. Wasserburg, Earth Planet. Sci. Lett. 90, 371 (1988).
19. C.-C. Shen et al., Geochim. Cosmochim. Acta 72, 4201 (2008).
20. C.-C. Shen et al., Chem. Geol. 185, 165 (2002).
21. We use the terms“submergence” and “emergence”
throughout to refer to changes with respect to a
sea-level datum. We use“subsidence” and “uplift” in
reference to other geodetic data and when inferring vertical tectonic motions.
22. K. Sieh, Nature 434, 573 (2005). 23. Y.-J. Hsu et al., Science 312, 1921 (2006). 24. K. Sieh, M. Stuiver, D. Brillinger, J. Geophys. Res. 94,
603 (1989).
25. G. Carver et al., Bull. Seismol. Soc. Am. 94, S58 (2004). 26. J. C. Borrero, K. Sieh, M. Chlieh, C. E. Synolakis, Proc.
Natl. Acad. Sci. U.S.A. 103, 19673 (2006). 27. This work has been supported by NSF grants
EAR-9628301, 9804732, 9903301, 0208508, 0530899, 0538333, and 0809223 (to K.S.) and EAR-0207686
and 0537973 (to R.L.E.); by National Science Council grants 94-2116-M002-012 and 95&96-2752-M002-012-PAE (to C.-C.S.); by LIPI (Indonesian Institute of Science) and RUTI (International Joint Research Program of the Indonesian Ministry of Research and Technology); and by the Gordon and Betty Moore Foundation. This is Caltech Tectonics Observatory contribution number 86 and Earth Observatory of Singapore contribution number 1.
Supporting Online Material
www.sciencemag.org/cgi/content/full/322/5908/1674/DC1 SOM Text
Figs. S1 to S44 Tables S1 to S4 References
22 July 2008; accepted 8 October 2008 10.1126/science.1163589
Shock Metamorphism of Bosumtwi
Impact Crater Rocks, Shock
Attenuation, and Uplift Formation
Ludovic Ferrière,1Christian Koeberl,1* Boris A. Ivanov,2Wolf Uwe Reimold3
Shock wave attenuation rate and formation of central uplifts are not precisely constrained for moderately sized complex impact structures. The distribution of shock metamorphism in drilled basement rocks from the 10.5-kilometer-diameter Bosumtwi crater, and results of numerical modeling of inelastic rock deformation and modification processes during uplift, constrained with petrographic data, allowed reconstruction of the pre-impact position of the drilled rocks and revealed a shock attenuation by ~5 gigapascals in the uppermost 200 meters of the central uplift. The proportion of shocked quartz grains and the average number of planar deformation feature sets per grain provide a sensitive indication of minor changes in shock pressure. The results further imply that for moderately sized craters the rise of the central uplift is dominated by brittle failure.
D
uring the contact and compression phaseof hypervelocity impact, a spherical shock wave is generated, propagates through the target rocks (1), and is attenuated rapidly with increasing distance. Consequently, a variety of shock effects are produced in rock-forming min-erals, including formation of planar deformation
features (PDFs) and high-pressure phases. The relative spatial distribution of these shock trans-formations and detrans-formations formed at different pressures and temperatures [e.g., (2, 3)] in auto-chthonous rocks, at the scale of the impact structure, can be used to estimate maximum shock pressures and, consequently, the rate of shock attenuation.
However, many parameters—such as rock type as
well as lithological contrasts, texture, fabric, grain size, preshock orientation of grains, porosity, and
volatile content—influence the shock levels attained
locally. Furthermore, and typical in the case of complex impact structures (i.e., craters with
diam-eters≥2 to 4 km on Earth) (4), the original position
and distribution of the shocked rocks is modified when, because of gravitational instability of the transient cavity rim, rebound of the crater floor leads to formation of a central uplift. Redistribution of rock is also associated with the collapse of the
initially oversteepened central uplift (5).
There have been several efforts to estimate shock wave decay, mainly from nuclear and ex-plosion crater studies or by numerical modeling
[e.g., (6–8)]. Few studies have tried to quantify
shock pressure distribution in simple (9) and complex impact structures (9–16) [see supporting
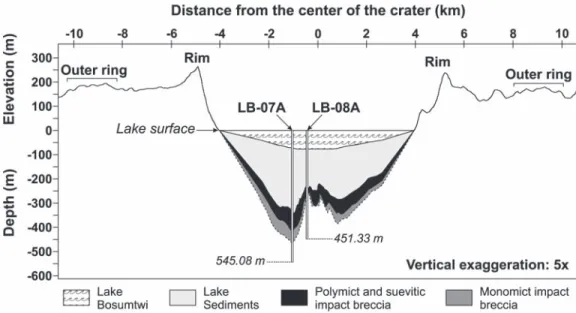
Fig. 1. Cross section of the Bosumtwi impact structure, based on Shuttle Radar Topography Mission (SRTM) data for the regional topography of the exposed por-tion of the crater (profile from west to east) and on a northwest-southeast
seis-mic reflection profile (21) across the
cen-tral crater. Location of boreholes LB-07A and LB-08A are given. The volume of lake sediments is based on seismic re-flection data. The distribution of poly-mict and suevitic impact breccia and monomict impact breccia is based on observations from cores LB-07A and
LB-08A (19, 20), as well as
interpreta-tions of seismic reflection data. Depths and elevations are relative to lake lev-el. SRTM data were available online (www2.jpl.nasa.gov/srtm/; accessed 3 March 2008).
1Department of Lithospheric Research, University of Vienna, Althanstrasse 14, A-1090 Vienna, Austria.2Institute for Dy-namics of Geospheres, Russian Academy of Sciences, Leninsky Prospect 38-1, 119334 Moscow, Russia.3Museum of Natural History (Mineralogy), Humboldt University, Invalidenstrasse 43, D-10115 Berlin, Germany.
*To whom correspondence should be addressed. E-mail: christian.koeberl@univie.ac.at