國
立
交
通
大
學
材料科學與工程學系
碩
士
論
文
超疏水反蛋白石結構應用於表面張力致浮力之研究
Fabrication of Superhydrophobic Inverse Opals for
Surface Tension-Enhanced Buoyancy
研 究 生:許議文
指導教授:吳樸偉 教授
超疏水反蛋白石結構應用於表面張力致浮力之研究
Fabrication of Superhydrophobic Inverse Opals for Surface
Tension-Enhanced Buoyancy
研 究 生:許議文
Student: I-Wen Hsu
指導教授:吳樸偉 博士
Advisor: Dr. Pu-Wei Wu
國 立 交 通 大 學
材 料 科 學 與 工 程 學 系
碩 士 論 文
A Thesis
Submitted to Department of Materials Science and Engineering College of Engineering
National Chiao Tung University in partial Fulfillment of the Requirements
for the Degree of Master
in
Materials Science and Engineering
July 2012
Hsinchu, Taiwan, Republic of China
i
超疏水反蛋白石結構應用於表面張力致浮力之研究
研究生: 許議文 指導教授: 吳樸偉 博士國立交通大學材料科學與工程學系
摘要
本研究旨在運用一便捷的方式對表面張力致浮力進行其效應之研究與探討。經由電 泳沉積、電化學沉積及疏水處理,一超疏水的氧化鋅反結構被成功製備。其表面具有超 疏水的性質,靜態接觸角達到 155±3°。理論的最大乘載重量被成功的預測,實驗浮力量 測結果對於理論計算亦顯示出良好的一致性,且奈米結構的超疏水表面對其效果有明顯 助益。此研究成果對於未來浮力相關研究深具啟發意義,並將有助於水上行走相關問題 之解決。 關鍵字:超疏水、浮力、反結構、表面張力ii
Fabrication of Superhydrophobic Inverse Opals for
Surface Tension-Enhanced Buoyancy
Student: I-Wen Hsu Advisor: Dr. Pu-Wei Wu
Department of Materials Science and Engineering
National Chiao Tung University
Abstract
This thesis is concerned with the investigation of surface tension enhanced buoyancy effect using a superhydrophobic ZnO inverse opalline structure. The sample is prepared via electrophoresis of polystyrene microspheres into a colloidal crystal, followed by electrodeposition of ZnO into the interstitial voids, removal of PS microspheres, and hydrophobic treatment to render a superhydrophobic surface whose static contact angle is measured at 155±3°. The maximum buoyant force is predicted theoretically using a mathematic model combining both surface tension effect and Archimedes principle. Results from buoyancy testing indicate nice agreements with theoretical predictions in which notable buoyancy improvement is observed in samples with nanostructured surfaces. Our results are of profound implications for future studies of buoyancy and may one day help resolve the problem of water-walking ability.
iii
Acknowledgement
兩年的時光,也是個不短的旅程,在這段時間認識了不少人,不論是因為實驗上或 是其他因緣而認識,都留下了許多美好的回憶。痛苦會過去,美會留下,縱使過程也不 是特別順遂,但這一路上走來受到許多人的幫助,才得以完成今天這篇碩士論文。首先 還是要感謝吳樸偉教授的指導,雖然時常都很忙碌也讓我看到老師對學術的熱情,老師 教我們的並不是一些死的東西,而是要根據已有的知識自己去想去活用去融會貫通,做 事做研究要更積極主動,要有獨立思考的能力,學問貴在不疑處有疑。優秀的人真正所 需具備的能力,第一是想像力、創造力,第二是洞察力、邏輯思考能力,最後才是記憶 力。這種種教誨對我們未來的學術或工作生涯等都深具啟發性,也必當銘記在心。 特別感謝我的同窗好友們小六、大仔、哲瑋、阿猛,一起度過了這一段時間,除了 在實驗上的直接幫忙外,過去的這兩年生活裡少了你們等於少了大部分的回憶,從迎新 出遊、烤肉、唱歌、暑假旅行、在實驗室一起待到很晚、一起玩桌遊等等,每個畫面都 有你們的影子,希望未來大家也都會過得很好。感謝我們這組的馬丁,實驗少了你就做 不出來了,祝研究、生活、出國都可以順利,還有馬特、陳琪、小白等帶過我的學長姊 們,你們的指導讓實驗有了更快的進展,許多實驗教學也是不可或缺的。還有實驗室許 多的學長姊們,勝結、境妤、雲閔、育淇、玉塵、致芳、筱琳、小儷、婉瑩、阿飃等, 教我做 AAO、研究生入門、Endnote、Origin 等教學,還有實驗上的大小事都受到你們 很多的幫助也提供了我新的想法。感謝我們這組的學弟妹欣儀、柏瀚,一起開會,一起 做實驗還有小組討論等,是我研究生活不可少的夥伴。雁汝、依叡、韋霖、建程、宥閔, 我也會懷念與你們相處這一年多的日子,因為有們你們而變得精彩。延璋、詠民、晟瑋、 孫佑等,你們真的是很特別的一屆,跟你們認識也快兩個月,口試、晚餐等等大小事也 感謝你們的幫忙,感謝萱維在數學上的討論。也謝謝曾經在我研究上提供很大幫助的偉 忠、小馬、力瑋等,幫我架儀器、做量測、寫作教學等,使我能更順利達成我的目標。 材料九九還有交大的朋友們,雖然未來可能就分散各地了,但相信畢業後還是常有見面iv
的機會,祝各位鵬程萬里。最後也最重要的是我的家人,感謝你們一路上的支持讓我可 以專心完成我的學業,希望你們平安快樂。謝謝大家!
v
Table of Contents
摘要 ... i Abstract ... ii Acknowledgement ... iii Table of Contents ... vList of Figures ... viii
Chapter 1 Introduction ... 1
Chapter 2 Literature Review ... 2
2.1 Superhydrophobicity in Nature ... 2
2.1.1 Lotus Leaves ... 2
2.1.2 Water Strider ... 3
2.2 Designing a Superhydrophobic Surface ... 5
2.2.1 Surface Tension and Contact Angle ... 5
2.2.2 Requirement for a Superhydrophobic Surface ... 7
2.2.3 Fabrication of Superhydrophobic Surface ... 9
2.3 Applications of Superhydrophobicity ... 15
2.3.1 Self-cleaning ...15
2.3.2 Drag Reduction for Microfluidic Devices ...15
2.3.3 Corrosion Resistance ...16
2.3.4 Electrowetting ...17
vi
Chapter 3 Experiments and Methodology ... 23
3.1 Experimental Methodology ... 23
3.1.1 Processing Steps ...23
3.1.2 Sample Preparation ...24
3.1.3 Chemicals ...25
3.1.4 Equipment ...26
3.2 Synthesis of Polystyrene Microspheres ... 27
3.3 Electrophoresis of Polystyrene Microspheres ... 28
3.4 Electrodeposition of Zinc Oxide... 29
3.5 Removal of Polystyrene Template ... 30
3.6 Surface Hydrophobic Treatment ... 30
Chapter 4 Results and Discussion ... 31
4.1 Sample Preparation ... 31
4.1.1 Synthesis of Polystyrene Microspheres ...31
4.1.2 Electrophoresis of Colloidal Crystal ...32
4.1.3 Electrodeposition of Zinc Oxide and Removal of Template ...34
4.2 Application in Investigating Superhydrophobic Properties and Surface Tension-Enhanced Buoyancy ... 36
4.2.1 Superhydrophobicity ...36
4.2.2 Buoyancy Force Calculation ...38
4.2.3 Loading Tests ...42
4.3 Effect of Interspacing Between Floating Objects ... 51
4.4 Drag Force ... 53
4.4.1 Drag Force for Various Surfaces ...53
vii
Chapter 5 Conclusion and Future Work ... 56 References ... 57
viii
List of Figures
Figure 2-1: A water droplet on a lotus leaf [6]. ... 3 Figure 2-2: (a) Topography of a lotus leaf under SEM. Scale bar=20 μm, (b) water rolling off
a hydrophilic surface, (c) water rolling off a superhydrophobic surface [3]. ... 3 Figure 2-3: (a) Maximum dimple before the leg penetrates the water surface, (b) microsetae
and (c) nanogrooves on the leg. Scale bar is 20 μm in (b) and 200 nm in (c) [8]. .. 4 Figure 2-4: (a) A bubble of spherical shape, (b) a tensioned molecule at the surface [12] and
(c) sessile drop method. ... 7 Figure 2-5: (a) Micro-hoodoo structures, (b) a two-step etching process gives micro-hoodoo
structures [5]. ... 9 Figure 2-6: Regular arrays of silicon micro-posts can be easily fabricated with various
shapes by photolithography process [18]. ... 11 Figure 2-7: SEM images of PTFE foils for (a) untreated, and oxygen plasma treated for (b)
60, (c) 120, (d) 5 min, and (e) 10 min. (e) NH3 treatment after 10 min oxygen plasma treatment [19]. ... 12 Figure 2-8: SEM images of (a) as-grown aligned CNT template, (b) topography of
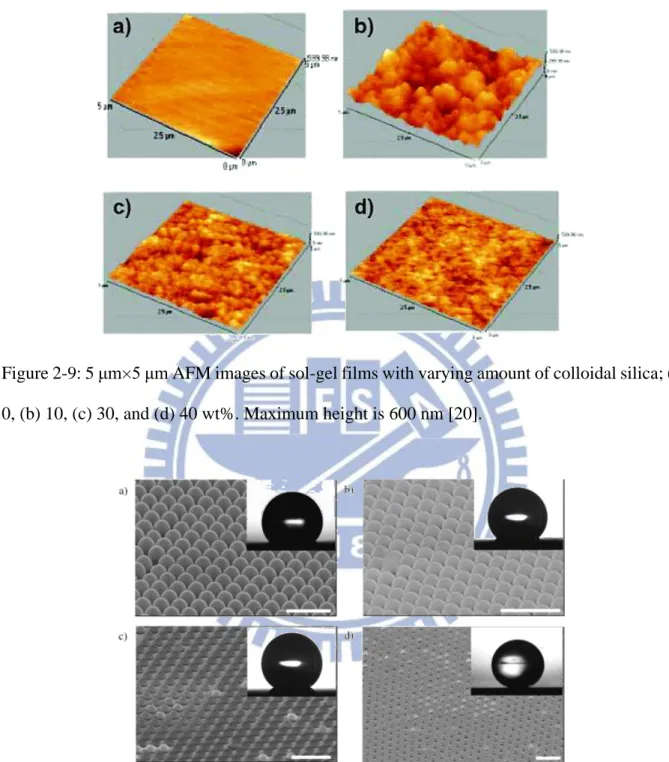
ZnO-coated CNTs, (c) cross-sectional view of ZnO-coated CNTs, and (d) TEM image of an individual ZnO-coated CNT [21]. ... 12 Figure 2-9: 5 μm×5 μm AFM images of sol-gel films with varying amount of colloidal silica;
(a) 0, (b) 10, (c) 30, and (d) 40 wt%. Maximum height is 600 nm [20]. ... 13 Figure 2-10: SEM images of size-reduced polystyrene microspheres; (a) 400, (b) 360, (c)
330, and (d) 190 nm. The scale bar is 1 μm [23]. ... 13 Figure 2-11: Candle soot as a template for silica shell. (a) Glass slide in a flame to deposit
ix
(c), (e) and (f) are magnification of (b) and (d) [24]. ... 14
Figure 2-12: Typical setup for monitoring fluidic flow on a superhydrophobic surface using PIV technique [29]. ... 16
Figure 2-13: Model of the interface between a superhydrophobic surface and sterile seawater [32]. ... 16
Figure 2-14: Optical images for droplets of 2 μL in progressive applied voltages on (a) semi-layer and (b) multi-layer ZnO inverse opals [17]. ... 17
Figure 2-15: A sketch of meniscus forming around an object. ... 21
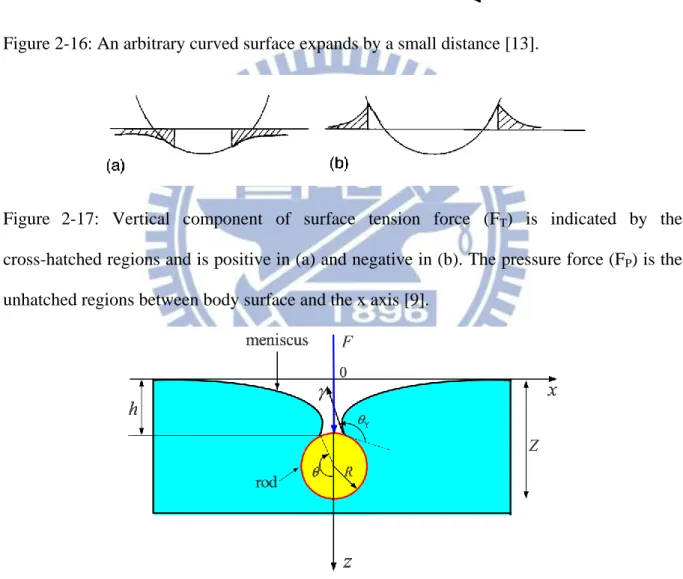
Figure 2-16: An arbitrary curved surface expands by a small distance [13]. ... 22
Figure 2-17: Vertical component of surface tension force (FT) is indicated by the cross-hatched regions and is positive in (a) and negative in (b). The pressure force (FP) is the unhatched regions between body surface and the x axis [9]. ... 22
Figure 2-18: A cylindrical rod floating on water subjected to a force F directed downward. h is the depth of meniscus, γ is the surface tension of liquid, θY is the static contact angle on flat surface and R is the radius of the rod [40]. ... 22
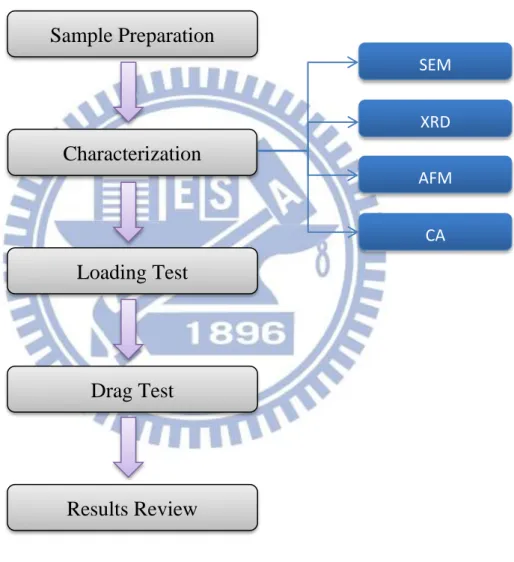
Figure 3-1: Flow chart of processing steps. ... 23
Figure 3-2: Flow chart of sample preparation. ... 24
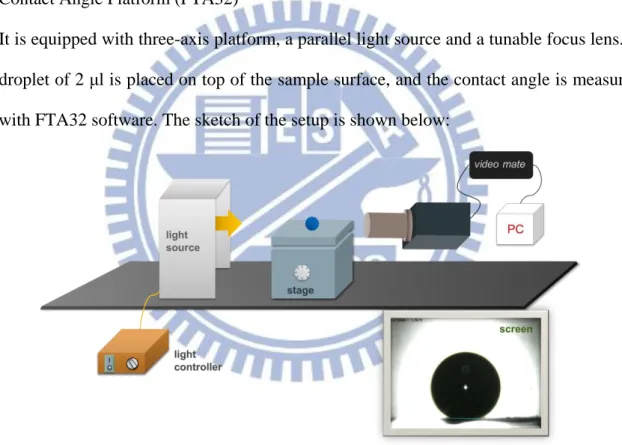
Figure 3-3: The setup of contact angle measurement. ... 26
Figure 3-4: Flow chart of the emulsifier-free polymerization. ... 27
Figure 3-5: The setup for the synthesis consists of a water bath with a nitrogen inlet, a stir, and a condenser... 27
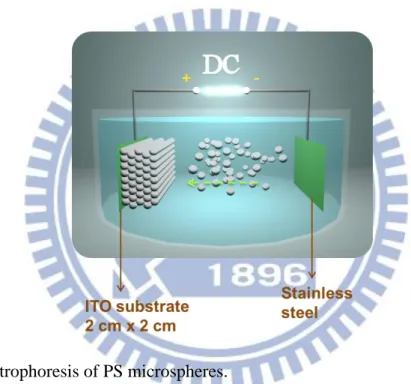
Figure 3-6: Electrophoresis of PS microspheres. ... 28
Figure 3-7: Electrodeposition of zinc oxide to PS template. ... 29
Figure 4-1: Synthesized PS microspheres show small deviation in size. ... 32 Figure 4-2: SEM images of (a) planar and (b) crossectional views of PS microspheres after
x
electrophoresis deposition. ... 33
Figure 4-3: SEM images of ZnO inverse opal. Front views (a) 3000X, (b) 35000X; side views (c) 6000X, (d) 9000X. ... 35
Figure 4-4: XRD analysis of deposited ZnO inverse opal. ... 35
Figure 4-5: Illustration of self-assembly monolayer of FAS-17. ... 37
Figure 4-6: Contact angles for (a) ITO-HP and (b) i-ZnO-HP. ... 37
Figure 4-7: Numerical results of the varying meniscus shape caused by increasing loading on the top. ... 40
Figure 4-8: The theoretical plot shows that total force increases with angle ϕ. ... 40
Figure 4-9: Theoretical relationship between maximum density and object’s length. ... 41
Figure 4-10: The plot for max buoyant force, length, and angle. ... 41
Figure 4-11: Plot for max buoyant force, surface tension and angle. Here, ϕmax = π/2+θY ... 41
Figure 4-12: The loading measurement. ... 42
Figure 4-13: Optical images for (a) 0.661, (b) 1.179 , (c) 1.696, and (d) 2.271 g. The angle changes with applied weight. ... 44
Figure 4-14: Angle ϕ vs. total buoyant force for (a) ITO-noHP-up, (b) ITO-noHP-down, (c) ITO-HP, (d) i-ZnO-noHP-down, (e) i-ZnO-noHP-up, (f) i-ZnO-HP-down, and (g) i-ZnO-HP-up. ... 45
Figure 4-15: Combination of plots for total loading vs. the angles ϕ. ... 46
Figure 4-16: Silver-like appearance on the superhydrophobic inverse opal structures. ... 46
Figure 4-17: The total buoyant force vs. their static contact angles. ... 47
Figure 4-18: Meniscus shapes at various angles. (a) 111° (b) 122° (c) 145° (d) 170° (e) 185° and (f) 202° ... 47
Figure 4-19: Demonstration of reversibility, (a) loaded, (b) unloading, and (c) unloaded. ... 49 Figure 4-20: Maximum buoyant force vs. (a) triton concentration, (b) surface tension, and (c)
xi
static contact angle. (d) All these trends follow the theoretical calculation in Section 5-2. ... 50 Figure 4-21: (a) Two wires lies side by side increase displaced volume, (b) the interspacing
of the nets is indicated by the arrow. ... 52 Figure 4-22: Using to find the critical angle, taking 0.17 mm thick wire for
example. ... 52 Figure 4-23: The setup of drag force measurement. ... 53 Figure 4-24: The average time increased for sample with increasing loading on it. ... 55
1
Chapter 1 Introduction
The intriguing behavior of water striders (pond skaters, Gerridae, Jesus bugs) has drawn a lot of attention for decades [1]. Researchers around the world have been eager to investigate the fundamental mechanism for their fast movement on water surface without sinking into the water. Hierarchical structures are responsible for making a strider’s leg superhydrophobic and enabling it to support up to 15 times of body weight.
Furthermore, due to characteristics of superhydrophobicity, it derives many practical and novel applications such as self-cleaning, drag reduction, electrowetting display, and corrosion resistance. In spite of that, surface tension enhanced buoyancy by superhydrophobic surfaces has received relatively less attention. Therefore in this research, the interesting behavior of objects floating on water is reexamined. Total buoyant force is calculated and compared with experimental values, and fundamental principles are carefully investigated to provide a rational explanation.
2
Chapter 2 Literature Review
2.1 Superhydrophobicity in Nature
Throughout billions of years of evolution, nature has given birth to a wide range of amazing biomaterials with elegantly designed topographies on micro- and nano- scales. They exhibit interesting properties such as self-cleaning effect for lotus leaves and insect wings, rapid running on water for water striders, water-harvesting ability for desert beetles, photonic crystal for peacocks and butterflies, highly adhesive force for geckos, and so forth [2]. These features have become a popular area for bio-inspired research. Among these biomaterials, we give brief descriptions of lotus leaves as well as water strider legs here, which have drawn much more attention in the past decade.
2.1.1 Lotus Leaves
Growing out of mud, the lotus remains pure and untainted. This phenomenon is known as self-cleaning effect or the “Lotus effect”. W. Barthlott et al. first observed in 1997 that Lotus leaves possess hierarchical structures-microstructures (papillae) and nanostructures (epicuticular waxes). [3] [4] These structures are able to induce superhydrophobic surfaces with small roll-off angle for a water droplet. In other words, the lotus leaves are very water-repellent, difficult for water to stick on. After a shower, the contamination on surface would be washed away with water while the surface itself stays fresh. So far, numerous researches have been carried out to examine the fundamental mechanism of this lotus effect. It was found that a rough surface decreases the solid-liquid contact area on a lotus leaf, and air is trapped below the structures, preventing water from complete wetting. A theory proposed by Tuteja et. al [5] suggested that a desirable re-entrant curvature is necessary for maintaining superhydrophobic properties. To date, a variety of methods have been explored to fabricate superhydrophobic surfaces and they will be discussed in Section 2.2.
3 Figure 2-1: A water droplet on a lotus leaf [6].
Figure 2-2: (a) Topography of a lotus leaf under SEM. Scale bar=20 μm, (b) water rolling off a hydrophilic surface, (c) water rolling off a superhydrophobic surface [3].
2.1.2 Water Strider
Some creatures including insects, spiders, birds, lizards and mammals have the ability to float above water surface even though their body densities are denser than water [7]. Among
4
them the water strider is one of the most intriguing species, since it can not only walk freely but also rest effortlessly above water, which never really wets its body. It was discovered that hierarchical structures, tiny microsetae together with nanogrooves, trap the air around their legs, giving rise to superhydrophobic property, which enables the striders to support a maximal force of 0.15 g or 15 times of body weight for a single leg [8]. It is understood that the enhanced surface tension force comes from curvature of free surface [9]. In addition, the fast movement of the water strider is performed by transferring momentum to the underlying fluid by hemispherical vortices produced by its legs [10]. Biomimetic topographies and geometry have shown that a superhydrophobic surface not only provide a larger supporting force for a water strider but also allows it to move faster on the water surface [11].
Figure 2-3: (a) Maximum dimple before the leg penetrates the water surface, (b) microsetae and (c) nanogrooves on the leg. Scale bar is 20 μm in (b) and 200 nm in (c) [8].
5
2.2 Designing a Superhydrophobic Surface
2.2.1 Surface Tension and Contact Angle
Surface energy is the amount of energy required to create a unit area of surface at constant volume and temperature:
(eqn. 2-1)
where γ is the surface energy in unit of mJ/m2, F is free energy in unit of mJ, and A is area in unit of m2. A molecule inside a bulk liquid has cohesive interactions with all the neighboring molecules and is present in a stable state. On the contrary, a molecule at the external surface loses one side of interaction with other molecules and there exists in an unstable state, as demonstrated in Figure 2-4(b). This is the origin of surface tension, because the liquid must contract its surface area as small as possible to reach a minimum of surface energy. This is also why a free droplet is always in a spherical shape. Surface energy can also be viewed as force per unit length (mN/m), which is more commonly used for liquid as surface tension. At an solid-liquid interface, it is normal to solid in the plane of surface and directed toward the liquid [12]. When a liquid is in contact with a solid, the attraction between molecules tends to reduce the total free energy of the system. It can be expressed by the Dupre equation:
(eqn. 2-2)
where Wsl is the work of cohesion per unit area between two surfaces, where γsv is solid-vapor surface tension, γlv is liquid-vapor surface tension, and γsl is solid-liquid surface tension. For a liquid droplet forming a spherical cap on a solid surface, all the surface tensions would come to an equilibrium state with a characteristic angle. This distinct angle is called the static contact angle. The total energy Etot is minimized by
( ) (eqn. 2-3)
6
respectively. It is assumed that the droplet is sufficiently small, so the effect of gravity becomes negligible. At equilibrium, dEtot=0
( ) (eqn. 2-4)
From geometrical relationship, it can be figured out that
(eqn. 2-5)
Therefore, we obtain the Young’s equation for the static contact angle
(eqn. 2-6)
There are several methods to measure surface tensions of liquids, such as Wilhelmy’s method, Du Nouy method, pendant drop method, capillary rise method, and sessile drop method [13]. Among them, static sessile drop method is the simplest and most straightforward approach in determing the surface tension. Based on Young’s equation, using a droplet of liquid with known surface tension, 72 mN/m for pure water for example, placed on top of the testing solid, the surface energy of the solid sample can be determined by the shape of the liquid drop and the static contact angle θ0, as illustrated in the Figure 2-4(c). Furthermore, shape-fitting software is often utilized to guarantee accurate measurement of the angles and reduce discrepancies in data from different operations.
In general, solid surfaces with small contact angles (< 90°) are considered hydrophilic, while those with contact angles higher than 90° are hydrophobic.
7
Figure 2-4: (a) A bubble of spherical shape, (b) a tensioned molecule at the surface [12] and (c) sessile drop method.
2.2.2 Requirement for a Superhydrophobic Surface
Generally, surfaces with a static or equilibrium contact angle larger than 150° are regarded as superhydrophobic surfaces. It is established that rough surfaces can enhance the wetting or non-wetting behaviors. There are five possible states for superhydrophobic states due to rough surfaces, including Wenzel’s state, Cassie’s state, Lotus state, transition state, and Gecko’s state [14]. In the Wenzel’s state, solid-liquid contact is in a wet-contact mode and forms a homogeneous interface without any air pockets. The equilibrium contact angle in Wenzel’s state is expressed by [15]
(eqn. 2-7)
Here, θ0 is the contact angle on a smooth surface. On the contrary, in the Cassie’s state, solid-liquid contact is in a non-wet-contact mode on solid surfaces, forming a composite interface with air pockets trapped between asperities. In this way, water slides off the surface easily. The static contact for Cassie’s state is expressed by [16]
( ) (eqn. 2-8)
where fsl the solid-liquid contact fraction. Smaller fsl leads to a larger contact angle. Lotus state is similar to Cassie’s state, but hierarchical topographies allow small contact angle hysteresis and hence water rolls off easily, just like lotus leaves. In addition, water droplets can partially
8
slide in close structures because of perturbation or external pressure, giving rise to the transition state between Wenzel’s and Cassie’s states. There is still another state called Gecko’s state for hollow, or tubular structures. Negative pressure may be produced by the volume change of sealed air in the nanotubes, resulting in adhesive force. These five states are summarized in Table 2-1.
A designing criterion for robust superhydrophobic structure has been proposed by Tuteja et al at Science in 2007 [5]. The composite interface, i.e. Cassie’s state, could transform to Wenzel’s state in some conditions where Cassie’s state is only metastable. This results in sticking of water on the surface and is undesirable. For microstructures with large interspacing, they should possess re-entrant curvature and undercut geometry, called micro-hoodoos, which is demonstrated in Figure 2-5. We believed that our inverse opal structures also possess similar features, which would help stabilize our superhydrophobic state [17].
Table 2-1: Five states of superhydrophobicity [14].
Wenzel’s State Cassie’s State Lotus State Transition State Gecko’s State
cosθw = Rf cosθ cosθc = -1+fsl (1+cosθ)
hierarchical roughness
9
Figure 2-5: (a) Micro-hoodoo structures, (b) a two-step etching process gives micro-hoodoo structures [5].
2.2.3 Fabrication of Superhydrophobic Surface
There are a number of methods to fabricate structured surfaces. Here, some examples are demonstrated in this section. Our method is stated at the end for comparison.
Photolithography is a very common process in silicon wafer industry. Light (X-ray or e-beam) is irradiated through a mask onto a flat silicon wafer covered with a layer of photoresist. After etching and removing photoresist, identical patterns of the mask will be transferred on the silicon surface. The surface is then hydrophobized by immersion in hexadecanethiol or octadecyltrichlorosilane solutions [18]. The most important advantage of photolithography is that the geometry can be controlled precisely. The effects of shapes, interspacing, and heights can be easily investigated. The disadvantages, however, are that it is an expensive process and is difficult for practical applications on other substrates.
Plasma etching is also known as dry etching. It uses gases such as oxygen, chlorine, and fluorine with an intense electric field in a vacuum chamber. Reactive atoms or ions are generated and then hit a target sample. Rough surfaces of low surface energy materials are easily produced by plasma etching, low-density polyethylene (LDPE) and PTFE for example. The advantages are that various topographies are obtained by changing temperature, pressure, power, etc., and that different elements can be introduced in the surface [19]. The disadvantages are that it needs expensive equipment and some gases are toxic.
10
Sol-gel process is a wet-chemical technique involving hydrolysis and condensation of the corresponding oxide in the presence of solvent. It starts from a colloidal solution (sol) that acts as the precursor for an integrated network (gel) of either discrete particles or continuous polymer networks. Through careful manipulation of hydrolysis, condensation, drying, and thermal treatment conditions, the surface energy as well as morphology can be controlled [20].
Chemical deposition including chemical bath deposition (CBD), chemical vapor deposition (CVD), and electrodeposition is a technique to deposit a layer of thin film via chemical reactions in liquid or vapor phase. CVD is especially ideal for uniform distribution of structures and composition over a large area but the gases may be toxic and the cost of the equipment as well as the chemicals may be high [21]. Electrodeposition, also known as electroplating, is a process where an external electric field is applied between two electrodes in an electrolyte and ions are reduced or oxidized on the electrodes to form a thin layer of material. Electrodeposition is a facile approach in comparison with CBD and CVD, and apart from metals some oxides like zinc oxide can also be achieved by this approach [22]. The deposited structures are usually modified with a self-assembly-monolayer (SAM) to render hydrophobicity.
Colloidal self-assembly of monodispersed microspheres is a facile approach to constructing three-dimensional periodic structures. Methods including gravational sedimentation, solvent evaporation, spatial confinement, and spin coating have been investigated [23]. Moreover, a fast approach of vertical electrophoresis by our group has successfully prepared opal structures with large area and reduced defects. SAM is also necessary to render hydrophobicity. However, spherical features are considered unstable due to the lack of overhang geometry.
Template method involves replication of a master substrate with desired surface features by other materials, including soft polymers or hard oxides. The master is either simply lifted off
11
or removed by chemical reaction. There are many kinds of templates available, such as lotus leaf and anodic aluminum oxide (AAO). Recently, candle soot as a template for superamphiphobic coating drew a lot of attention because of its simple fabrication [24].
Electrodeposition with colloidal self-assembly template is an inexpensive method to produce three-dimensionally ordered microporous structures, called inverse opal structures. A layer of polystyrene microspheres are first electrophoretically deposited on a sample surface. The space between the spheres is then filled with metals or oxides by electrodeposition, followed by removal of the template [25]. This method by our group combines the advantage of template method and colloidal method, and was adopted to investigate the superhydrophobic behaviors.
Figure 2-6: Regular arrays of silicon micro-posts can be easily fabricated with various shapes by photolithography process [18].
12
Figure 2-7: SEM images of PTFE foils for (a) untreated, and oxygen plasma treated for (b) 60, (c) 120, (d) 5 min, and (e) 10 min. (e) NH3 treatment after 10 min oxygen plasma treatment [19].
Figure 2-8: SEM images of (a) as-grown aligned CNT template, (b) topography of ZnO-coated CNTs, (c) cross-sectional view of ZnO-coated CNTs, and (d) TEM image of an individual ZnO-coated CNT [21].
13
Figure 2-9: 5 μm×5 μm AFM images of sol-gel films with varying amount of colloidal silica; (a) 0, (b) 10, (c) 30, and (d) 40 wt%. Maximum height is 600 nm [20].
Figure 2-10: SEM images of size-reduced polystyrene microspheres; (a) 400, (b) 360, (c) 330, and (d) 190 nm. The scale bar is 1 μm [23].
14
Figure 2-11: Candle soot as a template for silica shell. (a) Glass slide in a flame to deposit candle soot, (b) SEM of the candle soot, (c) candle soot coated with silica shell, (c), (e) and (f) are magnification of (b) and (d) [24].
15
2.3 Applications of Superhydrophobicity
Many applications benefit from superhydrophobic surfaces. Here we introduce a few of them that have attracted great deal of attention commercially and academically.
2.3.1 Self-cleaning
Self-cleaning surface is one of the most practical applications. Contaminants on a superhydrophobic surface can be easily removed by rain. This is because water forms a Cassie’s state on a low energy surface and has a low roll-off angle. Similarly, this kind of surface is also useful for anti-sticking of snow and rain for windshield and vehicles, anti-biofouling for boats, and anti-soiling for buildings. They offer various advantages, which include reduction in maintenance cost and elimination of tedious manual effort and time in cleaning work. More self-cleaning research has been reviewed by V. Anand Ganesh et al. [26].
2.3.2 Drag Reduction for Microfluidic Devices
The drag or friction reduction on a superhydrophobic surface is considered to be important especially for microfluidic devices. An air layer on superhydrophobic surface facilitates drag reduction, because it is literally frictionless when water flows by it, which has been proved using rheometer [27, 28] and PIV techniques [29, 30]. Drag reduction reduces pressure drop in pipe flows and increases fuel efficiency as well as speed of marine vessels [31]. It is worth noting that it is the rough topographies that result in superhydrophobic drag reduction rather than chemical hydrophobicity. Only grooved surfaces with air layer can lead to large slip and shear-free air-water interface.
16
Figure 2-12: Typical setup for monitoring fluidic flow on a superhydrophobic surface using PIV technique [29].
2.3.3 Corrosion Resistance
Corrosion is a degrading phenomenon for metals in contact with chemicals or oxidizing environment. Corroded materials lose their inherent mechanical properties, appearance and functionality. It is possible and novel to solve this issue by coating a superhydrophobic layer above materials surfaces, including zinc, copper, aluminum, etc. by immersion or evaporation methods [32-34]. It is believed that the reduced contact area between superhydrophobic surfaces and corrosive liquid prohibits the corrosion process. The water cannot penetrate into materials between superhydrophobic micro-asperities.
Figure 2-13: Model of the interface between a superhydrophobic surface and sterile seawater [32].
17
2.3.4 Electrowetting
Electrowetting is the modification of contact angle or wetting of liquid on a hydrophobic surface with an applied electric potential. The relationship between the applied potential and wetting phenomena was first explained by Gabriel Lippman in 1875 [35]. He discovered that the interface changes with applied electric potential. To put it in another way, the electric field can modify the surface tension. This allows manipulation of water droplets movement and adjustable lens, which are very useful for optical devices [36]. For electrowetting display, both nonaqueous and aqueous fluids can be integrated for better robustness and reliability [37].
Figure 2-14: Optical images for droplets of 2 μL in progressive applied voltages on (a) semi-layer and (b) multi-layer ZnO inverse opals [17].
18
2.4 Buoyancy Force
Water-walking ability is one of the most intriguing applications for a superhydrophobic surface. The fundamental mechanism and calculation are addressed here and they will be pushed further for investigating and improving surface tension enhanced buoyancy in our work. More than two thousand years ago, a Greek mathematician and physicist, Archimedes of Syracuse, discovered that weight of an object immersed in water is less than that in water. His findings are stated in his book On Floating Bodies [38]. The well-known Archimedes’ principles include:
Any solid lighter than a fluid will, if placed in the fluid, be so far immersed that the weight of the solid will be equal to the weight of the fluid displaced.
If a solid lighter than a fluid be forcibly immersed in it, the solid will be driven upwards by a force equal to the difference between its weight and the weight of the fluid displaced.
A solid heavier than a fluid will, if placed in it, descend to the bottom of the fluid, and the solid will, when weighed in the fluid, be lighter than its true weight by the weight of the fluid displaced.
Usually, we can simply write these propositions by:
(eqn. 2-9)
where B is buoyancy and
ρ
l, V, and g are density of object, volume of object in water, andacceleration of gravity respectively.
However, from our daily experiences, the Archimedes’ principle seems to be violated for a floating body denser than water. Therefore we must take surface tension into account. It keeps surfaces from wetting and helps water form meniscus shape around an object, resulting in increased buoyancy from curvature force, which is important for water-walking insects by keeping them totally afloat without piercing water surface.
19
“pressure force (FP)”. J. B. Keller in 1998 showed that the vertical component of the surface tension force on a body partly submerged in a liquid equals the weight of liquid displaced by the meniscus; the vertical component of the pressure force on the body equals the weight of liquid which would fill the volume bounded by the wetted surface of the body [9]. The illustration is in Figure 2-17. The surface tension force originates from the pressure difference of curved fluid interface, known as Laplace pressure after P. S. Laplace [39]. When the vapor-liquid interface is curved, there exists a pressure difference due to surface tension and its value equals surface tension times mean curvature. For example, a soap bubble of radius r has a total surface free energy of 4πr2γ and, if the radius was to decrease by dr, then the change in surface free energy would be 8πrγdr. Since shrinking decreases the surface energy, the tendency to do so must be balanced by a pressure difference (∆P) across the bubble film such that the work against this pressure difference ∆P 4πr2dr is just equal to the reduction in surface free energy [13].
(eqn. 2-10)
(eqn. 2-11)
Judging from the above expression, one can reach a conclusion that the smaller the bubble, the greater the pressure of air inside relative to that outside. Nonetheless, it is necessary to invoke two radii of curvature to describe a curved surface. For a small section of curved surface shown in Figure 2-16, two radii of curvature, R1 and R2, are indicated. If the surface is displaced by a small distance outward, the change in area (A) will be
( )( ) (eqn. 2-12)
The work done in forming this additional amount of surface is
( ) (eqn. 2-13)
There will be a pressure difference ∆P across the interface; it acts on the area xy and through a distance dz. The corresponding work is
20
(eqn. 2-14)
From geometrical aspect, it is known that
(eqn. 2-15)
The two work terms must be equal, and together with substituting expression of dx and dy, it can be deduced that
( ) (eqn. 2-16)
It is apparent that equation 2-11 is just a special case of equation 2-16 for spherical shape where R1 equals R2. Moreover, for a plane surface, both radii are infinite and ∆P is therefore zero, i.e. no pressure difference across the interface.
Consequently, as long as we know the two radii of curvature, we are able to calculate the Laplace pressure, and thus the surface tension force. This is valid only for a small surface. In order to calculate the total Laplace pressure over a larger area, we have to find a way to describe the average curvature analytically via classical Young-Laplace equation [13]:
( ) (eqn. 2-17)
The Laplace pressure at the meniscus is balanced with the hydraulic pressure, so
( ) (eqn. 2-18)
( ) (eqn. 2-19)
where apostrophe stands for derivative with respect to the coordinate z, √ ( ) is the capillary length, ρl is the density of liquid, and γ is the surface tension of the liquid.
Now we can calculate the maximum buoyant force for a hydrophobic cylindrical rod floating on water as shown in Figure 2-18. θY is static contact angle and h is the depth of meniscus. It can be estimated by integrating the volume displaced by the meniscus and the volume displaced by the body itself. Before that, one needs to solve x in terms of z and θ, and
21 this can be done with the help of Mathematica [40].
(
) √ (eqn. 2-20)
( ) √ (eqn. 2-21)
√ √ ( ) (eqn. 2-22)
The volume displaced by the wetted segment of the rod is
( ) (eqn. 2-23)
The volume of the dimple displaced by the meniscus is
∫ ( ) √ √ ( ) (eqn. 2-24)
Total buoyant force is the summation of V1 and V2. Subsequently, we should also determine when the rod will sink into water. There are two possible conditions of sinking. First, the total volume reaches its maximum, called volume criterion. Second, the nearest distance of the two menisci approaches zero, called distance criterion. It was shown by J. L. Liu [40] that volume should always be used to determine when a hydrophobic circular rod is expected to sink into the liquid.
These calculations will be modified to calculate the maximum buoyant force in our experiment later.
22
Figure 2-16: An arbitrary curved surface expands by a small distance [13].
Figure 2-17: Vertical component of surface tension force (FT) is indicated by the cross-hatched regions and is positive in (a) and negative in (b). The pressure force (FP) is the unhatched regions between body surface and the x axis [9].
Figure 2-18: A cylindrical rod floating on water subjected to a force F directed downward. h is the depth of meniscus, γ is the surface tension of liquid, θY is the static contact angle on flat surface and R is the radius of the rod [40].
23
Chapter 3 Experiments and Methodology
3.1 Experimental Methodology
3.1.1 Processing Steps
Figure 3-1: Flow chart of processing steps.
Sample Preparation
Characterization
Loading Test
Results Review
SEM XRD AFM CADrag Test
24
3.1.2 Sample Preparation
Figure 3-2: Flow chart of sample preparation.
Synthesis of Polystyrene microspheres via
Emulsifier-Free Polymerization
Preparation of Suspension
2x2 cm
2ITO
Electrophoresis of PS
Electrodeposition of ZnO
25
3.1.3 Chemicals
1. Styrene (CH2CHC6H5)
Purity 99.6 wt%, Sigma-Aldrich, CAS No. 100-42-5 2. Sodium Bicarbonate (NaHCO3)
Purity 100.2 wt%, J.T.Baker, CAS No. 144-55-8 3. MN-Aluminum Oxide (Al2O3)
Macherey-Nagel, CAS No. 1344-28-1, particle size 70-230 mesh 4. Potassium Persulfate (K2S2O8)
Purity 99.4 wt%, J.T.Baker, CAS No. 7727-21-1 5. Ethanol (C2H5OH)
Purity 99.9 vol%, ECHO, CAS No. 64-17-5 6. Zinc Nitrate (Zn(NO3)2•6H2O)
Purity 99.6 wt%, J.T.Baker, CAS No. 10196-18-6 7. 1H,1H,2H,2H- Perfluorodecyltriethoxysilane (FAS-17)
26
3.1.4 Equipment
1. Scanning Electron Microscope (SEM)
SEM JEOL LSM-6700 is used to observe surface morphologies. Acceleration voltage is 15 kV, and probe current 10 mA. To increase conductivity, a layer of platinum was puttered.
2. X-Ray Diffractometer (XRD)
XRD Bede-D8 is used to determine the crystallinity of Zinc Oxide. 3. Contact Angle Platform (FTA32)
It is equipped with three-axis platform, a parallel light source and a tunable focus lens. A droplet of 2 μl is placed on top of the sample surface, and the contact angle is measured with FTA32 software. The sketch of the setup is shown below:
Figure 3-3: The setup of contact angle measurement. 4. Power Supply
Keithley 2400 provides stable direct current for electrophoresis and electrodeposition. 5. Atomic Force Microscopy (AFM)
AFM is utilized to investigate the detailed 3-dimentional morphologies of inverse opal structure.
27
3.2 Synthesis of Polystyrene Microspheres
An emulsifier-free polymerization is adopted to synthesize polystyrene microspheres. The flow chart of the synthesis process is illustrated below:
Figure 3-4: Flow chart of the emulsifier-free polymerization.
The entire process was carried out at a temperature of 65°C, stir rate 260 rpm, and 300 c.c./min nitrogen. Monodispersed PS microspheres having a size of 500 nm is synthesized, with a deviation of 13.8 nm.
Figure 3-5: The setup for the synthesis consists of a water bath with a nitrogen inlet, a stir, and a condenser.
28
3.3 Electrophoresis of Polystyrene Microspheres
The self-assembled colloid crystal can be obtained by an electrophoretic deposition process. The colloid suspension is prepared by adding 5 grams of dried PS into 1 liter of anhydrous ethanol. After placing working electrode, ITO glass (4 cm2, resistivity 1.42±0.12 Ω∙cm), and counter electrode in the cell of suspension, a voltage of direct current is applied. The electric field is 10 V/cm, and the deposition time is 15 min. Then the sample is first dried in air and kept in 90°C oven afterwards before following step.
29
3.4 Electrodeposition of Zinc Oxide
The template of polystyrene opal undergoes electroplating process. The electrolyte is a water-based solution with 0.05 M zinc nitrate. Before the electrodeposition, the working electrode, the template, is immersed in a solution of ethanol and water for 20 seconds (ethanol : water = 1:4 vol%). Zinc plate serves as the counter electrode, as shown in Figure 3-4. During deposition, the temperature is maintained at 65°C using a water bath, and 1 mA/cm2 direct current is applied. After that, the sample is washed with DI water and dried.
30
3.5 Removal of Polystyrene Template
The zinc oxide deposited template is then heat treated at 500°C for 1 hour. The PS microspheres are removed after the heat treatment, and zinc oxide inverse opal is thus obtained.
3.6 Surface Hydrophobic Treatment
The aforementioned FAS-17 was utilized as a hydrophobizing agent. A container of 1 wt% FAS-17 in methanol solution is prepared. The zinc oxide inverse opal is kept in a container under room temperature for 10 hours and later dried in air at 100°C for 1 hour. In this way the fluorosilane monomers can spontaneously attach to the surface structure of zinc oxide inverse opal via self-assembly monolayer (SAM) and render water repelling effect. In combination with structured surface, Cassie state is established, leading to a large contact angle, superhydrophobic surfaces.
31
Chapter 4 Results and Discussion
4.1 Sample Preparation
4.1.1 Synthesis of Polystyrene Microspheres
The polystyrene microspheres were synthesized through an emulsifier-free polymerization, which takes more time than traditional emulsifier polymerization but is more environmentally-friendly and monodispersed microspheres are possible. By simply changing co-monomer concentration, monodispersed PS ranging from 200 to 1000 nm can be successfully synthesized.
The reaction mechanism of emulsifier-free emulsion polymerization for synthesizing PS microspheres is demonstrated below [41]:
Initiation:
K2S2O8 → SO4
-•
Potassium persulfate (K2S2O8, KPS) dissolves in water and form S2O82- and K+. The O-O bond of the KPS breaks when heated, and subsequently decomposes into sulfate radicals.
Propagation: SO4 -• + M → SO4 ─M• SO4 ─M•+ M → SO4 -─M -─M•
The sulfated radicals are unstable and react with styrene monomers, and chain reaction propagation continues. Termination: SO4 -─(M)n -•+ SO4 -─(M)m -• → SO4 -─(M)n+m─ SO4
When two ends of polymer chains carrying a radical come into contact, the reaction stops. Every polystyrene chain has two sulfate ligands, and when the polystyrene become insoluble (appears white), the polymer chains curl inward to form nuclei particles. On the outer of particle
32
are sulfate ligands which carry negative charges and stabilize the suspension. The nuclei keep growing until exhausting all the monomers.
The variables in emulsifier-free polymerization include monomer concentration, ionic strength of solution, initiator concentration, temperature, and pH, etc. The sodium bicarbonate is used to adjust the pH value and ionic strength. The concentration of sodium bicarbonate should not be too high or the particles would aggregate. In addition, the styrene monomer goes through aluminum oxide powders to remove the inhibitor. In our work, we successfully synthesized monodispersive PS microspheres with 500 nm in diameter and with a standard deviation of 13.8 nm.
Figure 4-1: Synthesized PS microspheres show small deviation in size.
4.1.2 Electrophoresis of Colloidal Crystal
The template was prepared by electrophoretic deposition of polystyrene microspheres. This method provides facile and rapid fabrication of well-ordered PS opal structure. There are mainly two aspects of factors that affect the self-assembly of electrophoretic deposition. One is the suspension’s properties, i.e. concentration, viscosity, etc. The other is external factors including applied electric field and deposition time, etc. Equation 4-1 is Hamaker equation [42], which is used to predict the relationship between the weight of deposit and the above parameters.
33
( ) ( ) (eqn. 4-1)
C is concentration of the colloidal suspension; ε0 is the constant of permittivity in vacuum;
ε
r is the relative dielectric constant; ζ is zeta potential on particle surface; η represents the suspension viscosity; E is the applied electric field; L is the spacing between two electrodes; t is the deposition time. If C, εr, ζ, η and L are fixed, the deposited weight is a function of E and t.For ideal morphology of opal structure, microspheres are arranged in FCC structure with (111) facet. When the electric field is too high, the coating rate gets too fast. As a result, the microspheres do not have enough time to arrange properly to form close-pack structure, leading to a disordered arrangement. In contrast, if the electric field is too low, the coating rate gets too slow, and consequently they arrange disorderly. The microspheres prefer to form clusters to reduce the total energy. After extended studies, we chose a potential of about 10 V to optimize the self-assembly process. The results of close-pack PS opal are presented in Figure 4-2.
By increasing the time of electrophoretic deposition, we can prepare opal structures with increasing heights. For the samples used in the experiment, they are deposited for 15 minutes, resulting in an average thickness of about 20 μm.
Figure 4-2: SEM images of (a) planar and (b) crossectional views of PS microspheres after electrophoresis deposition.
34
4.1.3 Electrodeposition of Zinc Oxide and Removal of Template
Zinc oxide inverse opals were electrodeposited by galvanostatic electrodeposition. PS template is placed as working electrode while zinc plate serves as counter electrode. Temperature was kept at 70°C throughout the process. Deposition time was 60 minutes. The mechanism of zinc oxide deposition is as follows [43].
Zn(NO3)2 Zn2++2 NO3 -NO3 -+H2O+2 e- NO2 -+2 OH- Zn2++2 OH Zn(OH)2 Zn(OH)2 ZnO+H2O
Before deposition, the PS template was immersed in a mixture of alcohol and water to increase the wettability of PS with the electrolyte. The resulting thickness of the inverse opal structure is approximately 8±1 μm. Their SEM images are shown in Figure 4-3. The SEM images suggest that the pores in zinc oxide inverse opal still preserve FCC structure. The amount of zinc oxide is about 0.02 g, which is negligible compared to the weight of ITO substrate itself. Besides, the XRD image in Figure 4-4 shows that the zinc oxide does not have preferred orientation. The strengths and peaks agree with data from JCPDS. Some minor peaks not indicated are from signals of the substrate, ITO.
Finally, to remove the polystyrene template after electrodeposition, the as-deposited ZnO-PS samples were heat-treated at 500°C for one hour. The inverse opal structures remained intact while organic PS was burned away.
35
Figure 4-3: SEM images of ZnO inverse opal. Front views (a) 3000X, (b) 35000X; side views (c) 6000X, (d) 9000X.
36
4.2 Application in Investigating Superhydrophobic Properties and Surface
Tension-Enhanced Buoyancy
4.2.1 Superhydrophobicity
To enhance the hydrophobicity of zinc oxide inverse opals, the samples are coated with a low energy substance, FAS-17, via self-assembly monolayer (SAM).
After finishing surface modification, the samples become more hydrophobic. As exhibited in Table 4-1 and Figure 4-6(b). We adopted a spherical fitting mode when measuring these contact angles.
Here HP stands for hydrophobized, and i means inverse opal.
The first thing we can deduce from these numbers is that hydrophobicity of “flat” objects only improves slightly after the hydrophobic treatment. However, in the case of inverse opal structure, the effect is much better. This indicates that to acquire superhydrophobic surface it is necessary to have porosity or roughness on the surface, as predicted by Cassie’s theory. For the i-ZnO used, there are numerous interconnected pores that facilitate trapping air in the structure. We can therefore estimate the equilibrium contact angle using Cassie’s theory.
cosθeq = -1 + fSL (1+cosθ0) = -1 + 0.24*(1 + cos114°) ≈ cos(149° ) (eqn. 4-2)
This value partly agrees with the experimental values. Experimentally the inverse opals show contact angles greater than 150° and tilt angle smaller than 10°. The contact angle that is even larger than the expected one is owing to the surface roughness apart from the pores. The top surface is uneven and thus further reduces solid-liquid contact area below 24%.
37
Figure 4-5: Illustration of self-assembly monolayer of FAS-17.
Figure 4-6: Contact angles for (a) ITO-HP and (b) i-ZnO-HP.
Table 4-1: Static contact angles for various surfaces.
Sample Glass ITO ITO-HP ZnO plate-HP i-ZnO i-ZnO-HP Contact
Angle
38
4.2.2 Buoyancy Force Calculation
Theoretical calculation for buoyant force estimation was carried out. The substrates we used in experiments have dimensions of 2 cm for both width and length, and 0.08 cm in height. The deposited zinc oxide has a relatively small height (<0.005 cm), so it is negligible. Using the assumption and similar procedure described in the introduction part, we further calculate the buoyancy in our case.
Maximum buoyancy force, including surface tension force and pressure force, equals to the weight of liquid displaced by object and its meniscus, as discussed in Section 2.4. For water, weight is the same as volume so we just calculated the volume instead. Total displaced volume here is divided into two parts, V1, the volume of the partly wetted body, and V2, the volume enclosed by the meniscus. Unit length is assumed for simplification in following steps. The following computation and plots have been worked out with the help of math software
Mathematica.
The shape of meniscus can be described by meniscus equation,
( ) (eqn. 4-3)
Applying force balance and simplification, (κ is the capillary length)
( ) (eqn. 4-4)
39 (
) √ (eqn. 4-5)
[ ] √ (eqn. 4-6)
From geometrical relationship, h can also be rewritten as.
√ √ 𝑆 𝜙 (eqn. 4-7) V1 = (( √ )) V2 = ∫ { [ ] √ [ ] √ } { 𝜙 } (eqn. 4-8)
The total volume can be expressed by summation of V1 and V2.
𝜙
( ( √ )) (eqn. 4-9)First, we adopted the Young-Laplace equation to characterize the cross-section profiles of the menisci as illustrated in Figure 4-7. The angle and depth increase with amount of load, so is the volume. Besides, when the angle
ϕ
reaches 180 degrees, the meniscus starts necking rapidly and surface tension force decreases. As the depth increases, the curvature near the edge increases correspondingly, indicating equilibrium with hydraulic pressure at greater depth. We showed in our work later that a hydrophobic coating on top can stabilize this shape. Second, we plotted the theoretical relationship between maximum total buoyant force and angleϕ
via eqn. 4-9 in Figure 4-8, given a fixed length 20 mm. Before reaching 90°, the force decreases with increasingϕ
. After that point, the force increases monotonically withϕ
. Third,40
the maximum equivalent density and object length is in Figure 4-9. Obviously the shorter the length is, the denser the object it can support. Fourth, we combined max loading (g),
ϕ
(deg)and length (mm) together in Figure 4-10, given a fix thickness of 0.8 mm. Last but not least, we also took into account surface tension (mN/m) variation condition in Figure 4-11, given a fixed length of 20 mm and a fix thickness of 0.8 mm. By measuring the surface tension and static contact angle, the maximum surface tension-enhanced buoyancy can be evaluated.
Figure 4-7: Numerical results of the varying meniscus shape caused by increasing loading on the top.
41
Figure 4-9: Theoretical relationship between maximum density and object’s length.
Figure 4-10: The plot for max buoyant force, length, and angle.
42
4.2.3 Loading Tests
Experiments were carried out for measuring the maximum total buoyant forces, angles, and other conditions. A PMMA container (30 cm × 2.5 cm × 5 cm) was filled with 200 mL DI water. The analyzed samples were carefully placed on the water surface. A camera (Nikon D90) with 28-105 macro lens was set up by the container to observe the changing angle of water. One piece of weight was added each time. Each one has weight 0.05803 g with a standard deviation of 0.00067 g. An illustration of the set-up is shown below.
Figure 4-12: The loading measurement.
4.2.3.1 Total Buoyant Force vs. Angle
ϕ
We carried out experiments investigating the changing angles
ϕ
vs. the applied force. Theϕ
is the angle measured with respect to vertical line. Samples included ITO with or without hydrophobic treatment (HP), and inverse ZnO opal with or without hydrophobic treatment. All the results are plotted in Figure 4-14. For structured surface and ITO side, “up” indicates such surfaces are upward, contacting the air, and “down” indicates they are downward, contacting the water.We combined all the seven conditions for comparison in Figure 4-15. The trends appear similar at small ϕ, indicating that the meniscus profile is independent of samples. Moreover, contrary to what we initially anticipated that the superhydrophobic inverse structures under the
43
sample should be able to support much greater additional loading. The reason was later found out that when several structures are too close to each other, the extra volume provided by surface tension would cancel each other. The details are examined in the next section by conducting calculation and experiments on a larger scale. Besides, compared to pure hydrophobic ITO, the superhydrophobic inverse structure in water still gives 0.1 to 0.15 g increase. It is from a layer of gas blanket, i.e. the air trapped below the sample, which, though not much, offers extra displaced volume. It can be observed from the silver-like appearance when the sample is immersed in water (Figure 4-16). This corresponds with the findings by Qinmin Pan et al [44] that a film of air would surround structured superhydrophobic surfaces and thus provide extra buoyancy.
Furthermore, we also examined the relationship between the static angle and maximum loading capacity in Figure 4-17. The result shows that the total buoyant force is proportional to the static contact angle, especially for superhydrophobic inverse structure. Though having contact smaller than ITO, non-hydrophobic inverse structure exhibits better loading capacity. This phenomenon is due to the improvement of contact line pinning by the porous structure, suggesting possible existence of metastable Cassie state [5]. Overall the loading behavior followed the prediction in Section 4.2.2 that total buoyant force should be in positive relation with the angle
ϕ
. The experimental shapes of menisci at various angles were compared with theoretical shapes in Figure 4-18, in which experimental menisci (right) show well agreement with theoretical menisci (left). Nevertheless, the errors in measuring the angleϕ
and the force came from a few aspects. First, we could not control the center of weight precisely at the center, so all sides might not pierce the water at the same time, consequently reducing the maximum loading. Second, the weight was placed with tweezers as gently as possible. However, we could not avoid the suddenly pushing down and decelerating of the weight. Third, the ITOs were not perfectly smooth at the edge, bringing about some undesirable44
effects. Fourth, the angles were manually measured and inevitably resulted in values smaller than actual values. These errors possibly lead to lower loading capacity, and they may be countered by more careful micro-conduct of experiments.
Figure 4-13: Optical images for (a) 0.661, (b) 1.179 , (c) 1.696, and (d) 2.271 g. The angle changes with applied weight.
Table 4-2: Static contact angles, max angle
ϕ
, and maximum force for various surfaces on top.ITO-noHP-glass ITO-noHP-ito ITO-HP i-ZnO i-ZnO-HP
Static Contact Angle (deg) 49.05 87.51 99.27 78.64 155.45 Max Angle
ϕ
(deg) 150.7 177.9 160.7 175.0 195.8 Max Force (g) 1.84±0.06 1.87±0.05 2.01±0.03 1.99±0.09 2.21±0.0645
Figure 4-14: Angle
ϕ
vs. total buoyant force for (a) ITO-noHP-up, (b) ITO-noHP-down, (c) ITO-HP, (d) i-ZnO-noHP-down, (e) i-ZnO-noHP-up, (f) i-ZnO-HP-down, and (g) i-ZnO-HP-up.46 0.6 0.8 1.0 1.2 1.4 1.6 1.8 2.0 2.2 2.4 100 120 140 160 180 200 ITO-noHP-down ITO-noHP-up ITO-HP-up i-ZnO-noHP-down i-ZnO-noHP-up i-ZnO-HP-down i-ZnO-HP-up An g le (d e g ) Total Force (g)
Figure 4-15: Combination of plots for total loading vs. the angles
ϕ
.47 40 60 80 100 120 140 160 1.5 1.6 1.7 1.8 1.9 2.0 2.1 2.2 2.3 2.4 2.5 T o ta l F o rce (g )
Contact Angle (deg)
Figure 4-17: The total buoyant force vs. their static contact angles.
Figure 4-18: Meniscus shapes at various angles. (a) 111° (b) 122° (c) 145° (d) 170° (e) 185° and (f) 202°
48
4.2.3.2 Force vs. Structured Surfaces
Further discussion of two cases, ITO-HP and i-ZnO-HP-up are provided here.
We found that for the case of superhydrophobic ZnO inverse opal on top, angle
ϕ
can exceed 180 degrees as in Figure 4-13 (d) and Figure 4-14 (g). The assumption made by Y.S. Song et al [45] and A. R. Pennar [46] were not valid. They assumed the angle contacting the object cannot exceed 180° because the surface tension force would then reach a maximum. Actually, one should also take into account the pressure force term, which is not necessarily maximized when the surface tension force reaches maximum.The corollary of such structured superhydrophobic surface on top of the sample is that it can induce a larger floatability by several means: (i) Stabilize larger angle and thus sustain higher loading, (ii) hinder further movement or wetting on the top surface, (iii) impede the advancement of contact line at the edge, (iv) reveal reversibility once the loads are taken away (Figure 4-19). The reason for that is the increase of total energy when water contacts the superhydrophobic structures. The effect of water droplet pinning at the edge has been addressed by others as Gibbs’ inequality from the book “The Collected Works of J. Willard Gibbs” in 1957. As stated by David Quere [47] and J. F. Oliver [48] that the angle
ϕ
at the edge can vary by:𝜙 (eqn. 4-10)
where θ0 is static contact angle, and ω is the angle subtended by the side wall, 90° in our case. Since all the samples have identical geometry, the maximum angle at the edge should be the same for all cases. However, this is not true as this angle varied from one case to another, especially for superhydrophobic ZnO inverse opals. This is ascribed to the existence of a structured superhydrophobic surface, which is necessary for enhancing this effect. The effect is also useful for application in solving the liquid outflow phenomena [49].
49
Figure 4-19: Demonstration of reversibility, (a) loaded, (b) unloading, and (c) unloaded.
4.2.3.3 Force vs. Surface Tension
We added another parameter, surface tension, into the maximum force to verify the applicability of the calculation. By adding a minute amount of surfactant, Triton X-100, into pure water, the surface tension can be easily tuned with little variation of other properties, such as density and viscosity. The solution was prepared by dissolving certain amount of triton in one liter of DI water and heating it at 50°C for one hour. Hydrophobic ITO samples were used in these tests. The results are summarized in Table 4-3 and Figure 4-20.
The experimental results also coincide with the predicted trend of maximum loading and surface tension. As the concentration of triton increases, both the surface tension and contact angle decrease. As a result, the maximum loading force increases correspondingly. Nevertheless, the mismatch between theoretical and experimental values is because the contact line is more prone to movement in the presence of surfactant.
Table 4-3: The characteristics and results for various surfactant concentrations.
Triton Conc. per liter 0 ul 4 ul 20 ul 100 ul 500 ul
Static Contact Angle (deg) 109.01 105.05 95.18 77.14 56.27
Surface Tension (mN/m) 72 50.7 43.8 30.8 30.6
Max Force (g) 2.01±0.03 1.78±0.08 1.48±0.11 1.14±0.10 1.05±0.06
50
Figure 4-20: Maximum buoyant force vs. (a) triton concentration, (b) surface tension, and (c) static contact angle. (d) All these trends follow the theoretical calculation in Section 5-2.
51
4.3 Effect of Interspacing Between Floating Objects
Intuitively, it is reasonable that the total buoyant force would increase with increasing amount of solid-liquid contact length, which supposedly increases surface tension term effectively. For example, if a water strider has more legs, it should be able to support much heavier body arising from more displaced liquid as Figure 4-21(a).
We applied the calculation in previous sections to estimate the buoyant force of nets with various interspacing, as indicated by the arrow in Figure 4-21(b).
The maximum volume displaced per unit length for a single wire is expressed by:
( ) ( ( ) √ √ )
(eqn. 4-11) By plotting the graph and using to find the critical angle, we can determine the maximum volume obtained by a single wire. For example, for a wire of radius R=0.085 mm and an equilibrium contact angle of θY=5 π/9, the critical angle is estimated at 158.3°, which results in a maximum buoyant force of 0.16 g/cm. Then by multiplying the total length of wire mesh, ( ) , the theoretical weight is attained.
The results are summarized in Table 4-4. We can notice that the maximum loading capacities are significantly smaller than those predicted by theoretical calculations in all cases. This is because there is inadequate interspacing between two or more wires. The larger the interspacing is, the less the force loss. The buoyant force exerted by volume created by surface tension overlaps with one another, as was seen in a work of water strider robots by Y.S. Song et al [45]. In addition, from observation under stereomicroscope, the water in the pore advanced just a little, so is the angle
![Table 2-1: Five states of superhydrophobicity [14].](https://thumb-ap.123doks.com/thumbv2/9libinfo/8736929.203379/21.892.126.819.417.935/table-five-states-of-superhydrophobicity.webp)
![Figure 2-6: Regular arrays of silicon micro-posts can be easily fabricated with various shapes by photolithography process [18]](https://thumb-ap.123doks.com/thumbv2/9libinfo/8736929.203379/24.892.162.742.414.868/figure-regular-arrays-silicon-fabricated-various-photolithography-process.webp)
![Figure 2-11: Candle soot as a template for silica shell. (a) Glass slide in a flame to deposit candle soot, (b) SEM of the candle soot, (c) candle soot coated with silica shell, (c), (e) and (f) are magnification of (b) and (d) [24]](https://thumb-ap.123doks.com/thumbv2/9libinfo/8736929.203379/27.892.125.817.99.804/figure-candle-template-deposit-candle-coated-silica-magnification.webp)
![Figure 2-12: Typical setup for monitoring fluidic flow on a superhydrophobic surface using PIV technique [29]](https://thumb-ap.123doks.com/thumbv2/9libinfo/8736929.203379/29.892.268.673.122.393/figure-typical-setup-monitoring-fluidic-superhydrophobic-surface-technique.webp)
![Figure 2-14: Optical images for droplets of 2 μL in progressive applied voltages on (a) semi-layer and (b) multi-layer ZnO inverse opals [17]](https://thumb-ap.123doks.com/thumbv2/9libinfo/8736929.203379/30.892.162.799.414.750/figure-optical-images-droplets-progressive-applied-voltages-inverse.webp)